



Gold (XAU) lost 2.13% last week and closed Friday near $4,285. The 10-year Treasury yield surged above 5% while the US dollar gained 0.82% over the week. Both eased slightly on Friday, but gold found little relief. The PCE inflation report on Wednesday could show whether that pressure will continue in gold. In my view, gold needs real yields and the dollar to ease before it can make a strong recovery. This article discusses the signals from the technical structures of the US Treasury yields and the US dollar to understand the next move for gold.
Gold Outlook: 5% Treasury Yields and Rising Real Rates
10-Year Yield Nears 5.20%–5.35% Resistance
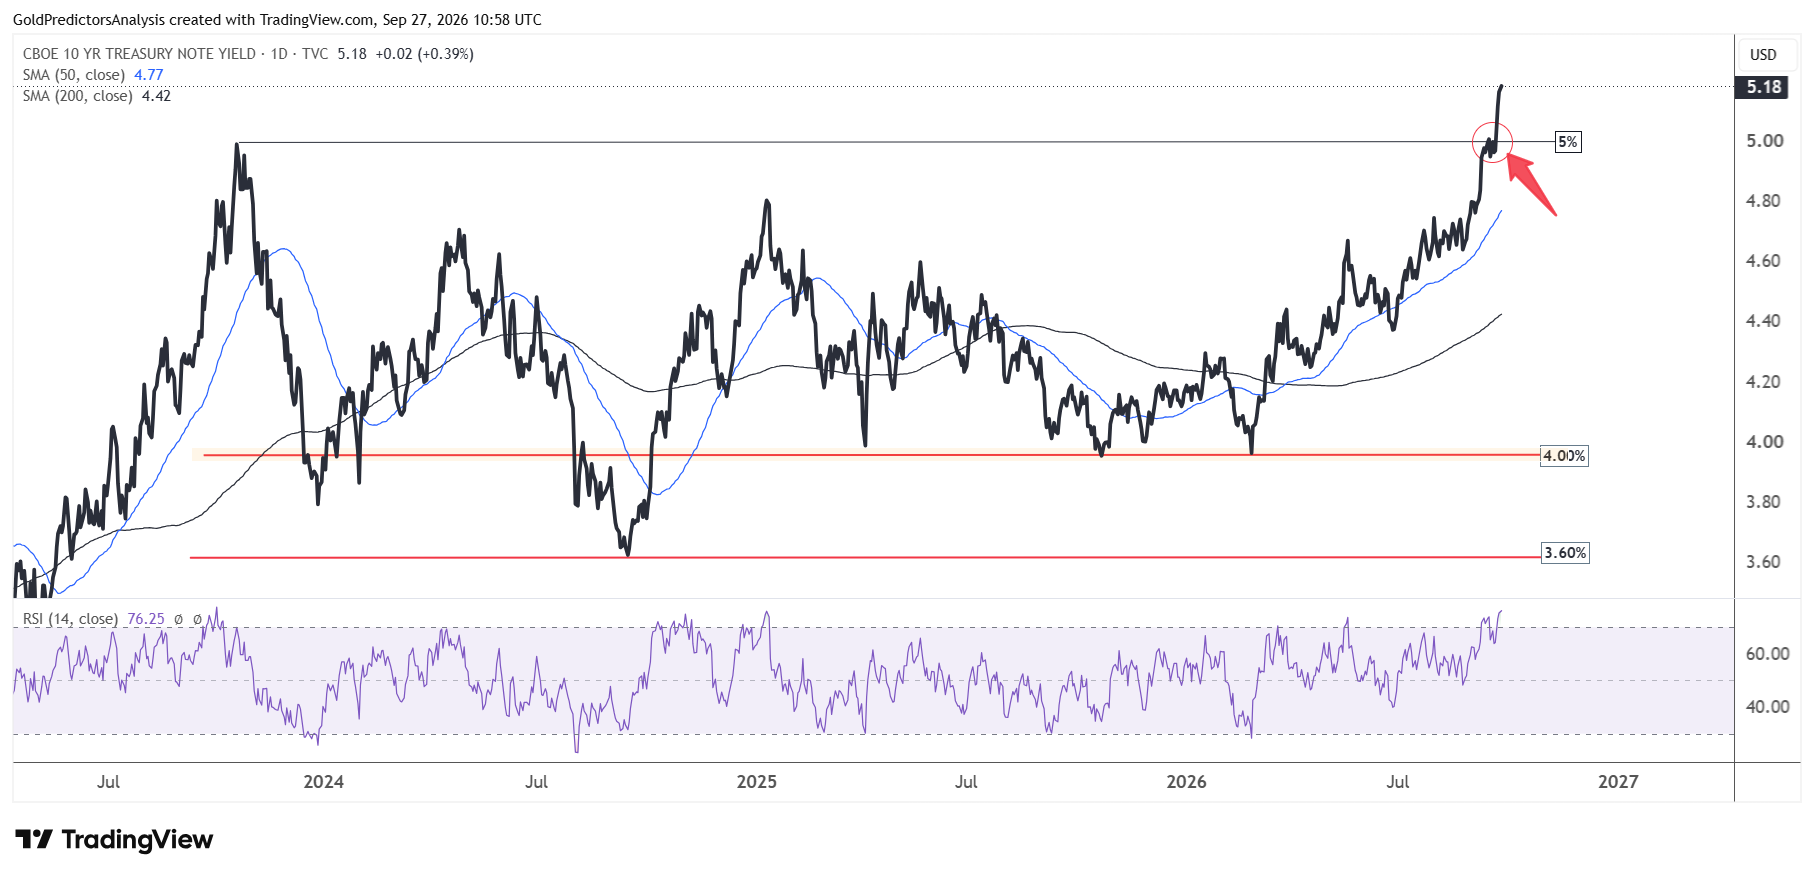
The strong business data from the US has kept another rate hike by the Fed in focus. The September flash composite PMI rose to 58.4 from 56.0 in August and companies reported a sharp rise in costs. The 10-year Treasury yield increased from 4.96% on Tuesday to 5.23% on Friday.
The daily chart for the 10-year US Treasury yields shows that it has broken above 5%. The yield also remains above the 50-day and 200-day moving averages while the RSI has increased to 76. This structure suggests a strong bullish momentum for the Treasury yields. The key question for gold is whether the 10-year US Treasury yields can stay above 5% after the recent jump.
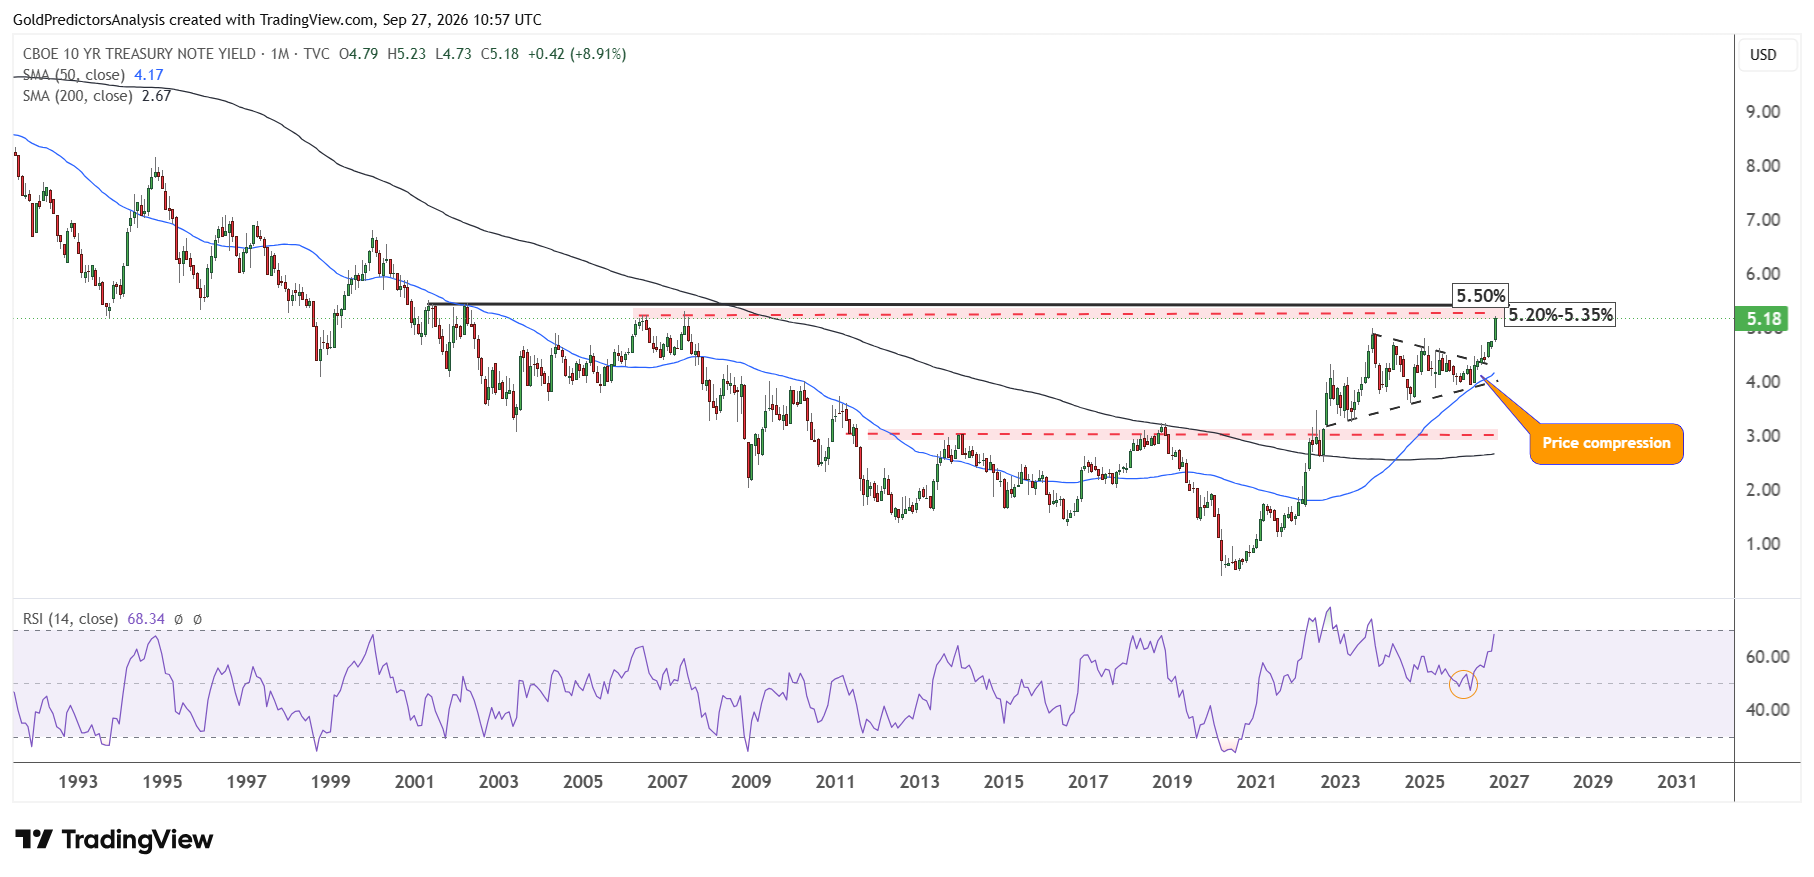
The monthly chart of 10-year US Treasury yields shows that it remains near the resistance zone of 5.20%-5.35% in the long term. A break above this area could push it to 5.50%, which is close to May 2001 high. The positive momentum in the US 10-year Treasury yields is driven by the price compression pattern from October 2023 to April 2026.
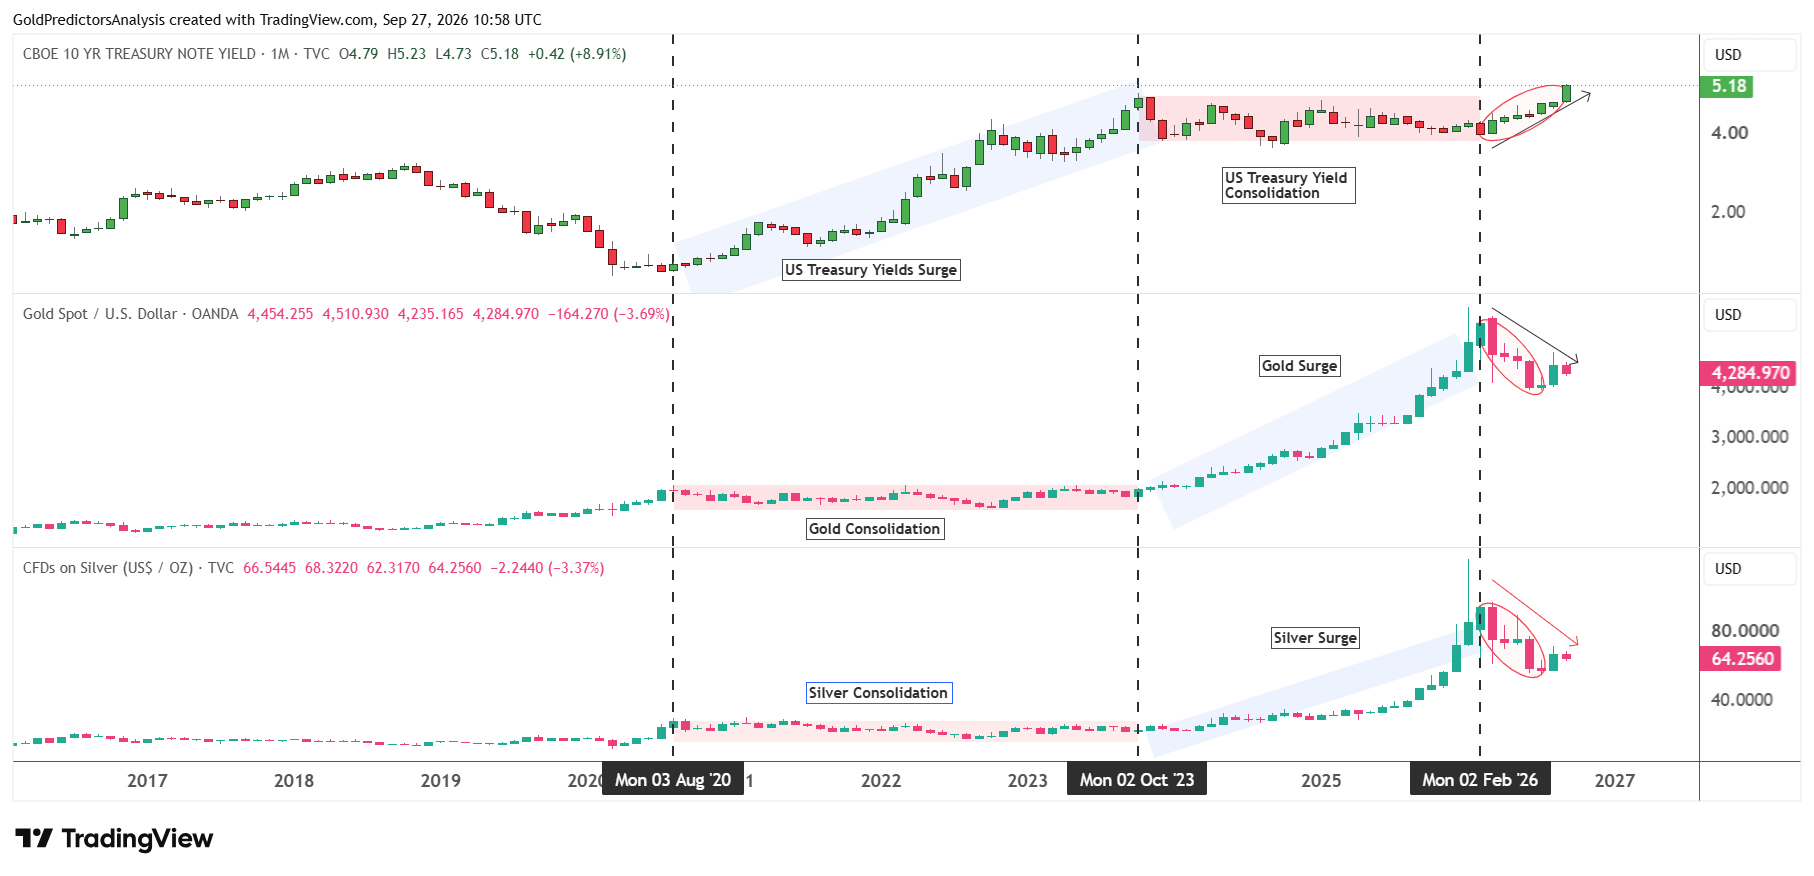
The chart below compares the Treasury yields with the gold and silver (XAG) price which shows why this relationship needs care. Gold rose sharply in 2024 and 2025 despite the elevated yields. But the US Treasury yields did not produce a new high in this period as they consolidated between 4% and 5%. A high yield alone does not decide the direction for gold.
The US Treasury yields are now breaking the key resistance areas in September 2026. This suggests that the gold and silver prices may face pressure in the short term before finding a significant bottom.
Gold Price Forecast
Every new Gold analysis as it publishes, today's technical signal and key levels, live price — on one page.
See all Gold forecastsReal Yields Rise While Inflation Expectations Stay Flat
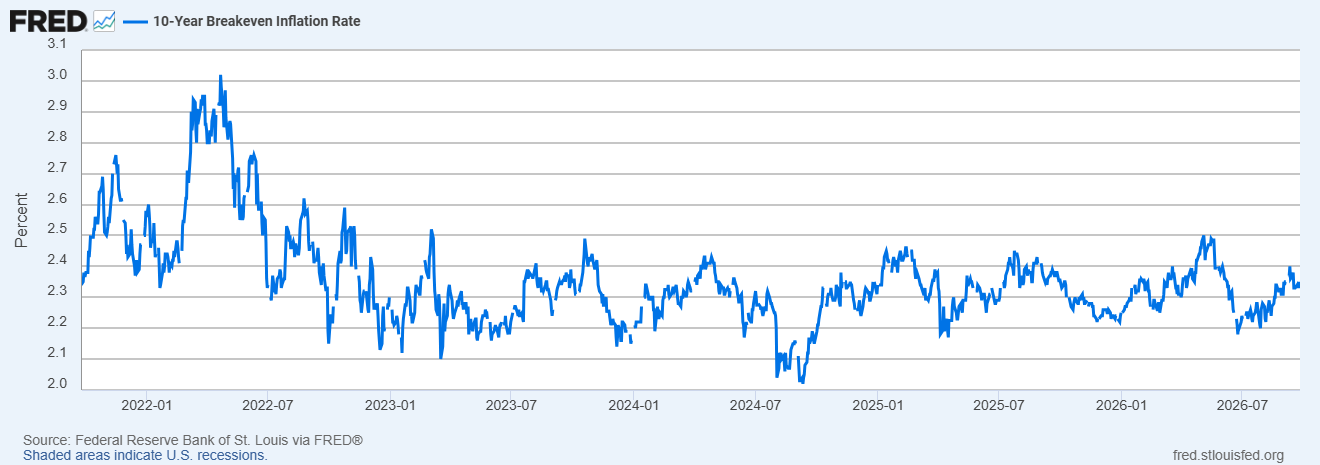
The real yields give clear view of that pressure. The 10-year real yield increased from 2.63% on Tuesday to 2.83% on Friday. But the 10-year breakeven inflation rate barely changed from 2.33% to 2.34% over the same period. This means that most of the rise in the nominal yield came from a higher inflation-adjusted return.
The bullish trend in real yields is observed by the formation of a bull flag pattern that stretched from the November 2021 lows. The consolidation period from October 2023 to March 2026 suggests a bullish price compression, which suggests a positive move towards the October 2018 highs at 3.14%.
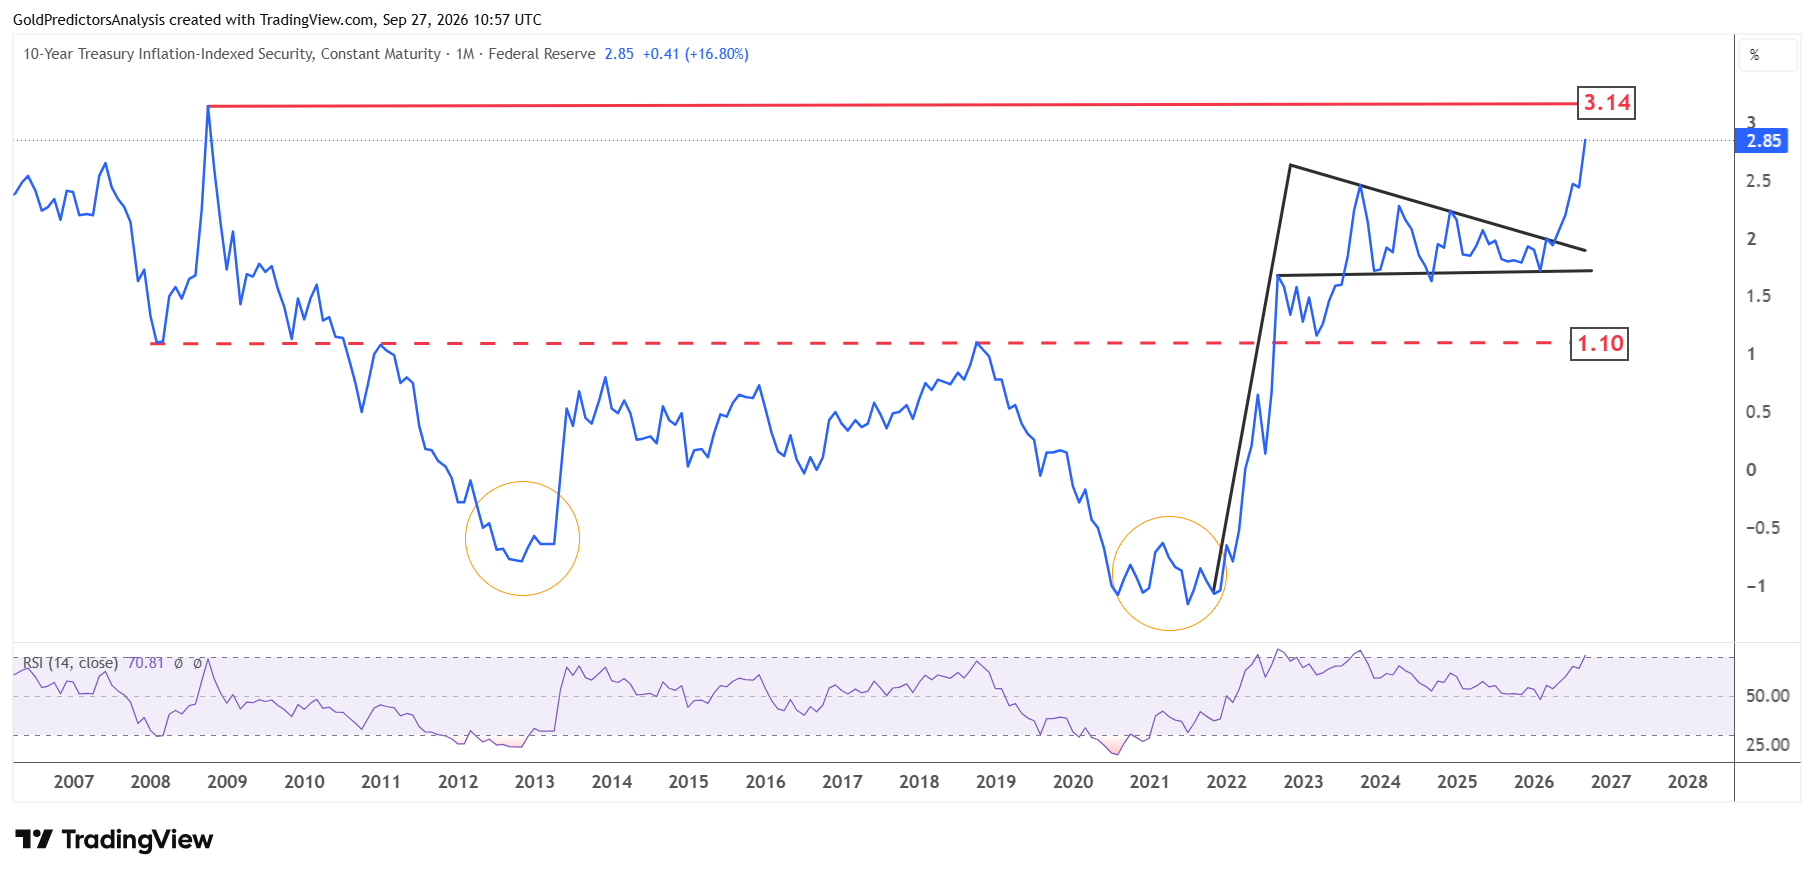
If the real yields continue to rally, the recovery in gold may remain difficult. Once the real yields find a top and begin to correct, the gold price may form a bottom to rally again.
US Dollar Index Faces 101.80 Resistance as Gold Awaits PCE
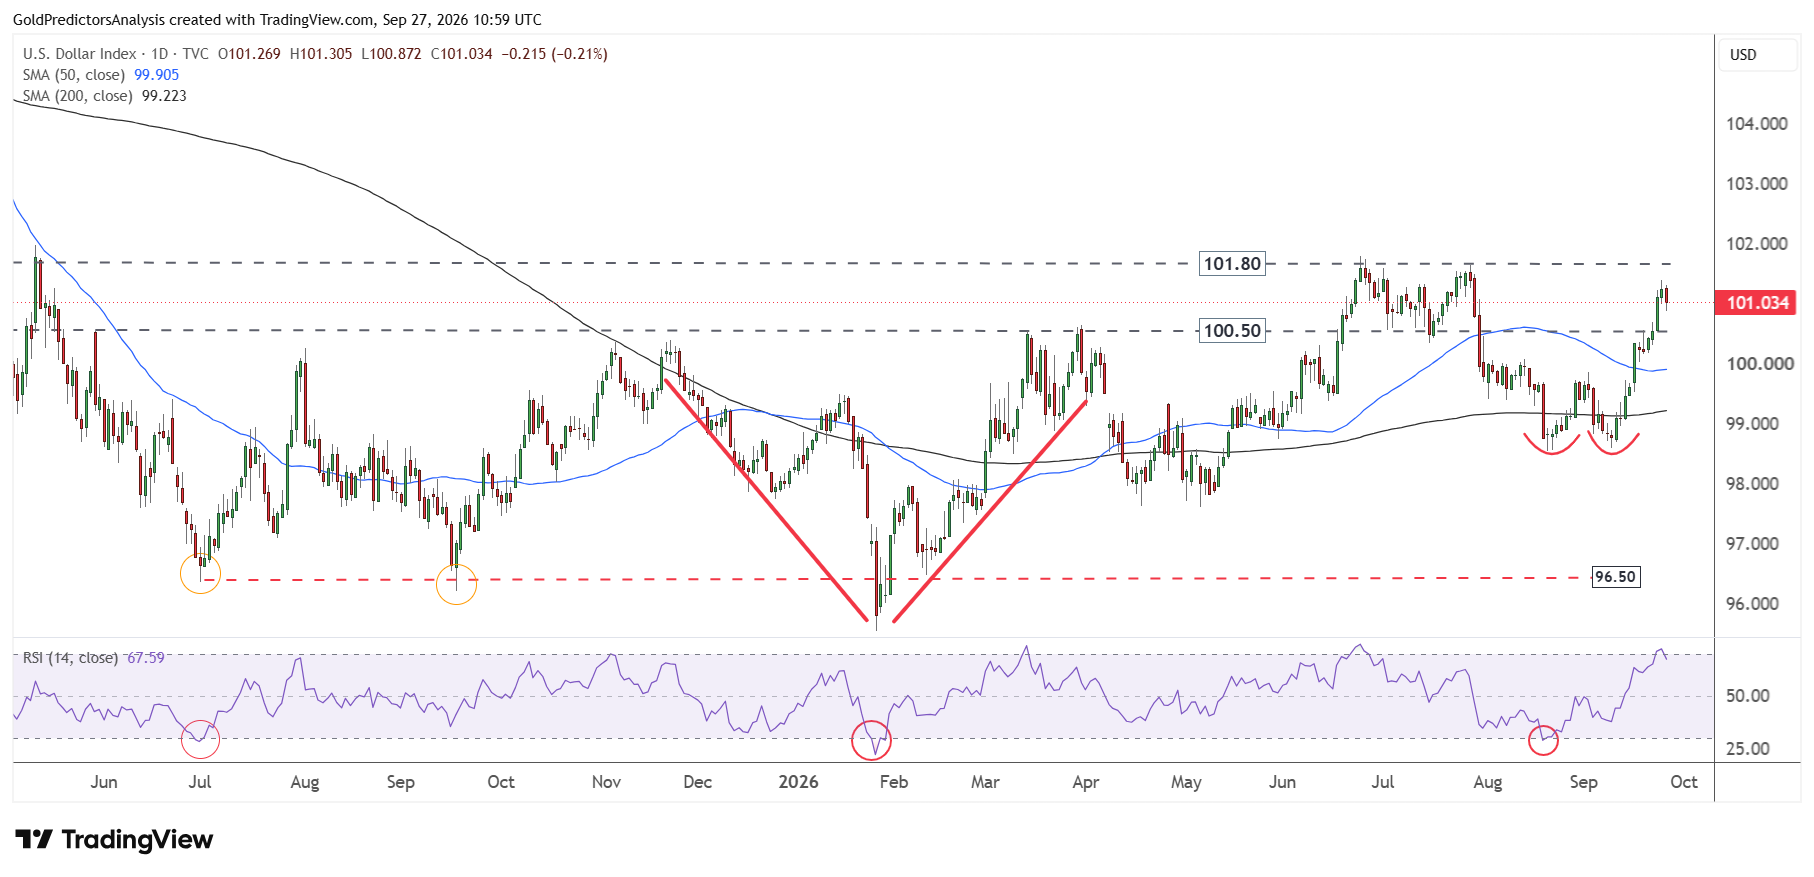
The US dollar index ended Friday around 101 but still gained 0.82% over the week. When the US dollar and real yields continue to rise together, they can put pressure on gold.
The daily chart for US dollar shows a recovery from the lows formed in late August and early September. This low has produced a double bottom pattern. The index has moved back above 100.50 and stands above the 50-day and 200-day moving averages.
The RSI is near 68, which supports the recent rally but also puts the rally close to the overbought reading. The next test for the US dollar is 101.80. A break above this level could increase the pressure on gold.
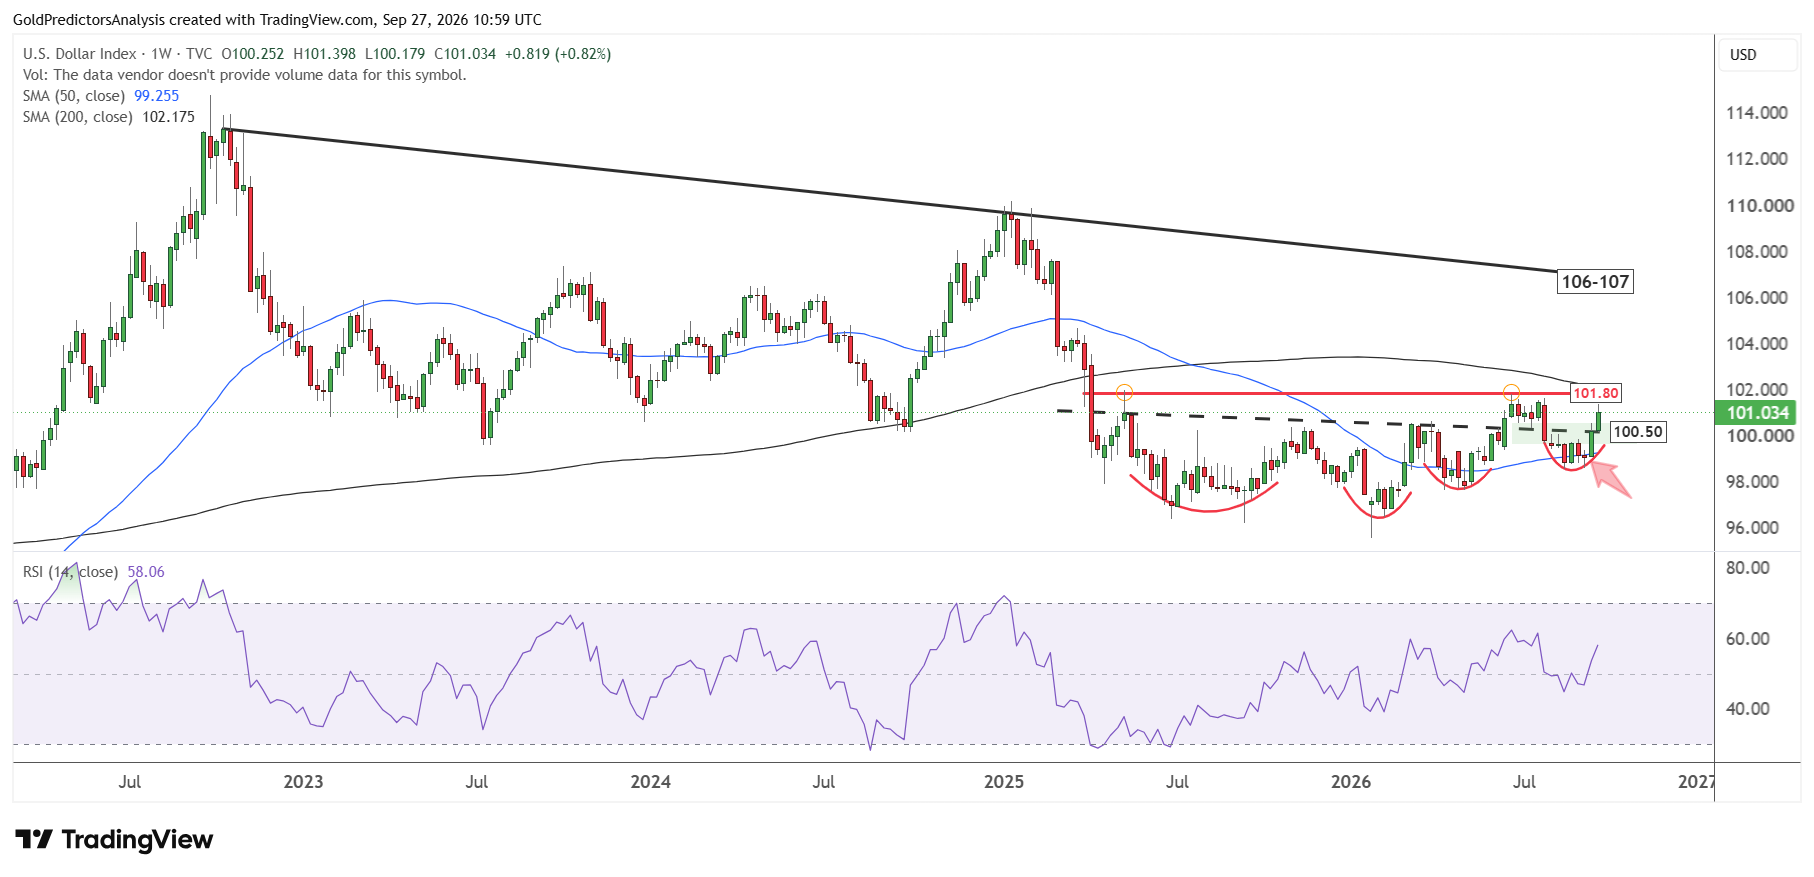
The weekly chart for US dollar index shows a broader recovery, but the index still faces resistance near the 200-week moving average around 102.20. A sustained move above 101.80 and then 102.20 would strengthen the case for further gains in the US dollar index.
The falling trendline near 106-107 in the long term remains farther away. If the index breaks below 100.50 in the short term, the latest breakout in the index would look less convincing and may support the outlook for gold.
The next catalyst is the PCE inflation report for August on Wednesday, September 30. A strong reading could keep expectations of another hike by the Fed alive and support real yields and the US dollar. But a softer reading could ease those pressures.
In my view, gold has better chance of sustaining a rebound if real yields stop rising and the US dollar fails to clear 101.80. The reaction in these two markets after the report will be important to understand the next move in the gold price.
Gold Price Technical Analysis: $4,180 Support Faces a Test
From a technical perspective, the gold price remains under pressure in the short term as it has closed below the 10- and 20-week moving averages. But the price remains within the ascending broadening wedge pattern, with strong support around $4,180.
However, the pressure in the gold market in September suggests that gold may break below this level. This break may open the way for further downside toward $4,000 if Treasury yields and the US dollar remain high. The RSI has closed below the midline, which suggests negative price action in the gold market in the short term.
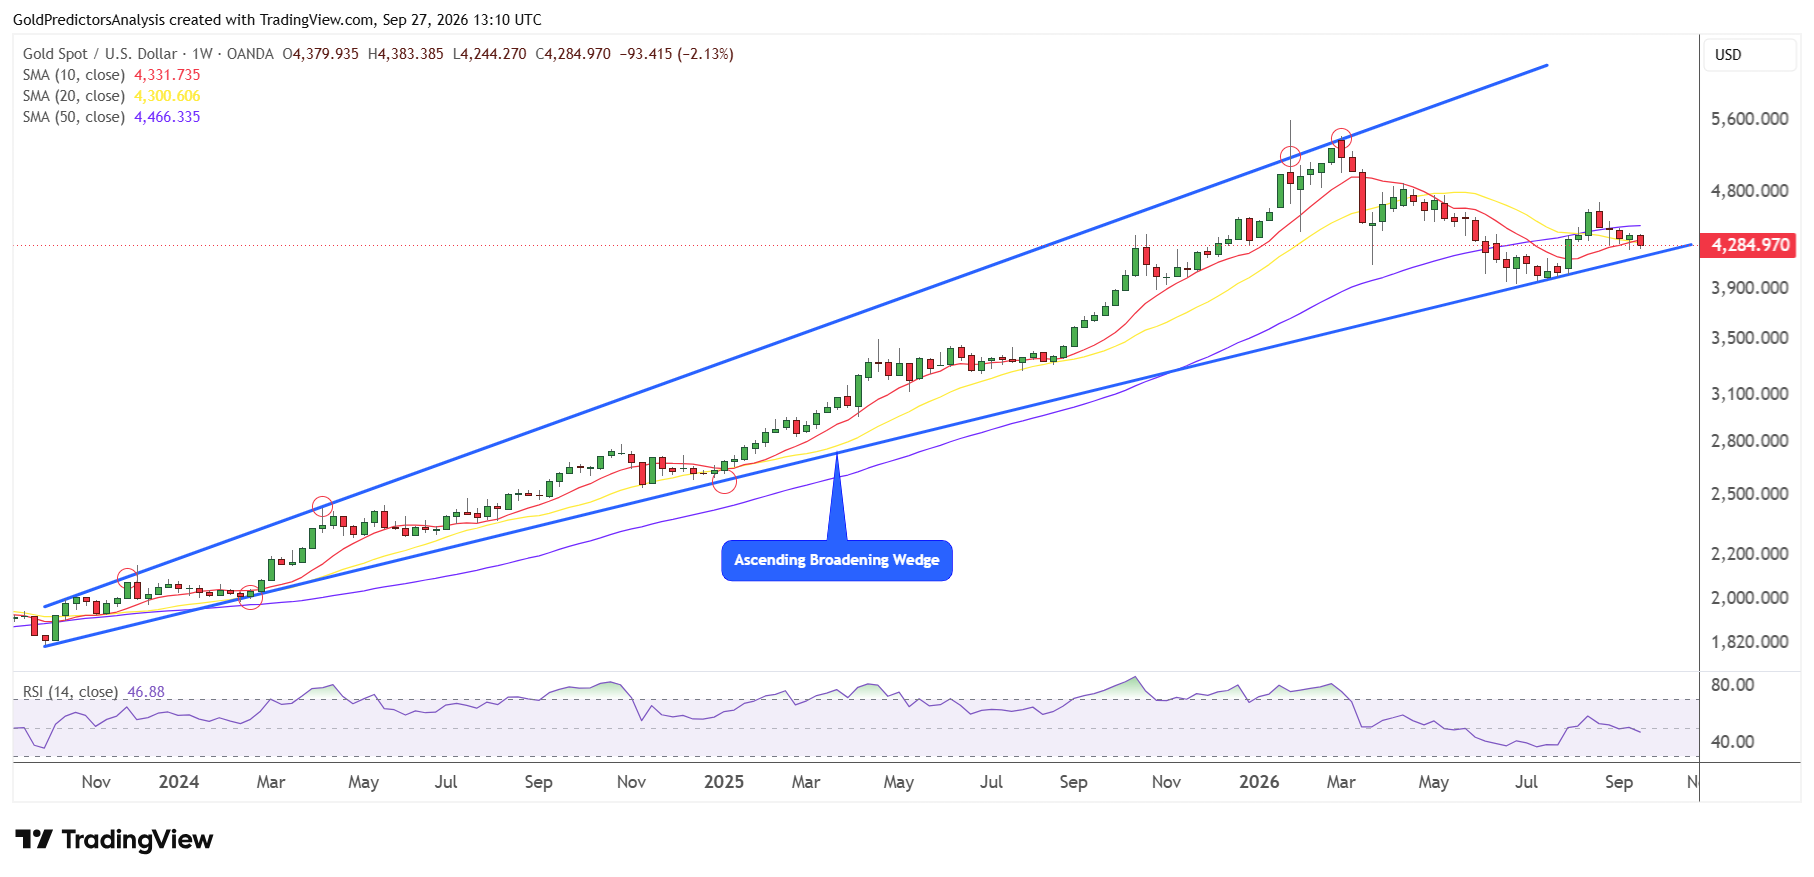
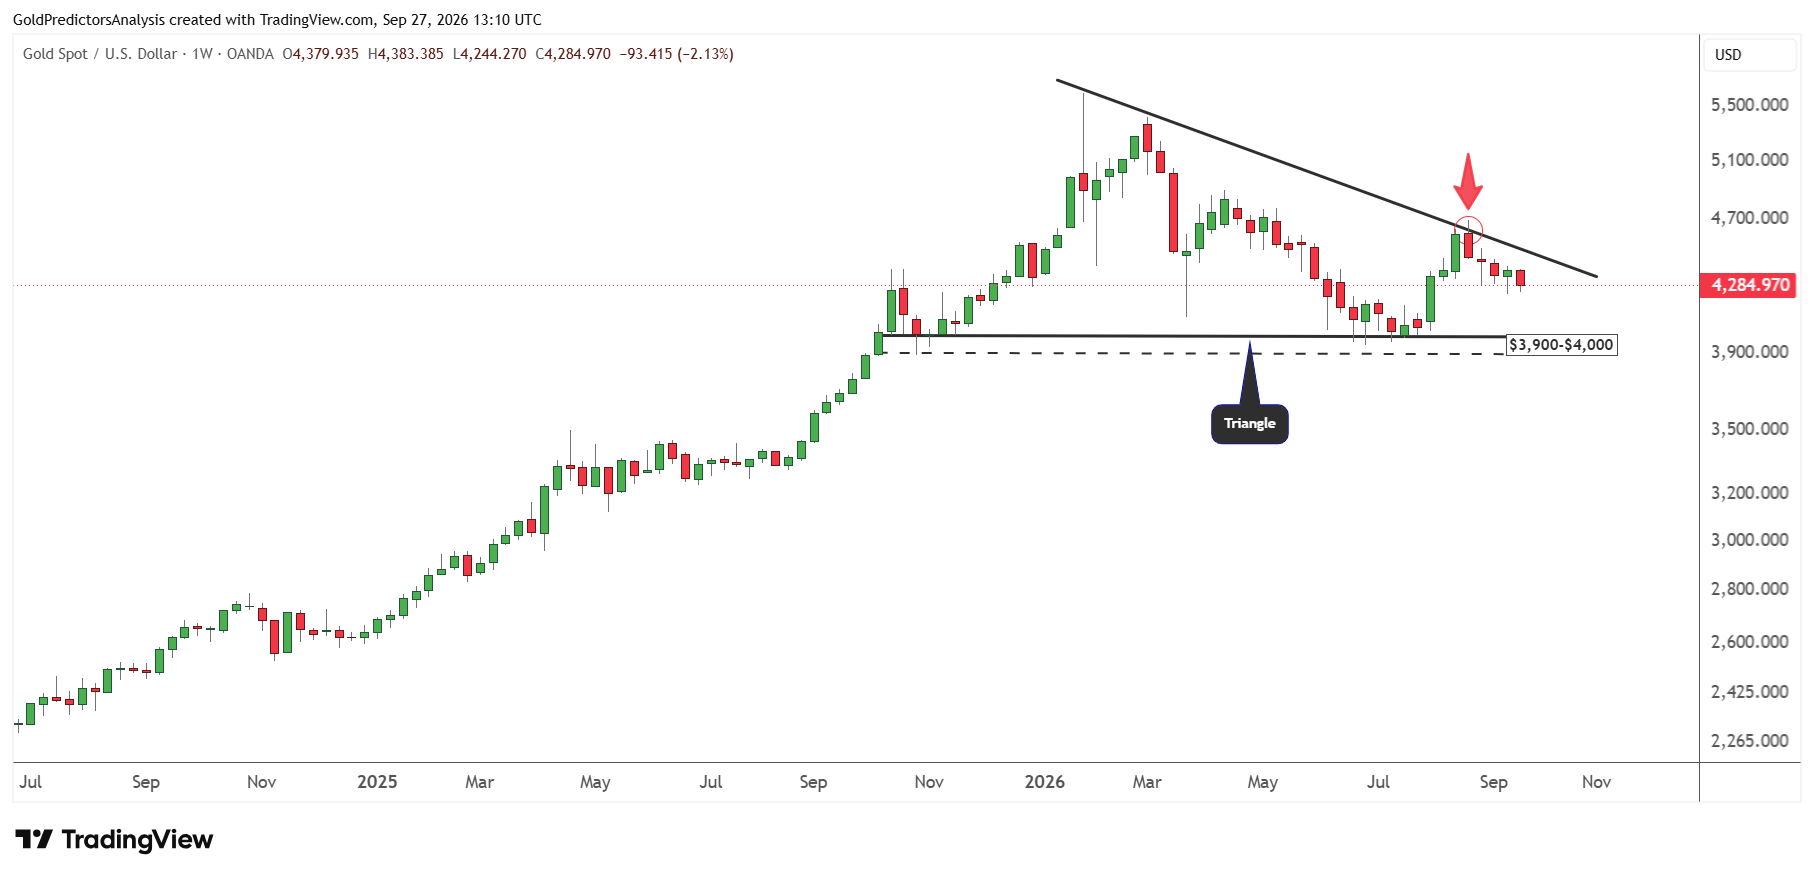
The negative price action in the gold market is also visible on another chart below. The chart shows that the price produced a bearish weekly hammer candle at triangle resistance in the last week of August.
After producing this bearish hammer candle, the price continued to trade lower under pressure. Last week’s candle suggests that the price may break below $4,180 to target the lower support of the triangle in the $3,900-$4,000 area.
Overall, the price has been consolidating near the apex of this triangle and is looking for the next direction. A break below $3,900 will likely push the price much lower toward $3,500. On the other hand, a break above $4,500 will likely open the way for strong rally toward the $5,000 region.
What to Watch Next for Gold
The PCE report on Wednesday is the next test for gold. If the Treasury yields continue to rally after the report and push the US dollar above 101.80, gold could retest the $4,180 level. A break below this support would bring the $3,900-$4,000 area into focus.
On the other hand, a softer report could ease real yields and weaken the US dollar. This scenario may provide a gold room to recover from the support zone. Spot gold needs to hold $4,180 and rally back above $4,500 to confirm a positive structure and push the prices to $5,000.
Read more: Strong Dollar and Yields Above 5% Test Support in Gold and Silver