



Gold (XAU) extended its recovery on Thursday as Middle East diplomacy reduced the energy related inflation fears. The spot gold price rose for a fourth straight session and reached a seven-week high near $4,304. The weakness in the US dollar also supported the metal. But the latest US data presented a mixed economic picture. The JOLTS job openings, factory orders and ADP employment pointed to softer demand. At the same time, the ISM services and manufacturing data showed strong activity and persistent price pressure. These conflicting signals make the US payrolls data important for the next move in gold. This article discusses the latest developments in the Middle East, US economic data and technical levels that may shape the next move in gold.
Gold Price Hits Seven-Week High as Hormuz Talks Ease Inflation Fears
Spot gold increased to $4,304 per ounce on Thursday as investors evaluate the possibility of an agreement to reopen the Strait of Hormuz. The weaker U.S. dollar also supported the rebound in gold.
Iran and Oman are reportedly negotiating a deal that will help in efforts to resolve the current conflict between Iran and the U.S. It might also help to reopen more normal shipping in the Strait of Hormuz. This is important as lower oil prices could ease inflation pressures. It could also help to slow the pace of central banking interest rate hikes. The odds of a September rate hike have dropped from 65% to 55%. The expectations of lower interest rates support the gold rally.
The market response may appear unusual as a relief in geopolitical tensions can decrease demand for safe havens. But the recent conflict had driven up oil and inflation expectations, which had increased the hopes of rate hikes and pushed the gold price below $4,000. This means that the decline in the energy risk has a more positive influence on the gold price.
Weak US Labor and Factory Data Support Gold Price
The recent US data releases painted a less strong scenario than the strong ISM Manufacturing report discussed earlier. The US job openings fell by 178,000 to 7.359 million in June. This was just below the market estimate of 7.40 million. There were no changes in hiring at 5.3 million.
Gold Price Forecast
Every new Gold analysis as it publishes, today's technical signal and key levels, live price — on one page.
See all Gold forecasts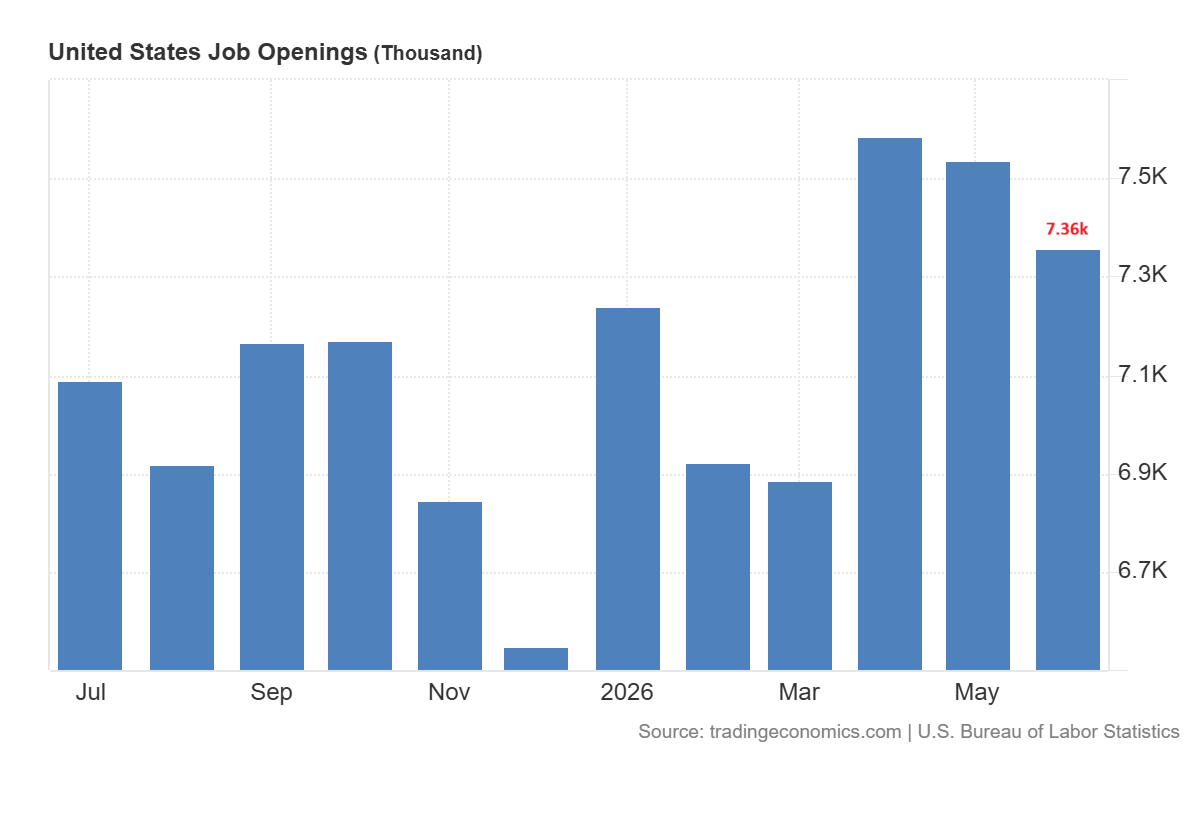
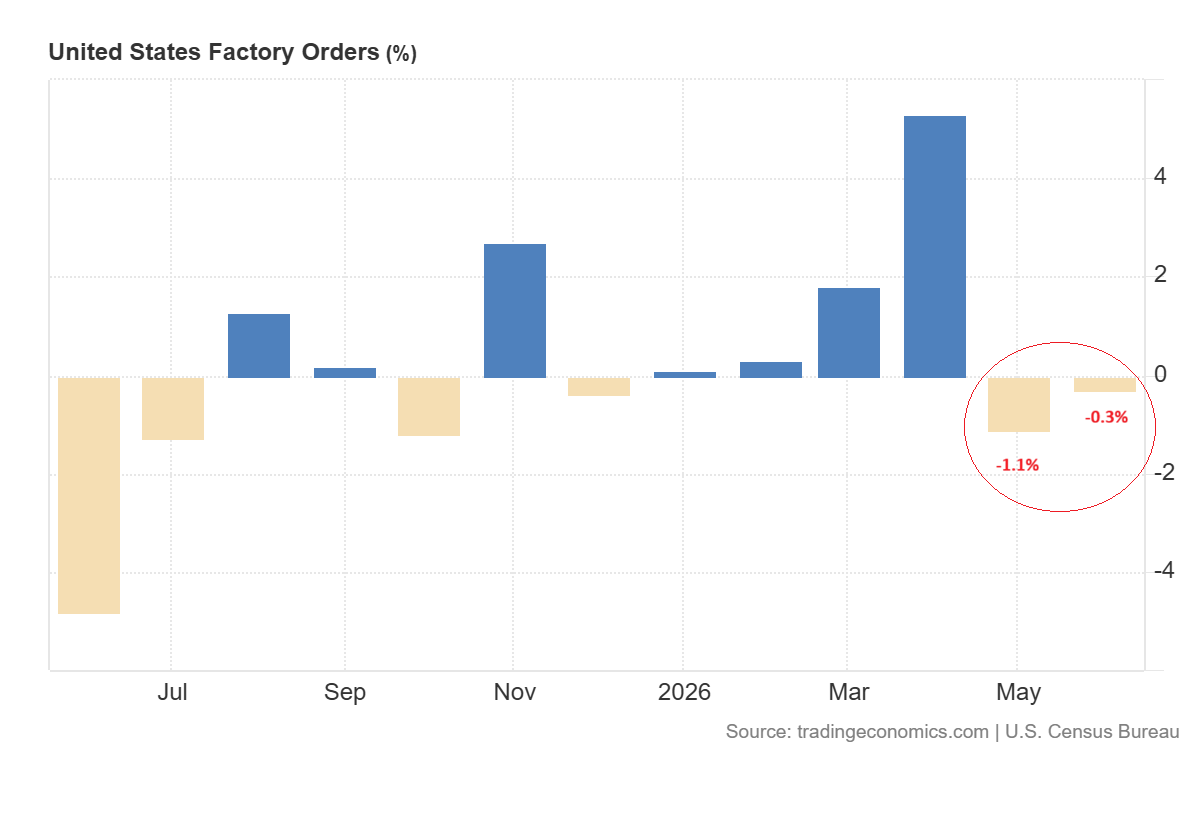
In addition, factory orders dropped 0.3% in June following a revised 1.1% drop in the previous month. These numbers indicate demand is cooling and take some pressure off the Fed for an interest rate increase. But a 1.2% rise in core capital goods orders indicated that business investment remained strong.
The ADP report was a better indication of a slowdown in hiring. In July, private businesses increased employment by just 44,000. This was the smallest gain since December. It was also lower than the forecast of 70,000 and the revised gain of 95,000 for June. This slowdown may be able to add more pressure to the US dollar and may provide support to gold.
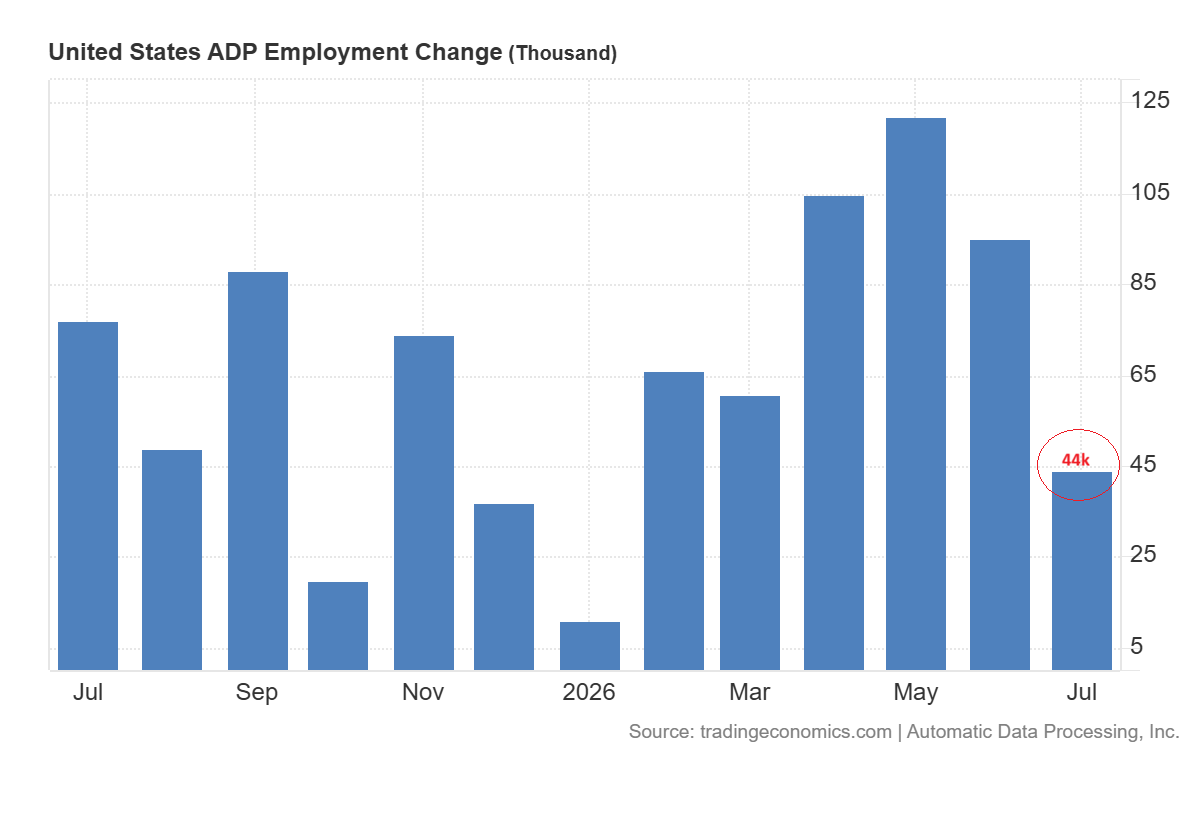
But salary increments for workers were unchanged at 4.4% a year. The pay growth of those changing jobs also picked up to 7%. This data indicates the lower employment without eliminating the possibility of wage related inflation.
ISM Services Inflation Keeps Gold Focused on Nonfarm Payrolls
The ISM Services PMI increased slightly to 54.1 in July from 54.0 in June. It was below the market forecast of 54.5 but still exhibited growth. Business activity went up to 59.1 and new orders expanded to 57.2. But the employment index dropped to 47.4 which supported the weaker signal from the ADP.
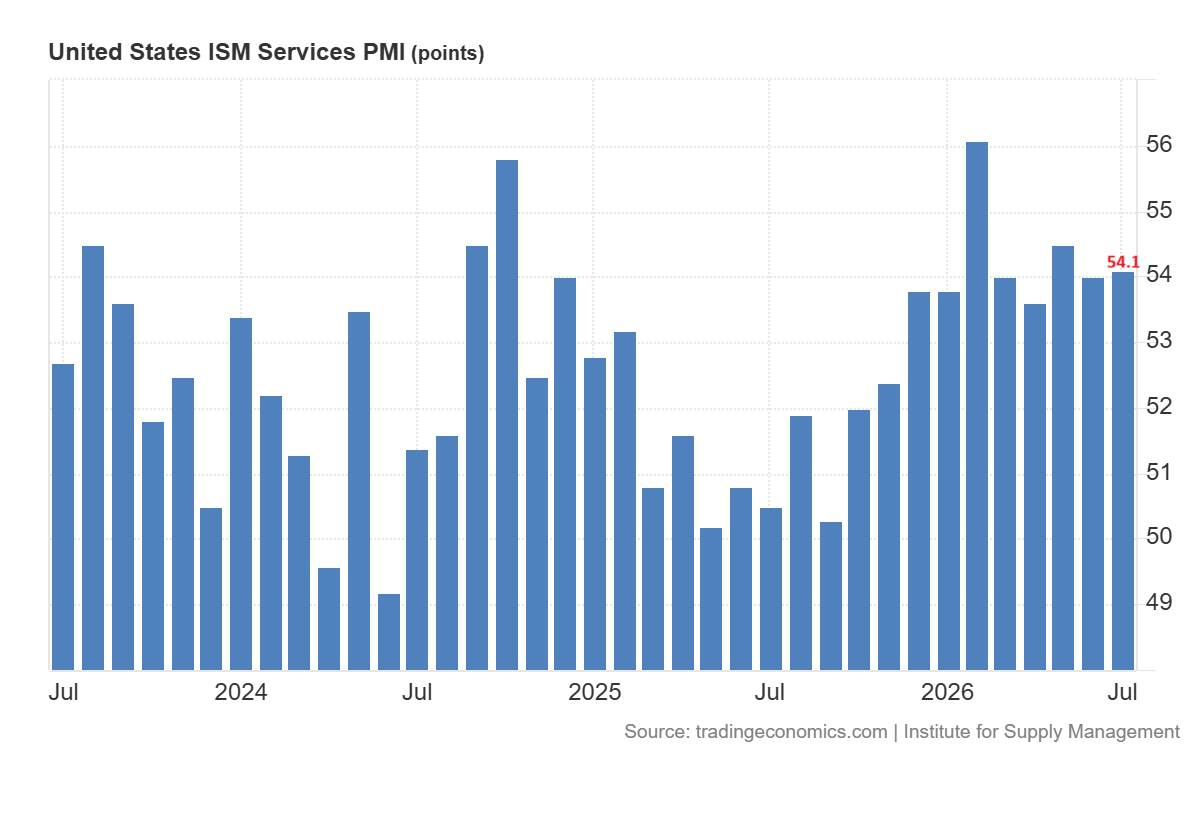
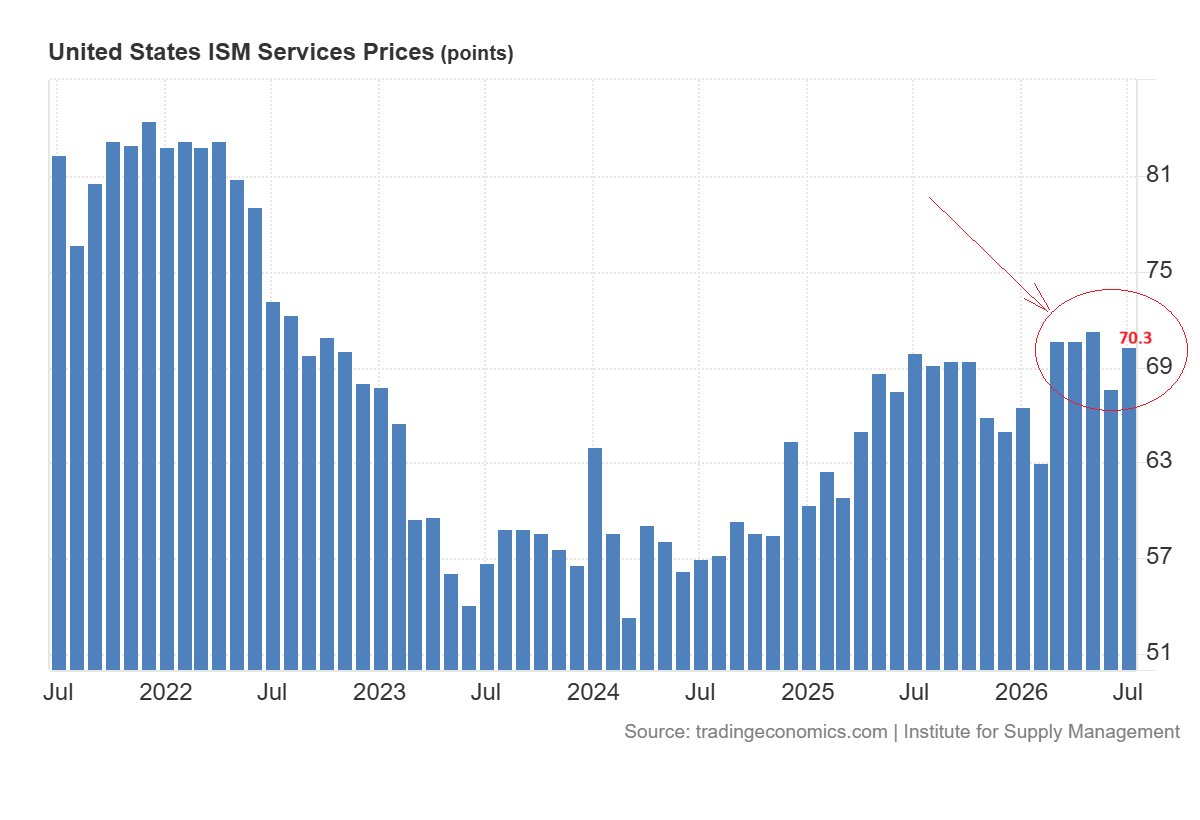
The prices index also jumped to 70.3 from 67.7. The chart below shows that the prices show pressure after the US-Iran conflict and continue to increase. This strong price pressure could be the reason why rate expectations are not dropping as quickly.
The market is now waiting for the US nonfarm payrolls data on Friday. A better report would be positive for the US dollar and could put pressure on gold in the short term.
Gold Long-Term Forecast: $3,900 Support Keeps Bullish Outlook Intact
From a technical perspective, spot gold prices have been trading in a strong bull trend since the 1976 low. This long term trend has been defined by an ascending channel pattern. However, the price broke above this ascending channel pattern in August 2025. This breakout pushed prices to a record high of $5,600. However, prices failed to sustain the rally above $5,000 and moved back toward the breakout level of the ascending channel, which currently lies around the $3,900-$4,000 area.
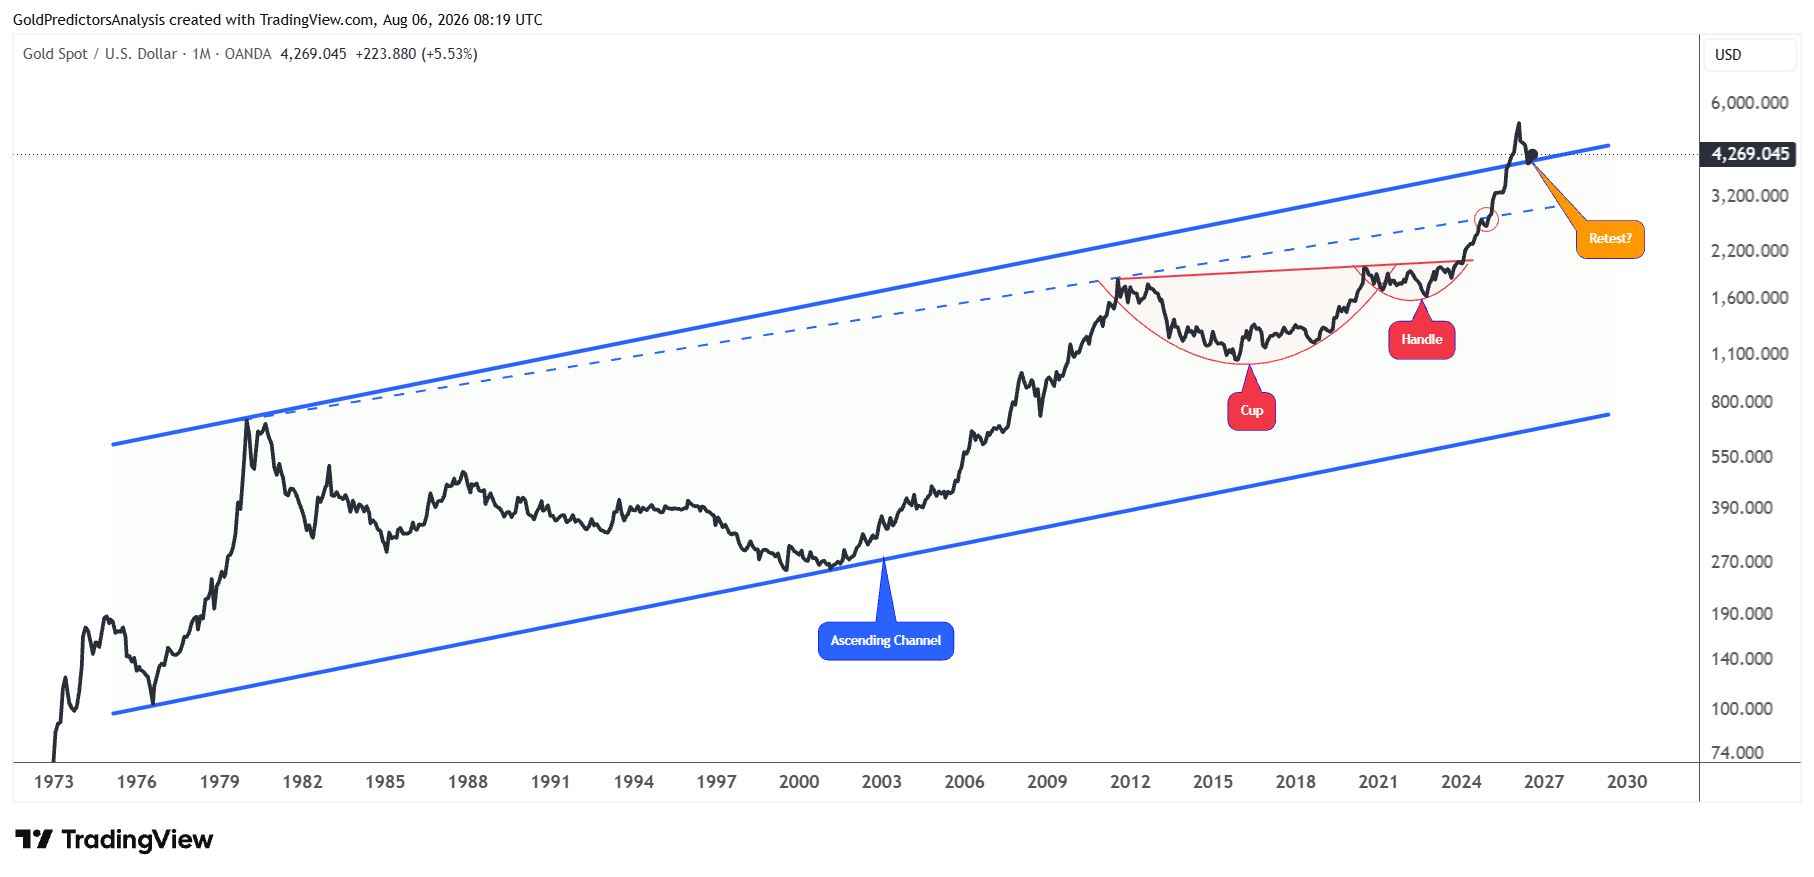
After consolidating for the past month, spot gold prices rebounded and broke the $4,250 resistance level. But a weekly close above the key levels is required to confirm the breakout. The US nonfarm payrolls data may further confirm the current momentum in gold.
If the gold price maintains the $3,900 area and breaks the $5,000 resistance, it will likely continue to advance and reach new record highs towards $6,000. This is due to the parabolic momentum seen during the 21st century. But if the gold price breaks below $3,900, it will reenter the ascending channel pattern and push prices back toward the red and blue dotted trend line around the $3,000-$3,500 region.
The formation of cup and handle pattern from 2011 to 2024 further supports the bullish momentum. But the recent correction of 2026 is part of the broader trend. As long as the $3,000 level holds, the next move in gold will be toward the $8,000 zone in the long term.
Gold Price Technical Analysis: $3,950 Support and $4,330 Breakout in Focus
The importance of the current support is observed on the weekly chart. The weekly chart shows the formation of the ascending broadening wedge pattern. This wedge extends from October 2023 lows. The price rebounded from the $3,950 support of this wedge and closed near $4,250 on Wednesday. But the market is now waiting for the US nonfarm payrolls data. The next move in gold will be decided by this US data.
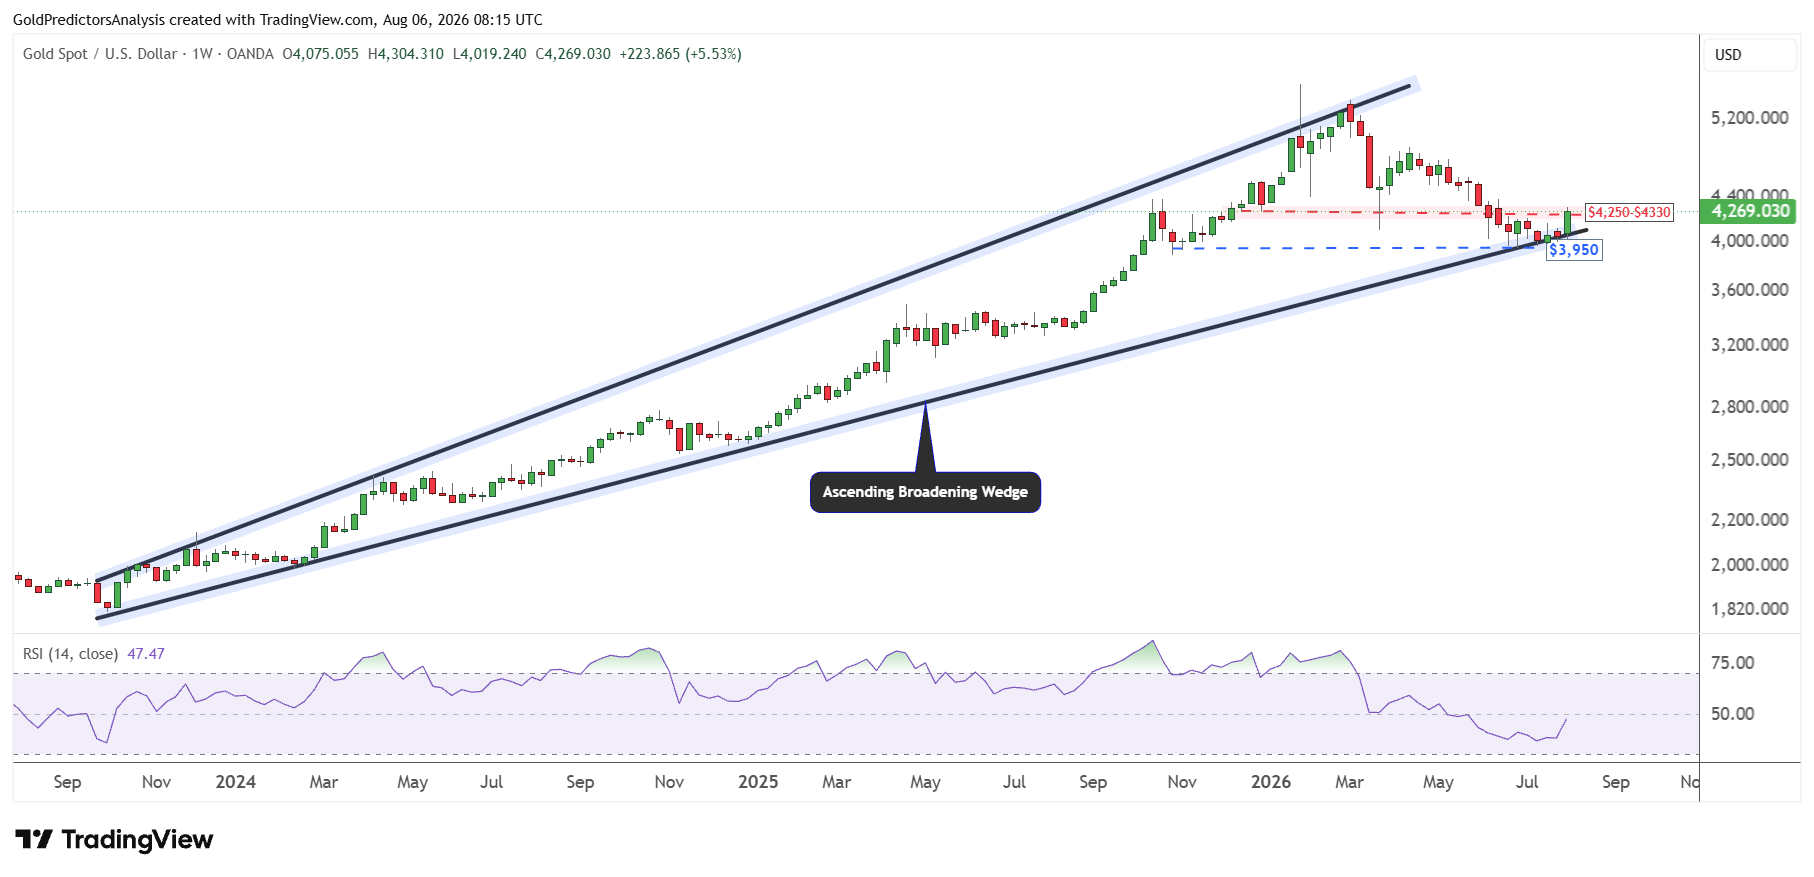
For the gold price to continue its upside momentum and remain bullish, prices must close the weekly candle above $4,330 to open the door for a strong surge during the next week to $5,000. But if prices fail to break above the $4,140-$4,150 level on a weekly basis, it will keep the gold price under pressure due to the uncertainty from the higher US Treasury yields trend.
The current resistance of $4,250-$4,270 is also observed using the 200-day SMA which needs to be broken before the next advance. Therefore, the nonfarm payrolls data is critical this week in determining whether the price will continue higher or open the door for another drop over the next few weeks. However, based on the current structure, if the gold price breaks above $4,330 on a weekly basis, it will increase the possibility of strong surge.
What is Next in Gold?
Gold remains supported by a weaker US dollar, lower oil prices and softer employment data. The possible reopening of the Strait of Hormuz may ease the energy related inflation fears. But the strong services activity and higher input prices may keep the Fed cautious. The next major signal for gold is the nonfarm payrolls data that may provide further evidence. The weak job growth may extend the gold rally. But a stronger report could support the dollar and put short term pressure on gold.
The technical outlook for gold remains bullish as long as the price maintains the $3,900-$4,000 support area. A weekly close above $4,330 would confirm the breakout and increase the possibility of stronger advance to $5,000. But a failure to hold the $4,140-$4,150 area could trigger another correction to $3,900-$4,000. The long term structure continues to support higher prices while the major support levels remain intact.
Read more: Can XAUUSD Break $4,200 as Silver Eyes $64?