



Gold (XAU) remains supported as investors respond to the economic slowdown in China and rising stress in the bond market of Japan. The PBoC and Chinese gold ETFs continue to increase their holdings even as high prices weaken jewellery demand. The surge in Japanese bond yields and the increase in government debt increase concerns about currencies and traditional safe assets. This article presents the key demand drivers, risks and technical levels that may shape the next move in the gold price.
China Economic Slowdown Increases Pressure for More Stimulus
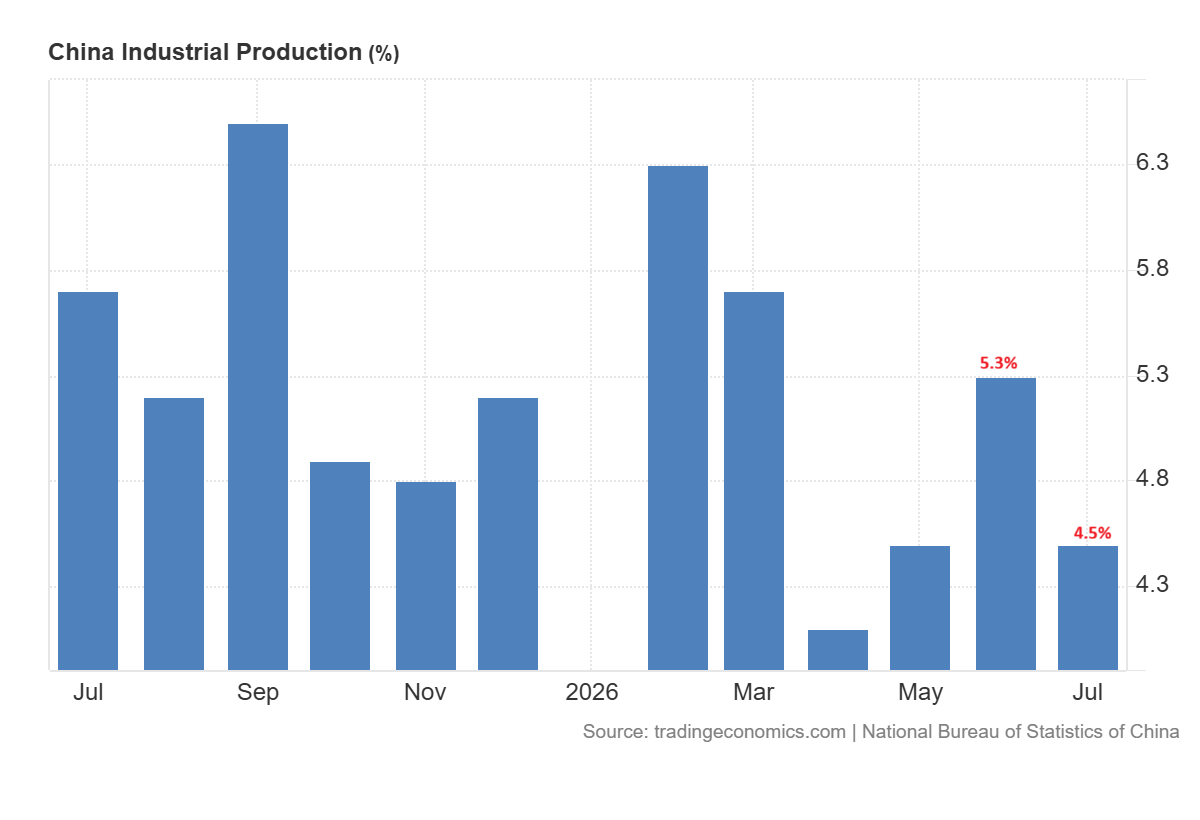
The Chinese economy slowed down in July. The industrial production increased by 4.5% year over year in July. This is down from 5.3% in June.
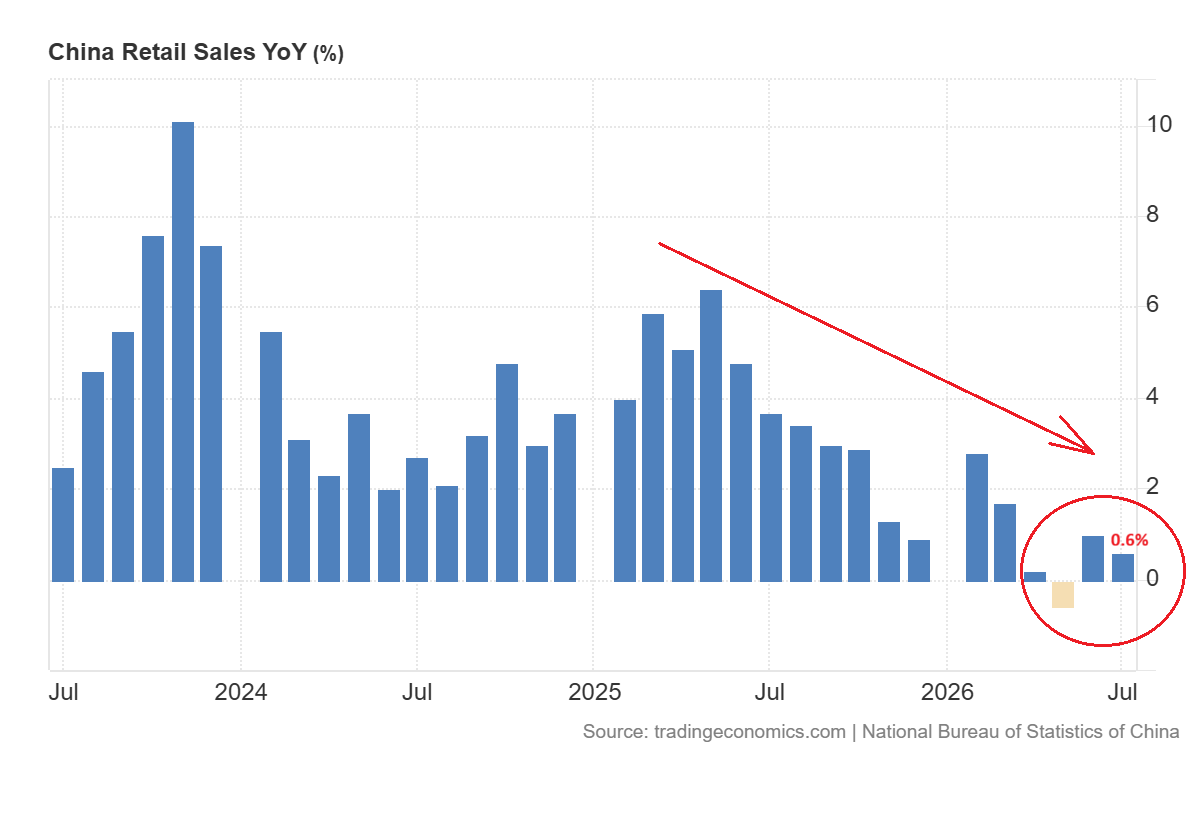
The retail sales rose by 0.6% as seen in the chart below.
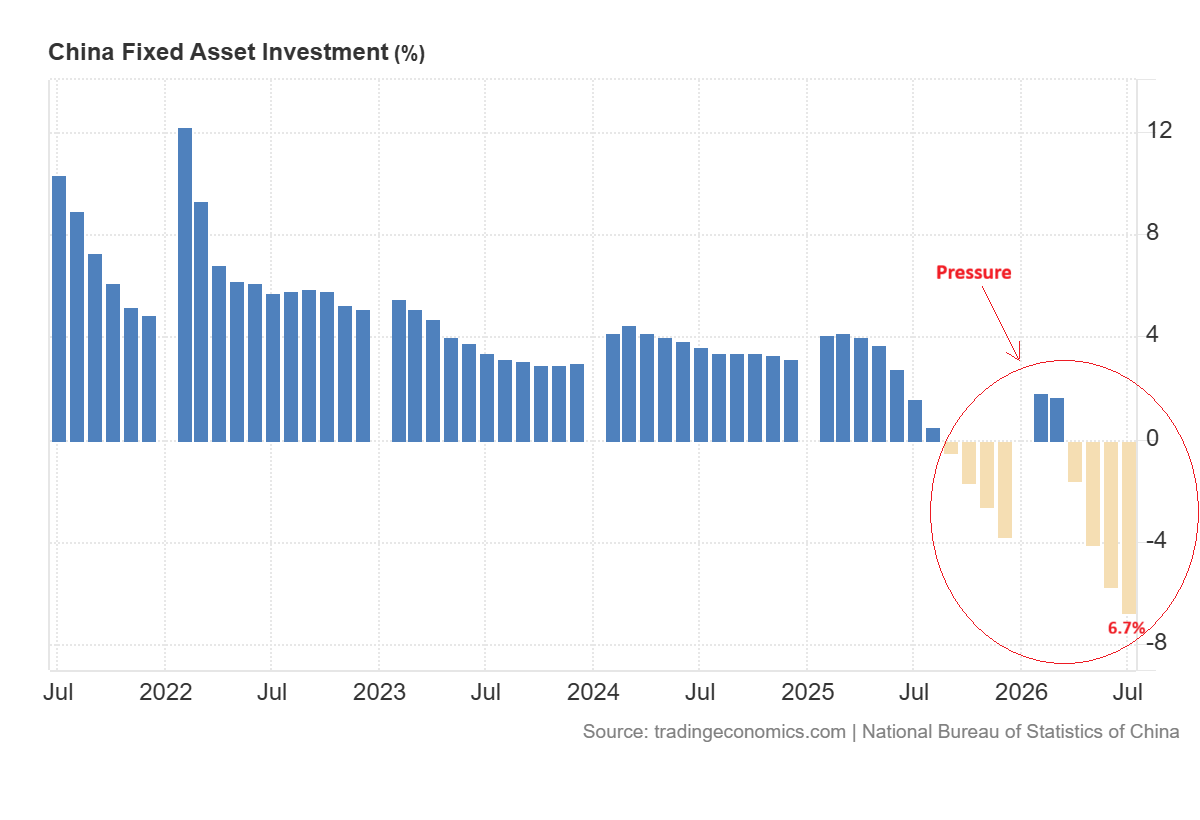
As of the end of the first seven months of 2026, investment in fixed assets decreased by 6.7%. The value of property investment decreased by 19.2%. The weak domestic demand and the property slowdown remain headwinds to growth in China.
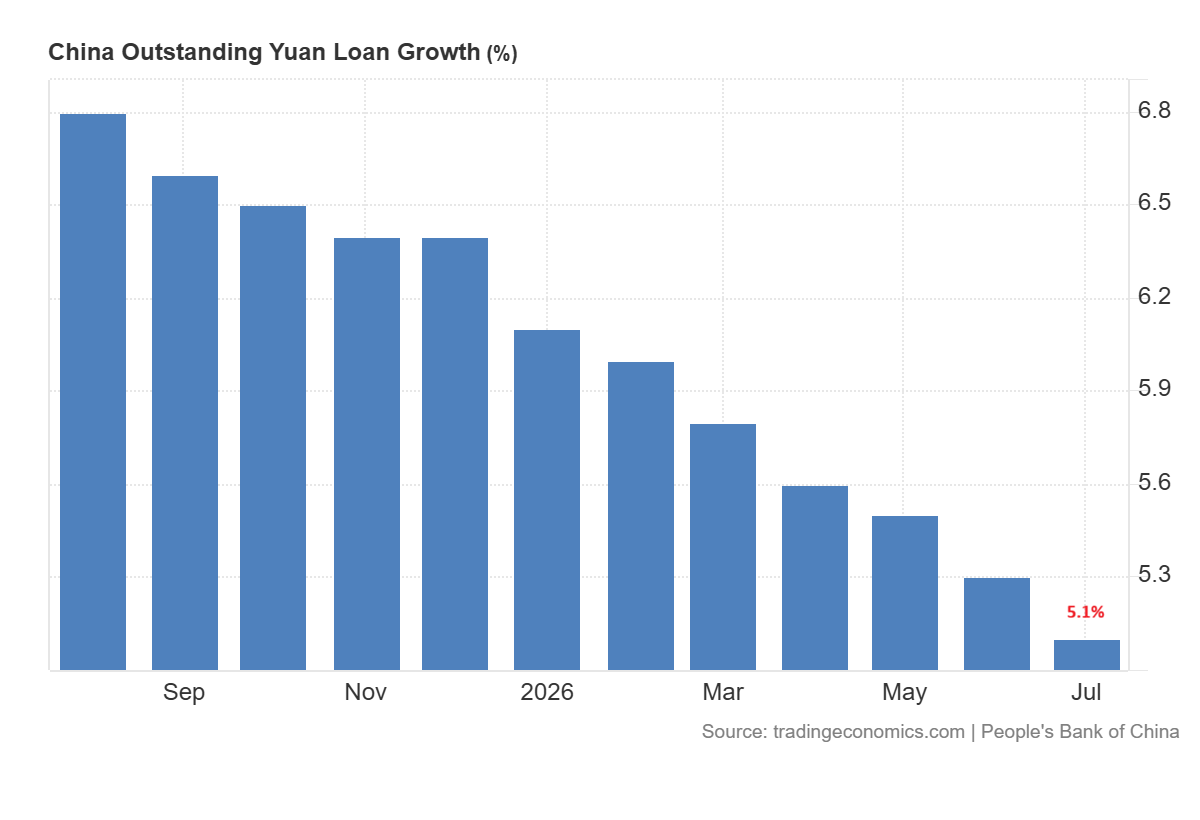
This slowdown in growth puts more pressure on Beijing to give more fiscal and monetary support. But demand for credit continues to be weak. In July, the increase in outstanding yuan loans was the smallest on record at 5.1%.
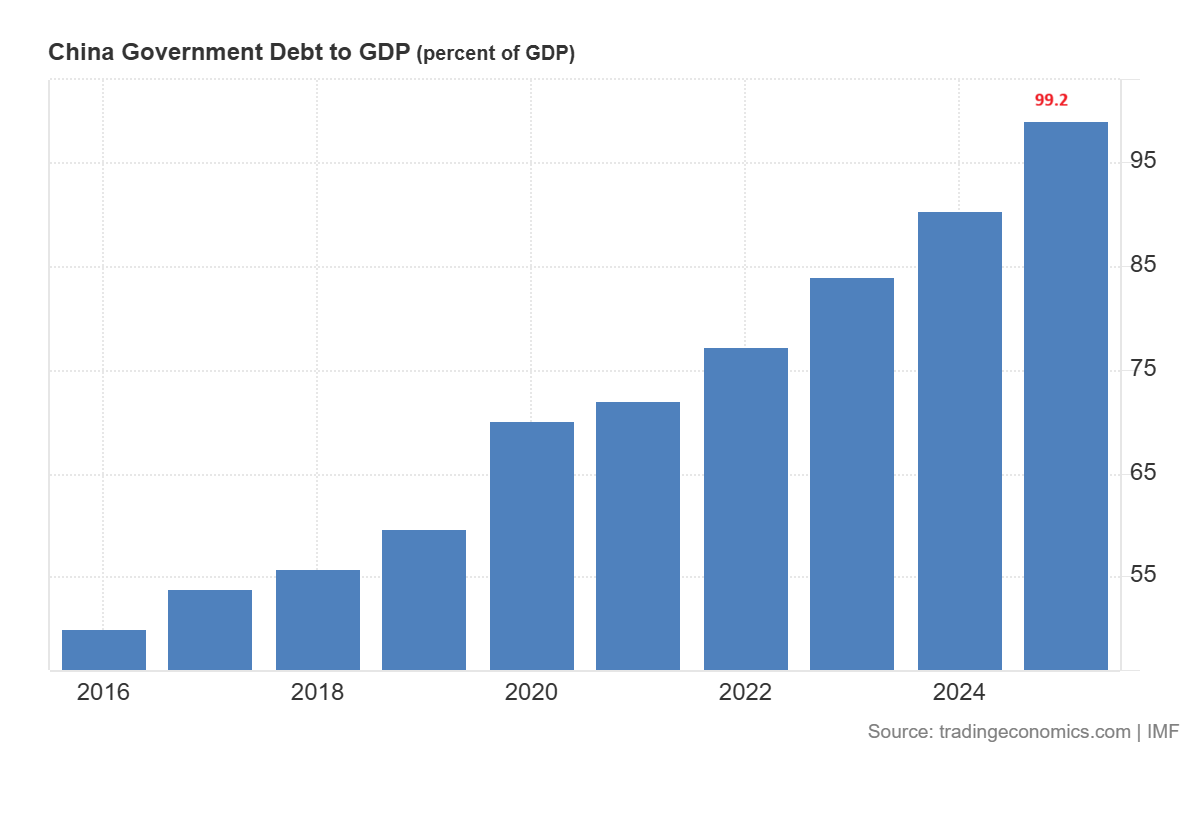
The growth of money supply (M2) rose by 7.7%, whereas the increase in the aggregate financing was 7.4%. This indicates that liquidity is still there, but the households and businesses are still not keen on taking out a loan. The debt in China was also estimated at 99.2% of GDP in 2025 as seen in the chart below. The higher stimulus can support growth, but may also increase long term issues of debt and currency.
Gold Price Forecast
Every new Gold analysis as it publishes, today's technical signal and key levels, live price — on one page.
See all Gold forecastsChina Gold Buying and ETF Inflows Support Gold Prices
The direct support of gold is much more apparent in China. In July, the People’s Bank of China bought 20 tonnes of gold. This increased its official holdings to 2,366 tonnes (8% of its foreign exchange reserves).
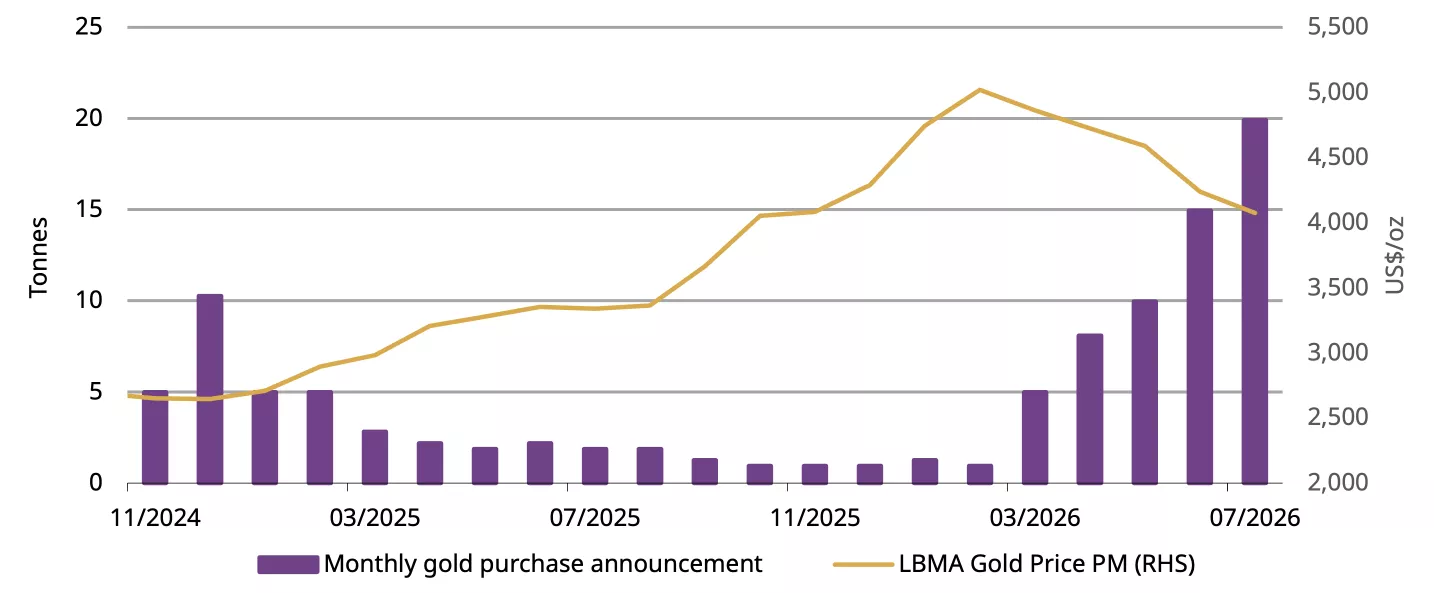
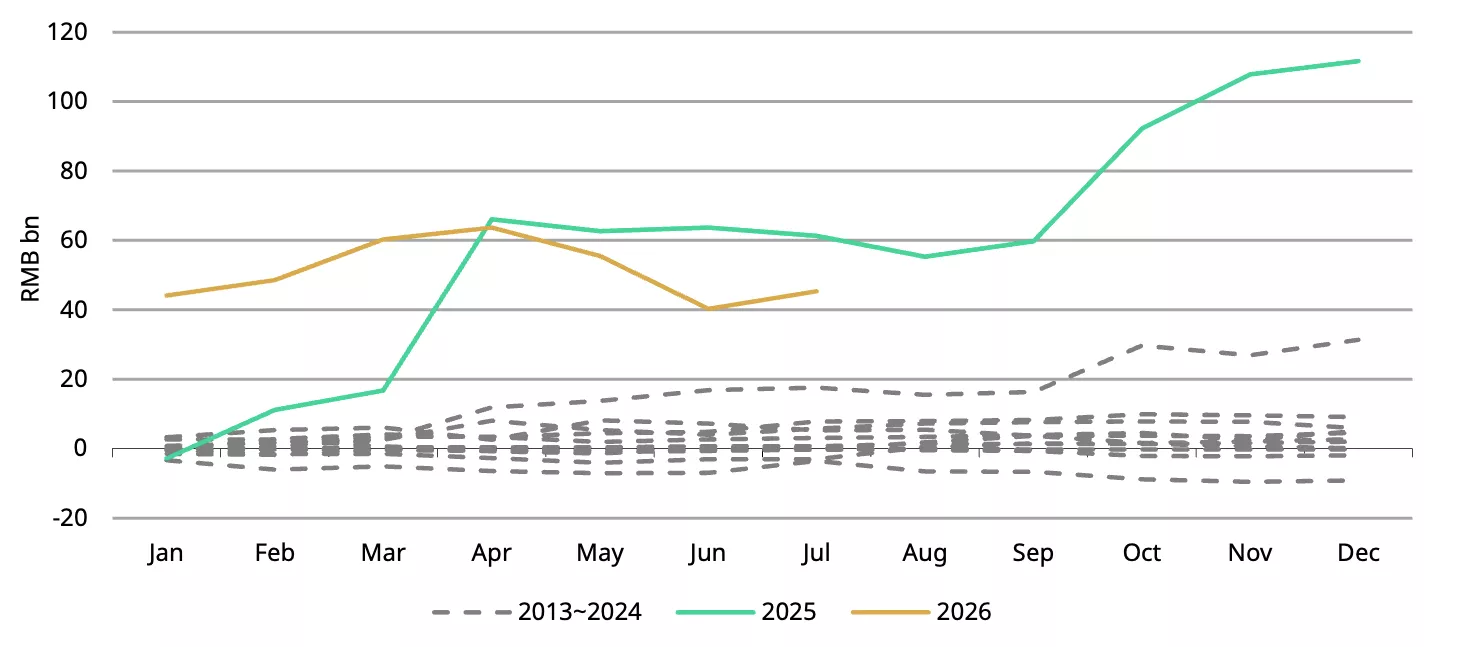
This brought the length of China’s buying spree to its 21st month, the longest on record. The Chinese gold ETFs also gained RMB5 billion in investments in July. These flows indicate that the official and institutional investors continue to boost their gold exposure.
But the gold demand is not robust everywhere in China. The demand for wholesale decreased 8% in July to 80 tonnes. This was also 15% less than it was a year ago.
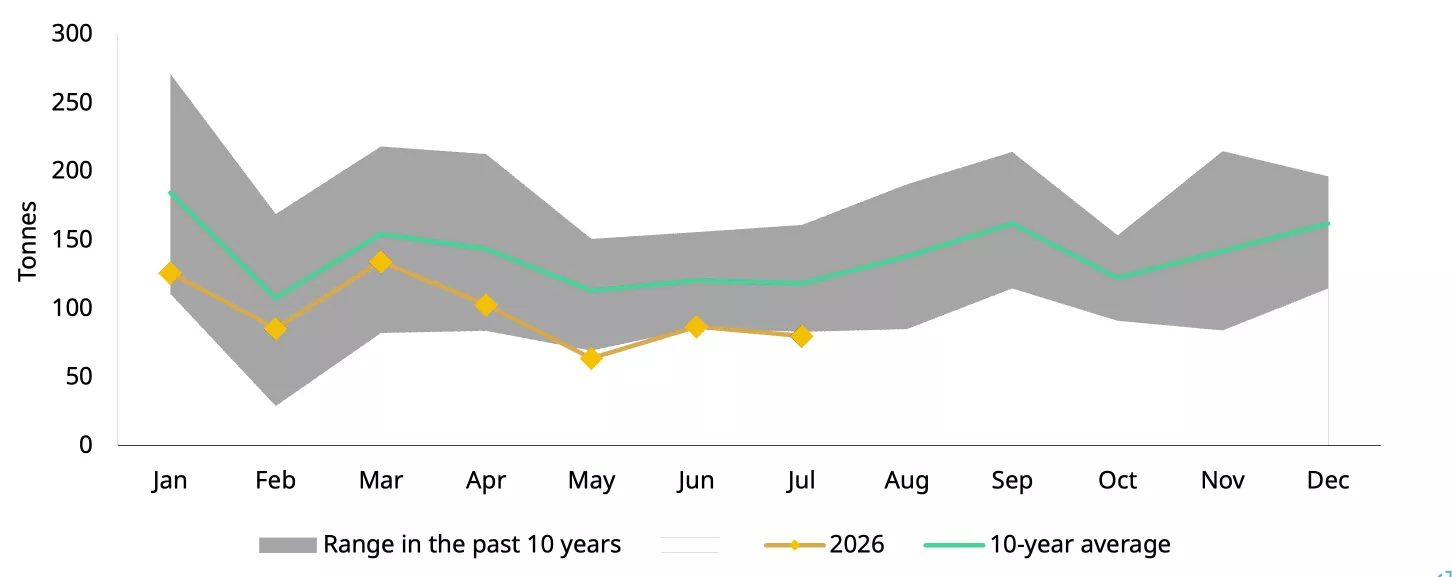
Jewelry demand was down due to a strong gold price and low consumer confidence. The chart below shows that the consumer confidence remains below 100.
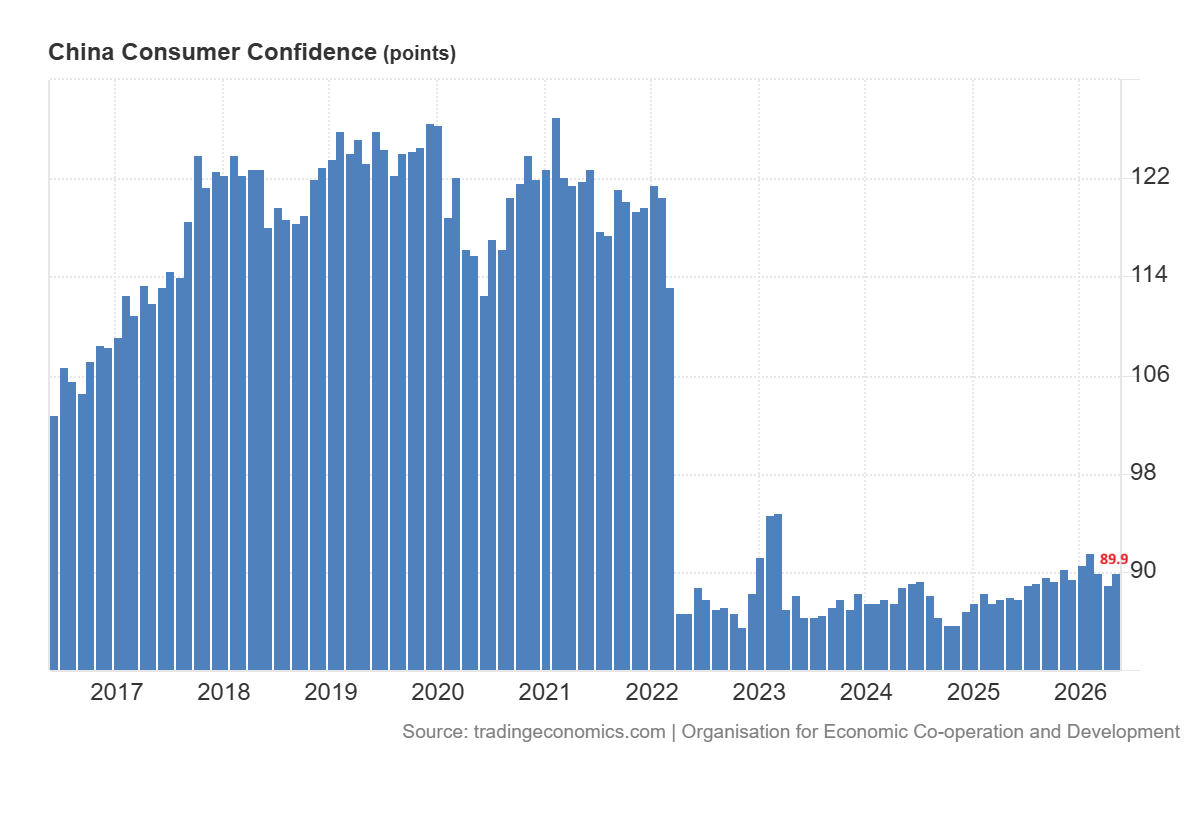
This means that the primary source of support for gold comes from the Chinese central bank and investors.
Japan Bond Yields Raise Debt Risks and Support Gold Demand
The bond market of Japan is showing greater signs of stress. The 10-year Japanese government bond yield increased to 2.945% on Tuesday. This was the highest since September 1996. The 30-year yield also moved up to 4.115%. Investors are seeking larger yields due to their ongoing fears of inflation, fiscal policy and additional rate hike by the Bank of Japan.
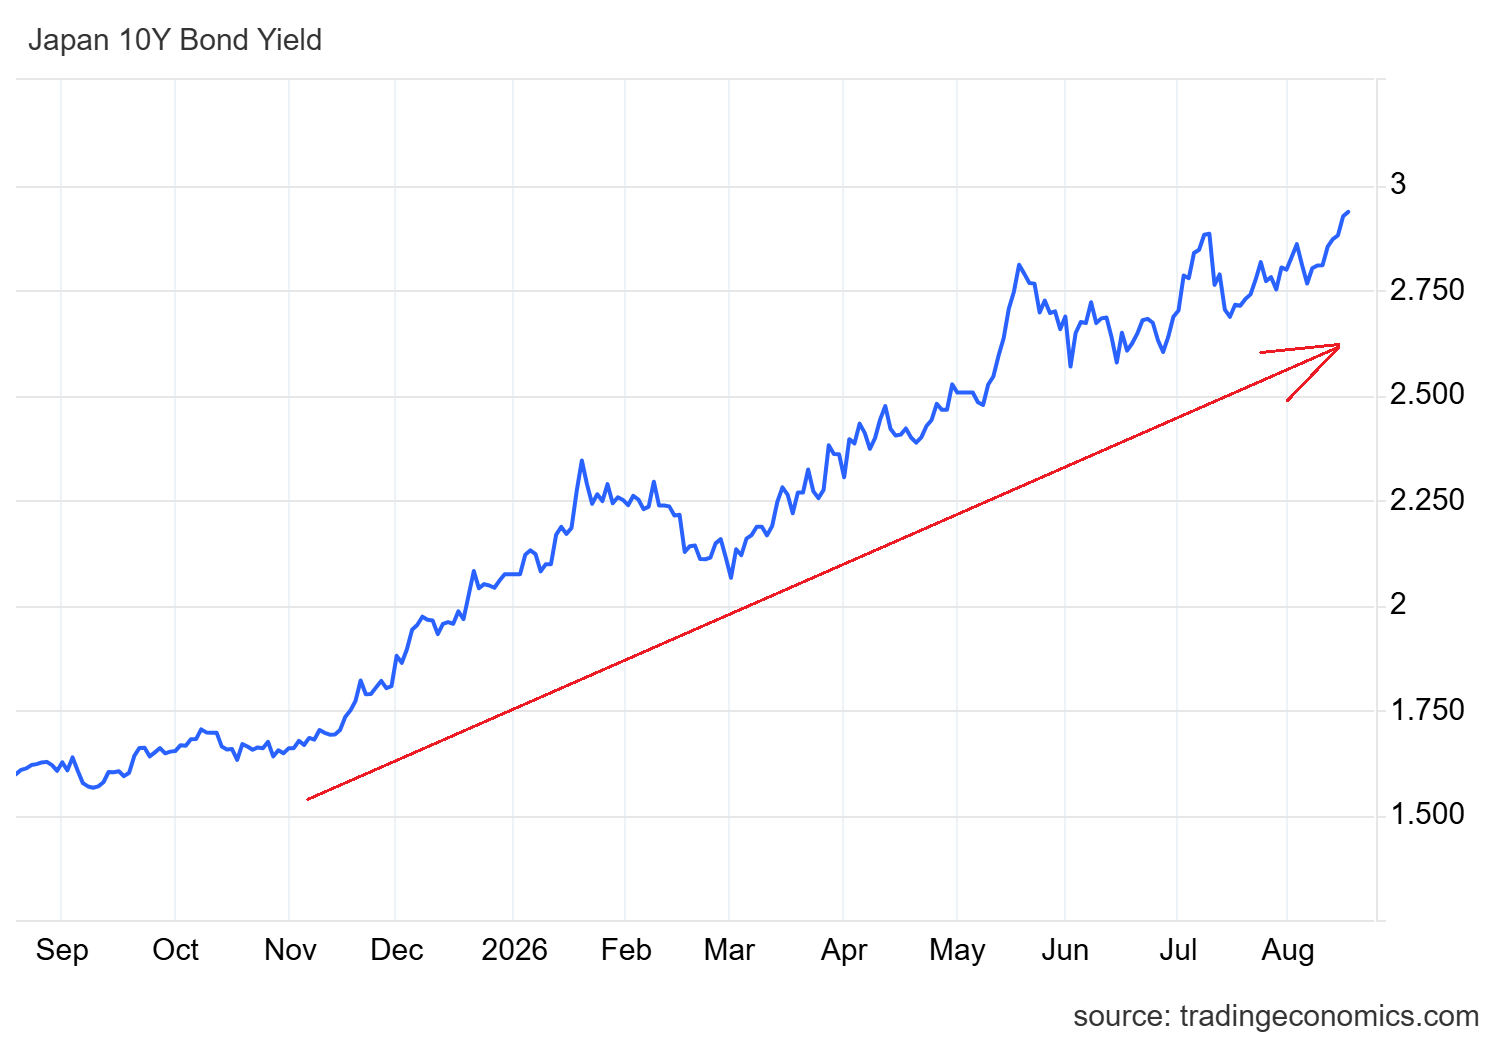
The higher yields create problems as Japan has very large debt burden. In 2025, general government gross debt amounted to approximately 248.7% of GDP. As yields rise, refinancing this debt will become more expensive.
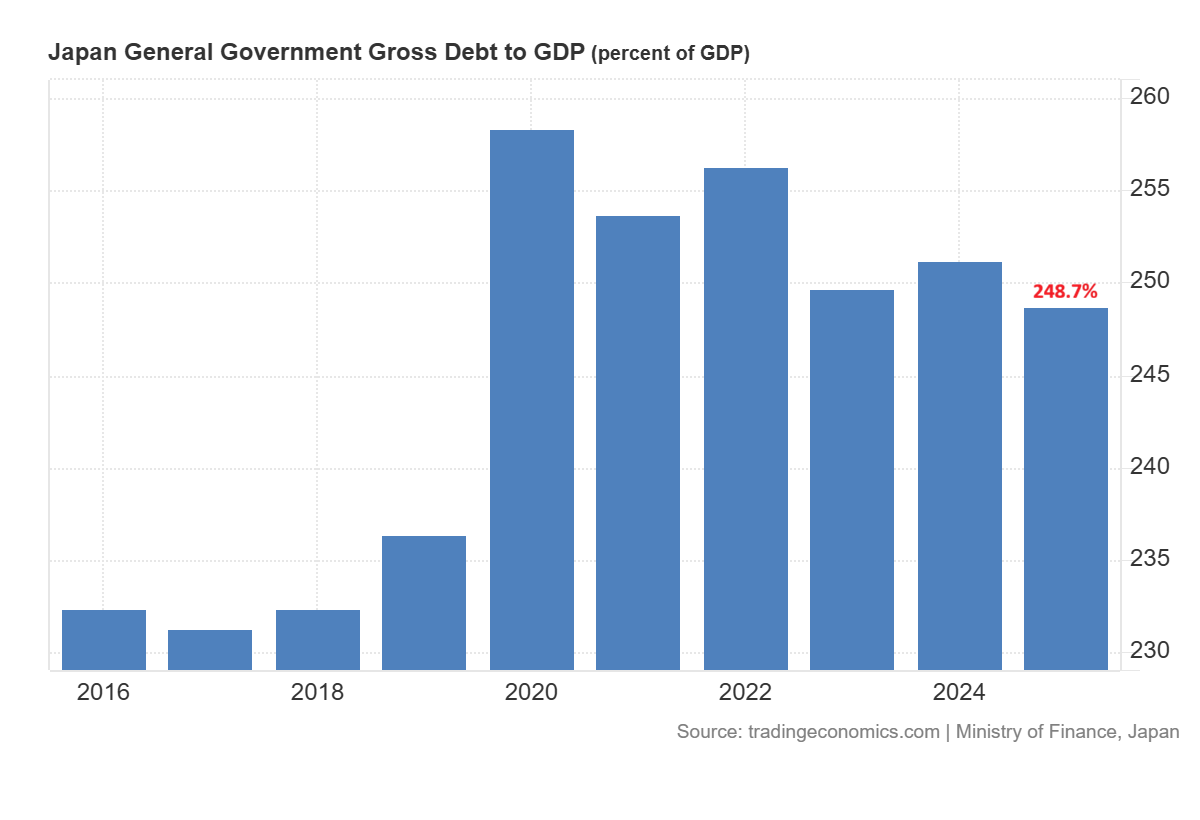
The finance ministry of Japan estimates that the debt servicing costs may increase from 31.3 trillion yen in fiscal 2026 to 40.3 trillion yen in fiscal 2029. The bond issuance might also rise from 29.6 trillion yen to 38 trillion yen. This would put further pressure on the finances of the government.
Now the Bank of Japan faces tough choice. It can scale back its purchases of bonds and let yields rise. This will support the yen, but at the expense of the cost of government financing. The bank can also be positioned to purchase additional bonds to manage yields. That could provide some relief to the bond market but it might put more pressure on the yen. In June, the BOJ decided to extend its purchase of government bonds of about 2 trillion yen per month, after pausing part of the planned reduction.
As the currency continues to weaken, that may drive Japanese investors to view gold as a safe haven. But that’s not always a bull market signal. An aggressive rate hike by the BOJ could cause the yen to strengthen. The bond stress in Japan thus reinforces the longer-term gold argument, and could lead to some near-term volatility.
Gold Price Forecast: Break Above $4,500 Targets $5,000
China provides the strongest direct support for the gold outlook. The PBoC continues to add gold while Chinese ETF holdings continue to rise. Japan provides more indirect argument. Its high debt, rising yields and weak currency increase concern about the stability of traditional government bonds. These market developments may encourage greater diversification into gold.
The gold price also remains structurally bullish within the ascending broadening wedge pattern as seen in the chart below. The price produced strong rebound from the lower support of this ascending broadening wedge pattern in July 2026.
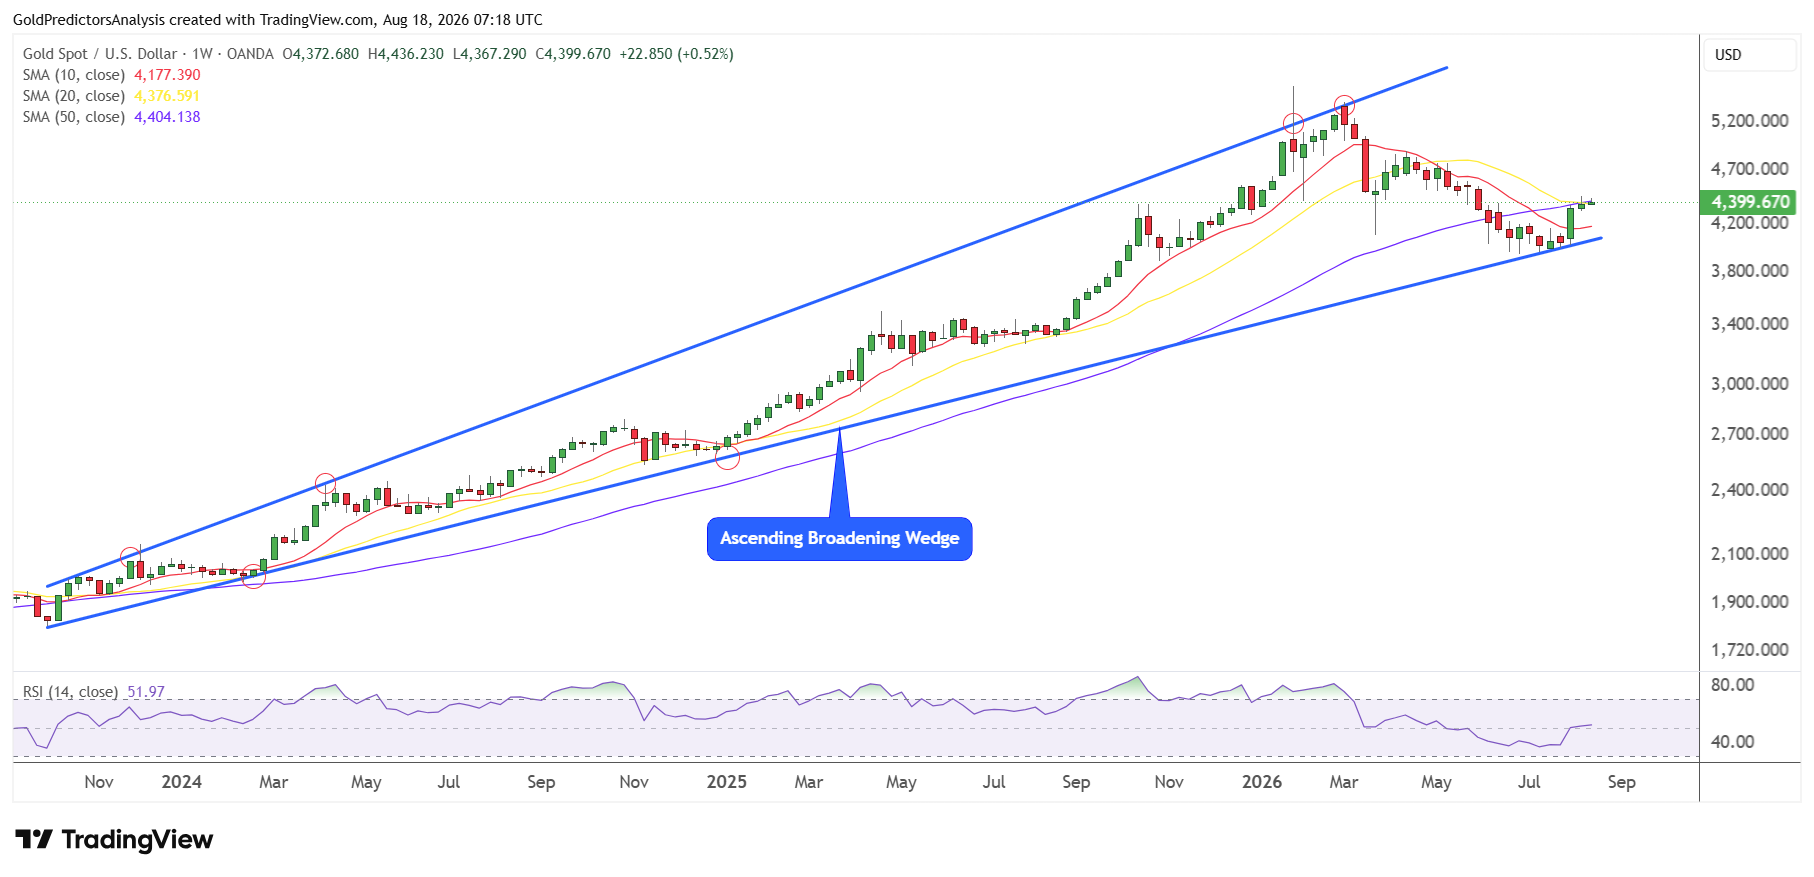
The price has now hit the 20-week SMA and looks set to break higher. A break above $4,500 will likely push the price towards the $5,000 area, which is a strong pivotal resistance in the gold market.
But a break below $3,900 will indicate further downside before the next stronger rally emerges. The RSI remains at the midline and is waiting for the next directional move.
Gold-to-Silver Ratio Signals the Next Move in Gold Prices
The strength in the gold price is also observed using the gold to silver ratio, which continues to drop in a significant downtrend. The chart below shows that the ratio broke below the ascending channel pattern in November 2025 at the 78 level.
After the breakout, the ratio dropped to form a low at the 43.41 level in January 2026, when gold and silver prices produced peaks at $5,600 and $120, respectively.
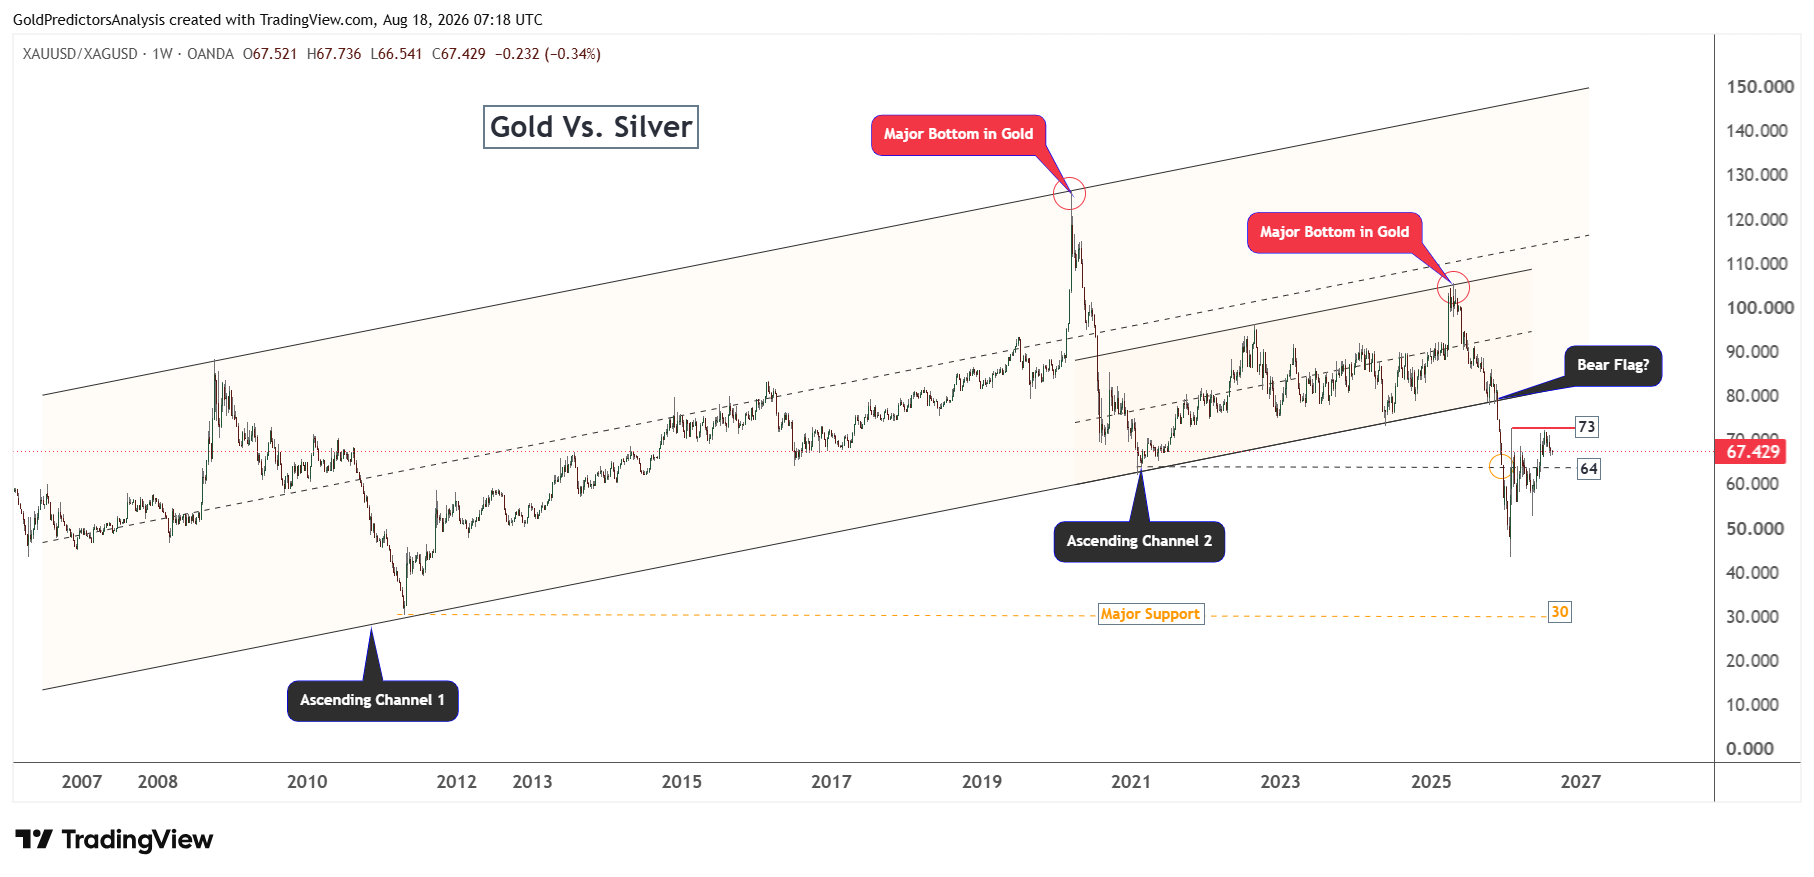
The ratio initiated a rebound in February when gold and silver (XAG) prices corrected lower towards their respective support levels. The formation of peaks in the ratio may trigger major bottom in the gold market.
The ratio has now recovered towards the 73 resistance level but remains weak and continues to drop. If the ratio fails to break above the 80 level and continues to drop after this recovery, this will indicate that gold and silver prices are ready to surge again towards record levels.
Final Words
The gold buying from China provides strong support for the long term outlook. The PBoC continues to increase its reserves while Chinese investors add money to gold ETFs. The rising bond yields in Japan and heavy debt burden also strengthen the demand for safe assets. But the weak jewellery demand in China and a possible BOJ rate hike may cause short-term volatility.
The technical outlook for gold remains constructive, but the price must break above $4,500 to strengthen the recovery. This breakout could push the price toward the key $5,000 resistance. But a break below $3,900 may weaken the bullish outlook and signal deeper correction. The gold price may remain volatile within broader bullish structure until these levels break.
Read more: Weak US Retail Sales Push Gold Toward $4,500