



Gold (XAU) prices traded around $4,300 on Thursday as investors assessed the first rate hike by the Federal Reserve in more than three years. The 10-year Treasury yield remained elevated near 5% while the U.S. dollar reached seven-week high. These moves increased pressure on gold but the price recovered from the six-week low. In my view, the next move in gold will depend on whether Treasury yields extend their rise or retreat after the initial Fed reaction. This article examines how the Fed decision, Treasury yields and the relationship between gold and silver may shape the next move.
Fed Rate Hike Raises Further Tightening Risks for Gold
The Federal Reserve raised the benchmark rate by 25 basis points to a target range of 3.75%-4.00% in the September meeting. The FOMC approved the decision by unanimous 12-0 vote. Fed Chair Kevin Warsh said that inflation had remained too high for too long. President Trump again called publicly for lower interest rates. But the unanimous decision sent a hawkish signal to the markets.
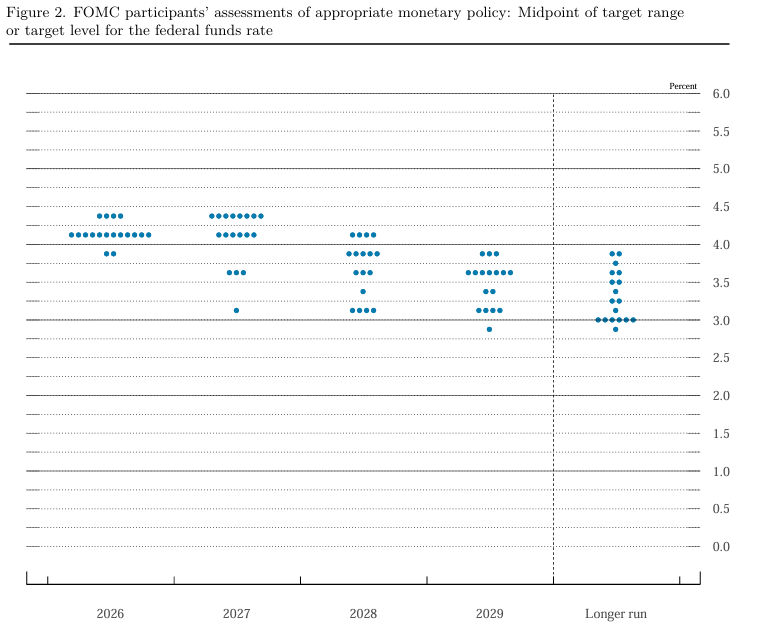
The updated Fed dot plot showed that 16 of 18 participants expect at least one more rate hike this year. Four officials projected two additional increases. Warsh did not submit a projection. The 2-year Treasury yield held near 4.72% which shows that investors expect policy to remain restrictive. This lifted the US dollar and increased the cost of holding gold.
The long-term bonds reacted differently. The 10-year Treasury yield hovered near 5% but the Fed decision initially calmed the long end of the yield curve. Some investors had feared that keeping rates unchanged could weaken confidence in the inflation response by the Fed and trigger sharp bond sell-off.
Gold recovered because the hike was largely priced into the market. But higher short-term yields and a stronger dollar may continue to limit the recovery in the gold market.
Gold Price Forecast
Every new Gold analysis as it publishes, today's technical signal and key levels, live price — on one page.
See all Gold forecastsTreasury Yields Near 5% and Rising Real Yields Pressure Gold
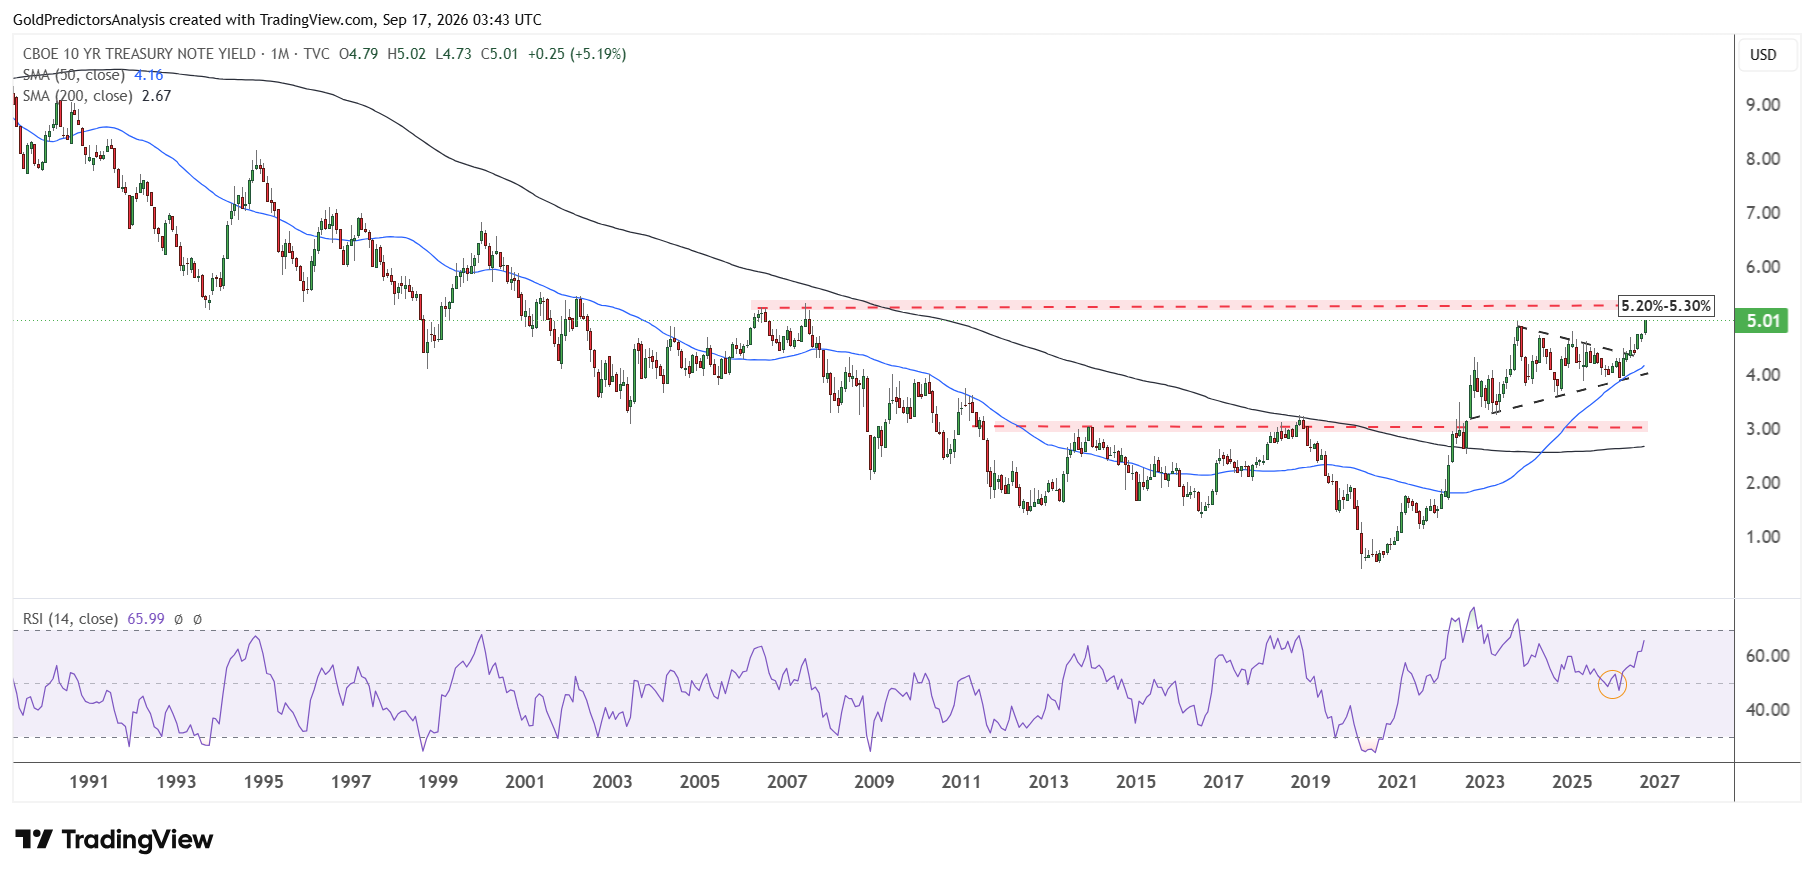
The chart below shows that the 10-year Treasury yield has moved above the recent consolidation and is approaching the resistance zone at 5.20%-5.30%. This resistance zone is considered a long-term resistance.
The yield also remains above the moving averages of 50-month and 200-month. The monthly RSI near 66 confirms strong momentum, but the monthly candle of September has not closed. A sustained move above 5% would increase the risk of another rise toward the resistance zone.
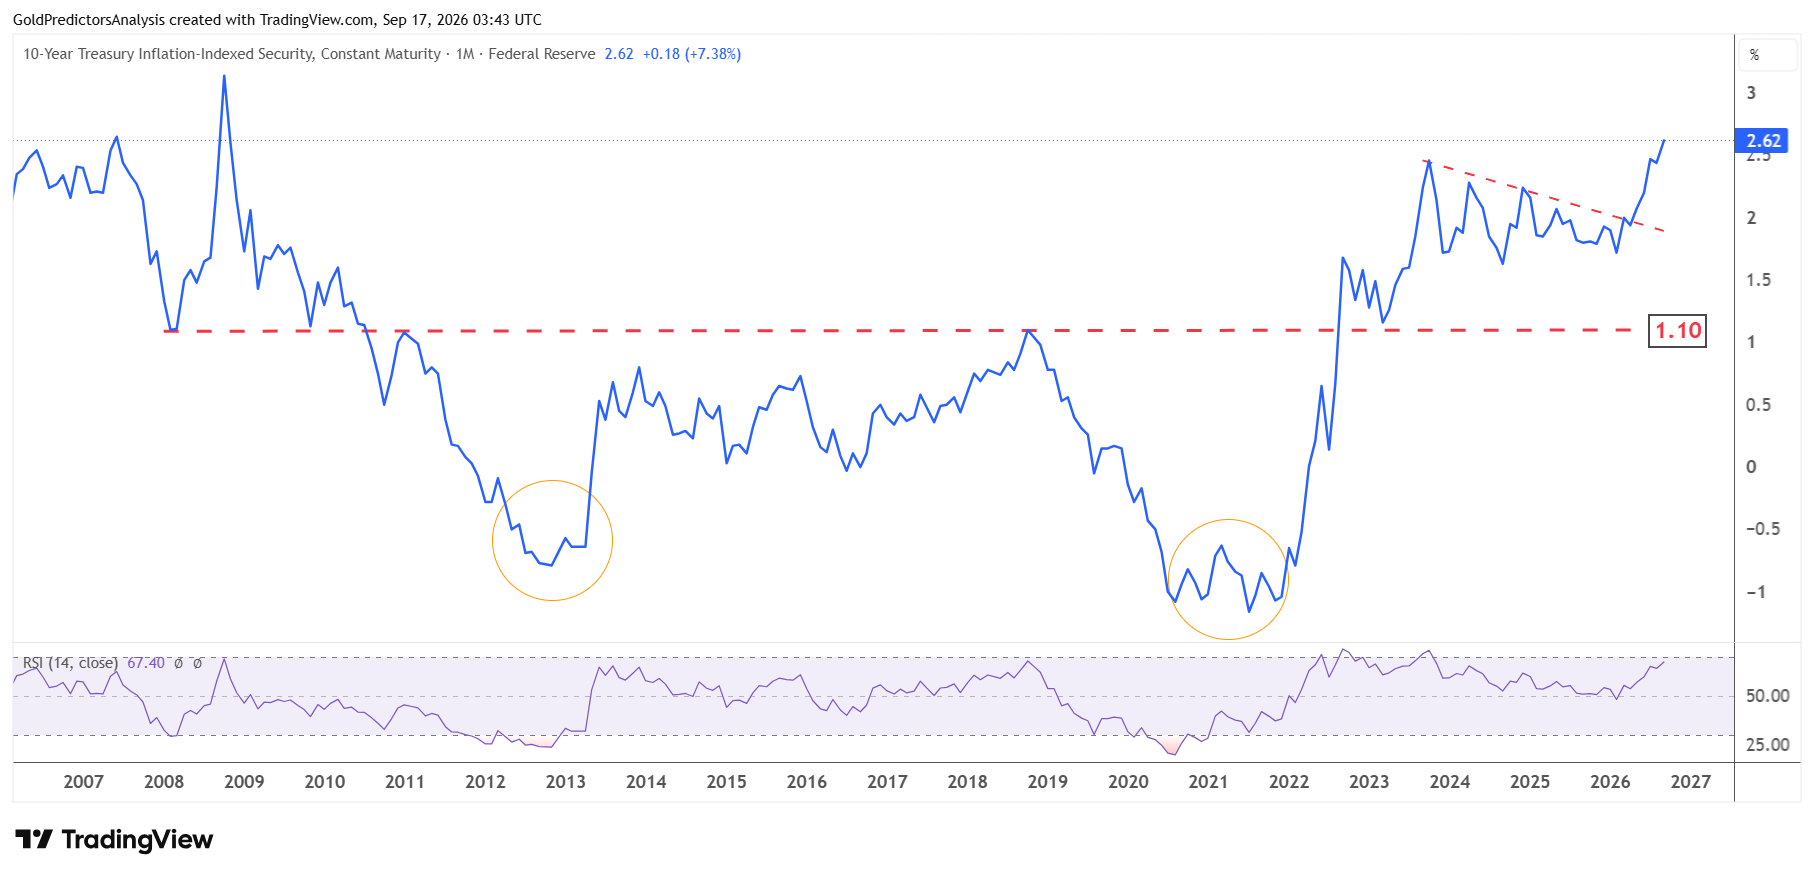
The rise in real yields creates a stronger headwind for gold. The chart below shows that the 10-year inflation indexed Treasury yield reached 2.62% on September 15. This is close to the highest level since the financial crisis of 2008.
It has also moved above the descending resistance line that stretches from the 2023 high. The surge in real yields offers investors the strong inflation-adjusted return from government bonds. This raises the opportunity cost of holding gold, which does not pay interest.
Warsh identified three forces behind higher long-term yields. These include a stronger economy, increased competition for capital from AI-related investment and geopolitical instability.
In my view, heavy federal borrowing is another important factor. U.S. debt has moved above $40 trillion while the fiscal deficit reached about $1.97 trillion during the first 11 months of FY2026 through August. These conditions may keep Treasury supply and long term yields elevated. Therefore, the Fed hike may slow the rise in yields but it may not reverse it.
Gold and Silver vs. Treasury Yields: What the Charts Show
The chart below shows that the relationship between Treasury yields and precious metals changes across market cycles. From August 2020 to October 2023, the 10-year yield surged while gold and silver (XAG) largely consolidated.
The yields then moved sideways at elevated levels from October 2023 to early 2026 while both metals recorded strong gains. This shows that interest rates matter but geopolitical risk, inflation concerns and demand from safe havens can sometimes outweigh the pressure from higher yields.
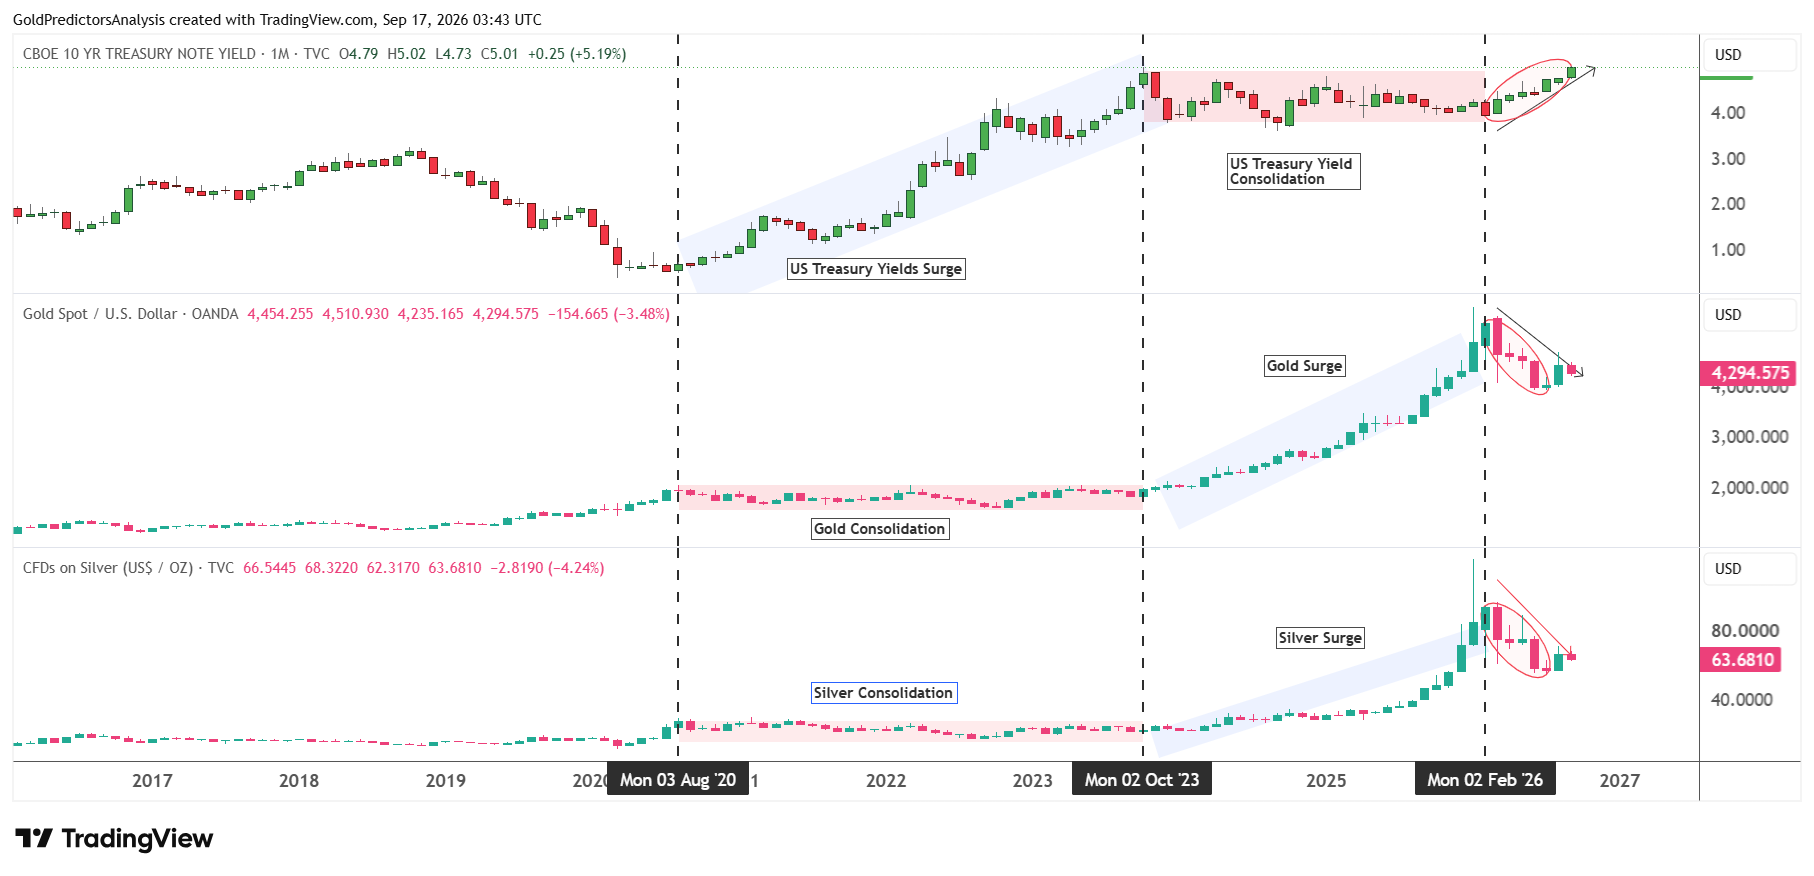
Since February 2026, the renewed rise in Treasury yields has coincided with corrections in gold and silver. The incomplete September candles show gold near $4,295 and silver around $63.70 while the 10-year yield trades close to 5%.
A sustained rise toward 5.20%-5.30%, combined with real yields above 2.60% may extend the pressure on both metals. But a rejection from this yield zone would reduce the opportunity cost pressure and offer a recovery in gold and silver prices.
Gold Technical Analysis: $4,000 Marks Key Long-Term Support
From a technical perspective, the spot gold price has been consolidating above the pivotal $4,000 area over the past three months. The chart below shows that this pivotal zone is defined by an ascending channel pattern that stretches from the August 1976 lows. This ascending channel was broken in September 2025 and prices hit a high near $5,600 in January 2026.
After hitting this record high, the price corrected back toward the breakout area of this channel, which lies near $4,000. If gold prices hold this support zone, then the possibility of another rally in the gold market toward the $6,000 area is high. But a break below the $4,000 region will likely initiate deeper correction toward the blue dotted trendline at the $3,000 area that stretches from the 1980 highs.
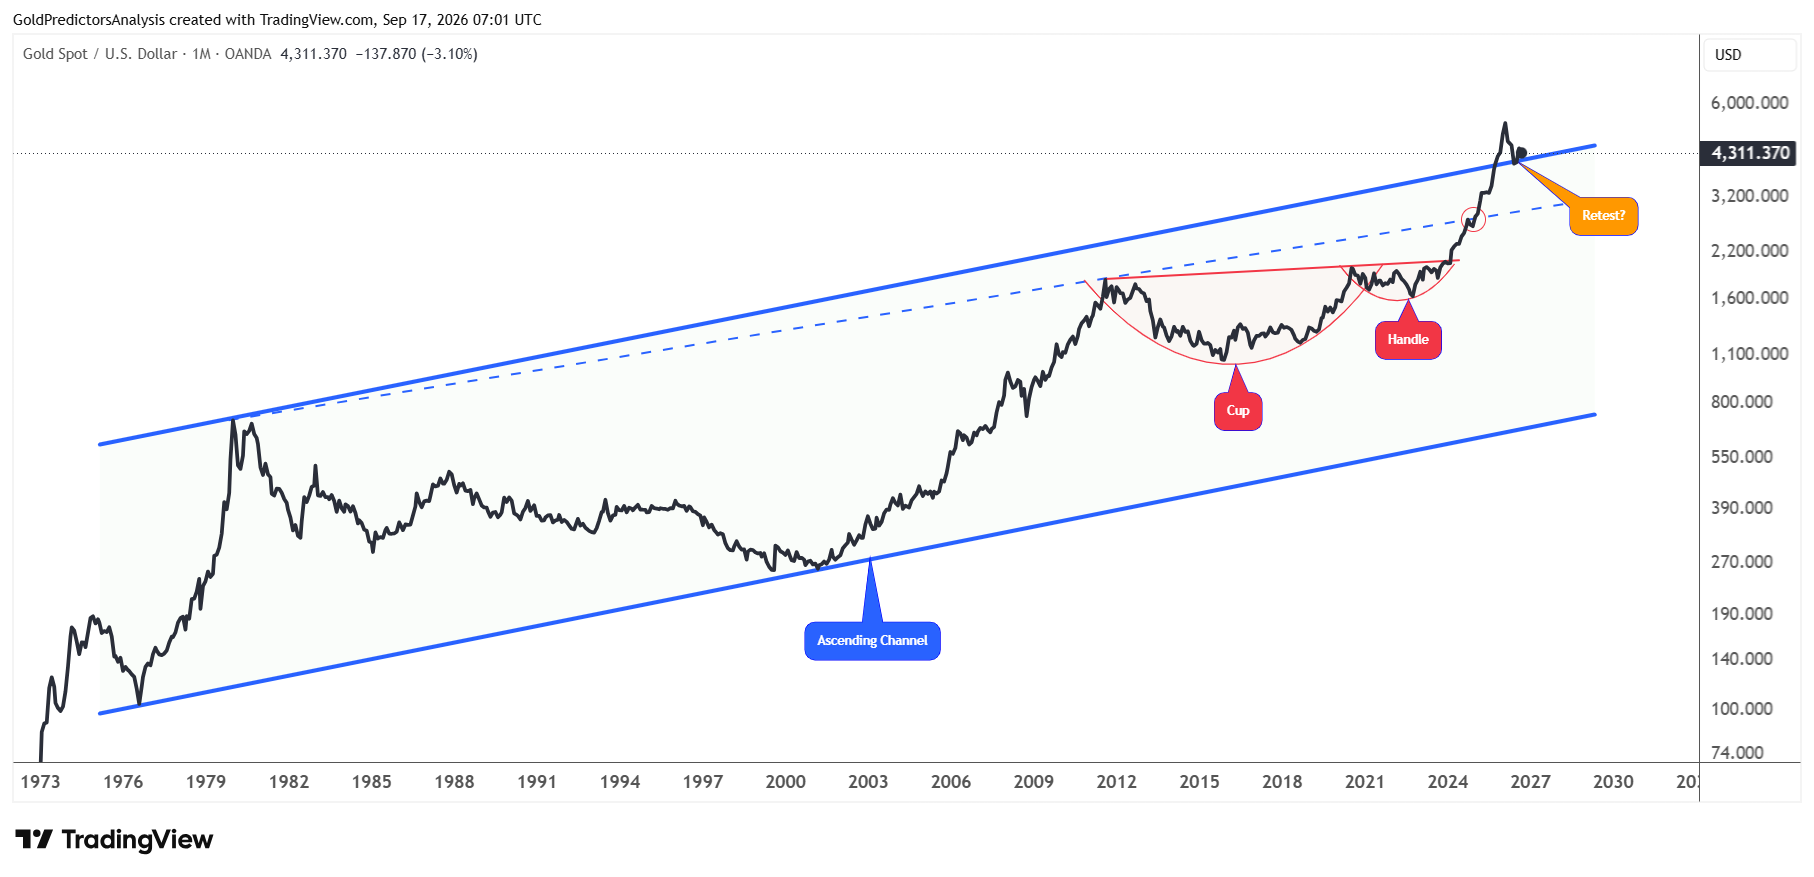
However, this correction toward $3,000 will still not change the strong bullish price structure in the long term. This bullish structure is defined by the formation of a cup and handle pattern from 2011 to 2024 within the broader ascending channel. The $4,000 or $3,000 areas may be considered strong long-term pivotal points for investors.
Gold Price Risks: Strong Dollar and Higher Treasury Yields
The main risk to the bullish outlook for gold comes from the sustained rally in Treasury yields and the U.S. dollar. If the 10-year yield breaks above the 5.20%-5.30% zone and real yields remain above 2.60%, gold could lose the $4,000 support and move to $3,000. Strong economic data or further Fed rate hikes could increase the downside risk for gold.
But weaker growth, falling yields, geopolitical tensions, heavy government borrowing or strong demand for safe havens could support the gold outlook and trigger another rally to $5,600 and $6,000. Therefore, investors may watch the $4,000 support and the Treasury yield zone of 5.20%-5.30% as the key risk levels.
On the other hand, the US dollar index has surged to 100.35 after the Fed rate hike. The strong US dollar keeps the gold and silver prices under pressure. A confirmed break above 100.50 could push the index to 101.80. But a break above 101.80 will confirm a stronger rally in the US dollar index. This strength in the US dollar index may keep gold and silver prices under pressure.
Key Levels to Watch After the Fed Hike
Gold remains under pressure after the Fed rate hike because Treasury yields and the U.S. dollar remain strong. A rise in the 10-year yield toward 5.20%-5.30% and a dollar index break above 100.50 could extend the correction in the gold price. In this case, the $4,000 area remains the key support. A confirmed break below this level could expose the $3,000 region.
But the bullish structure in the long term remains intact while gold holds the support area near $4,000. A decline in yields, a weaker dollar, slower economic growth or strong demand for safe havens could bring buyers back. Gold could then retest $5,600 and later move to $6,000. In my view, the reaction around $4,000 will determine whether the current correction becomes the opportunity for investors or develops a deeper decline.
Read more: Could $100 Oil Push Gold Toward $4,000?