


Gold (XAU) price remains under pressure as the bullish structure in US Treasury yields limits rallies in the precious metals. In my view, the recent correction in the gold price is still not over, and prices may continue to decline further before the meaningful recovery. This article examines the Treasury yield outlook, real yields, the gold price structure and the gold-to-silver ratio to determine the next move in the gold market.
10-Year Treasury Yield Outlook Points to a Break Above 5%
One of the most significant yields in the bond market is the 10-year Treasury yield. It reflects the return investors demand for holding long term U.S. government debt. Any changes in this yield also affect the outlook for gold as they dictate the opportunity cost of holding a non-yielding asset.
The monthly chart for the 10-year U.S. Treasury yield shows a strong recovery from the March 2020 bottom at 0.40%. The yield has recovered to the 4.70% level since the bottom.
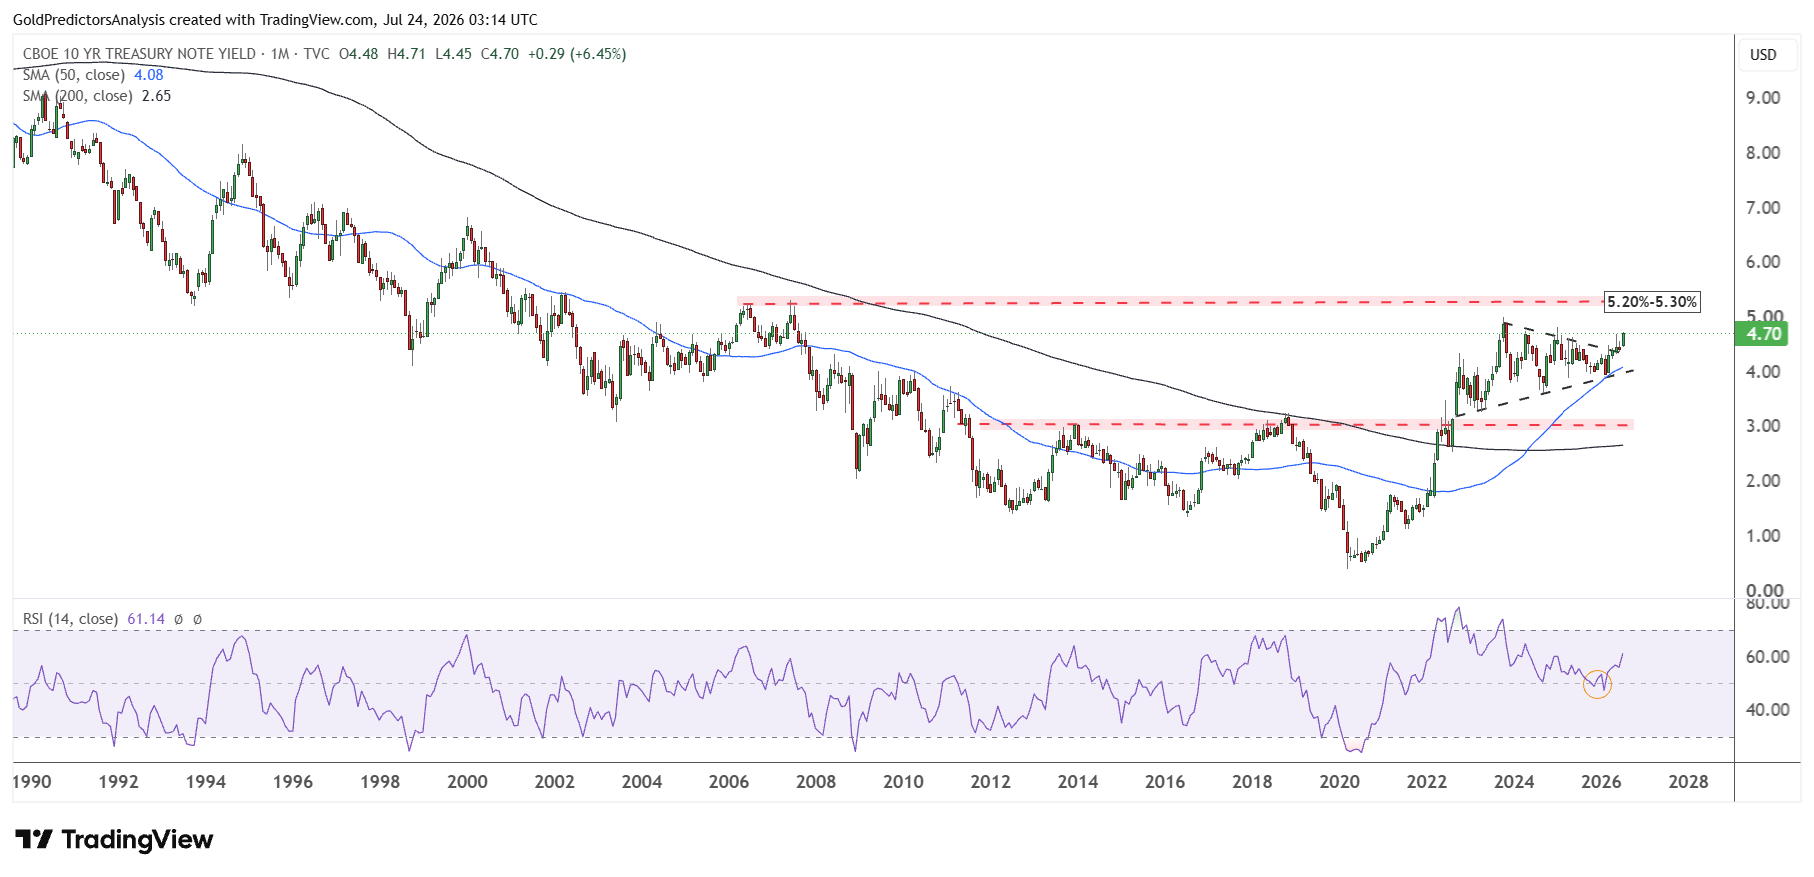
The strong V-shaped recovery from March 2020 and then the breakout above the 3% level indicate continued upward momentum. The Treasury yields also formed a triangle pattern from the October 2023 highs toward the January 2026 lows.
After forming this triangle, the yield formed strong support at the 50 SMA on the monthly chart before producing a strong surge in March, April and May 2026. This technical formation suggests that the 10-year U.S. Treasury yield could move to the 5.20% to 5.30% level which is defined by the 2007 highs.
The recent recovery from March 2020 is also reflected in the extremely oversold conditions seen in the RSI. The recovery in March 2026 after the U.S.-Iran war also intersected with the rebound from the mid-level of the RSI. This indicates continued strength in U.S. Treasury yields.
Gold Price Forecast
Every new Gold analysis as it publishes, today's technical signal and key levels, live price — on one page.
See all Gold forecastsGold Price Outlook Weakens as U.S. Treasury Yields Rise
It is interesting to note that U.S. Treasury yields and the gold market have shown a strong inverse correlation historically. From March 2020 to October 2023, the U.S. Treasury yield continued to surge from 0.50% to 5%. During this period, gold prices failed to break higher and consolidated between $2,000 and $1,500.
However, when the U.S. Treasury yield produced a high at 5% and dropped to 3.60%, gold prices continued to surge from around $2,000 in October 2023 to a high of $5,600 in January 2026. During this period, the U.S. Treasury yield was consolidating between 3.60% and 5%.
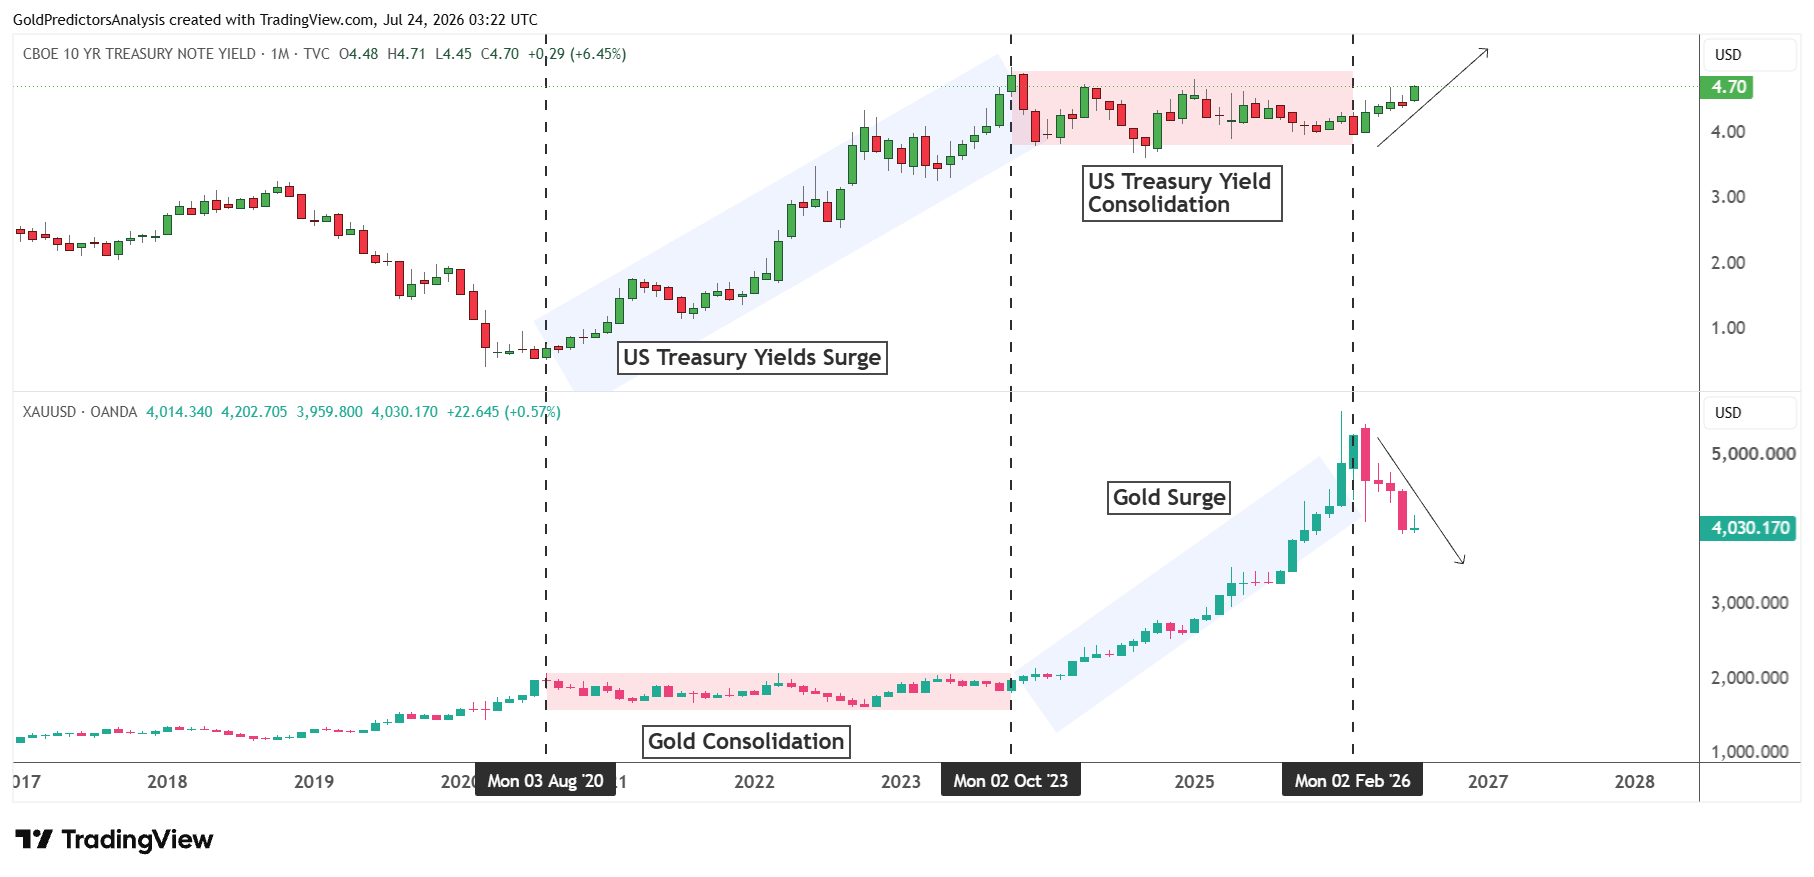
But now, after the U.S.-Iran war, the U.S. Treasury yield has produced a strong bottom at 3.96% and continued to surge with strong bullish momentum, as seen in the monthly candles.
This surge in the U.S. Treasury yield has triggered a strong drop in gold from a record of $5,600. Gold prices still remain under pressure, as seen by the last three monthly candles.
This indicates that as the U.S. Treasury yield is poised to surge higher and break the 5% level, it may keep the gold price under pressure to form the next meaningful bottom.
Real Yields and Fed Policy Could Limit the Gold Price Recovery
Many investors use the 10-year TIPS yield as measure of real interest rates. This is significant for gold as the increase in real yields can make bonds more appealing than gold. The drop in real yields can have the exact opposite effect and boost the demand for valuable metals.
But the TIPS market does not necessarily read real rates correctly. It is less liquid and smaller than the broader Treasury market. Federal Reserve asset purchases can also influence the pricing especially during periods of aggressive quantitative easing. The years 2013 and 2022 are examples shown in the chart below. This indicates that the TIPS yields can move away from the true economic picture.
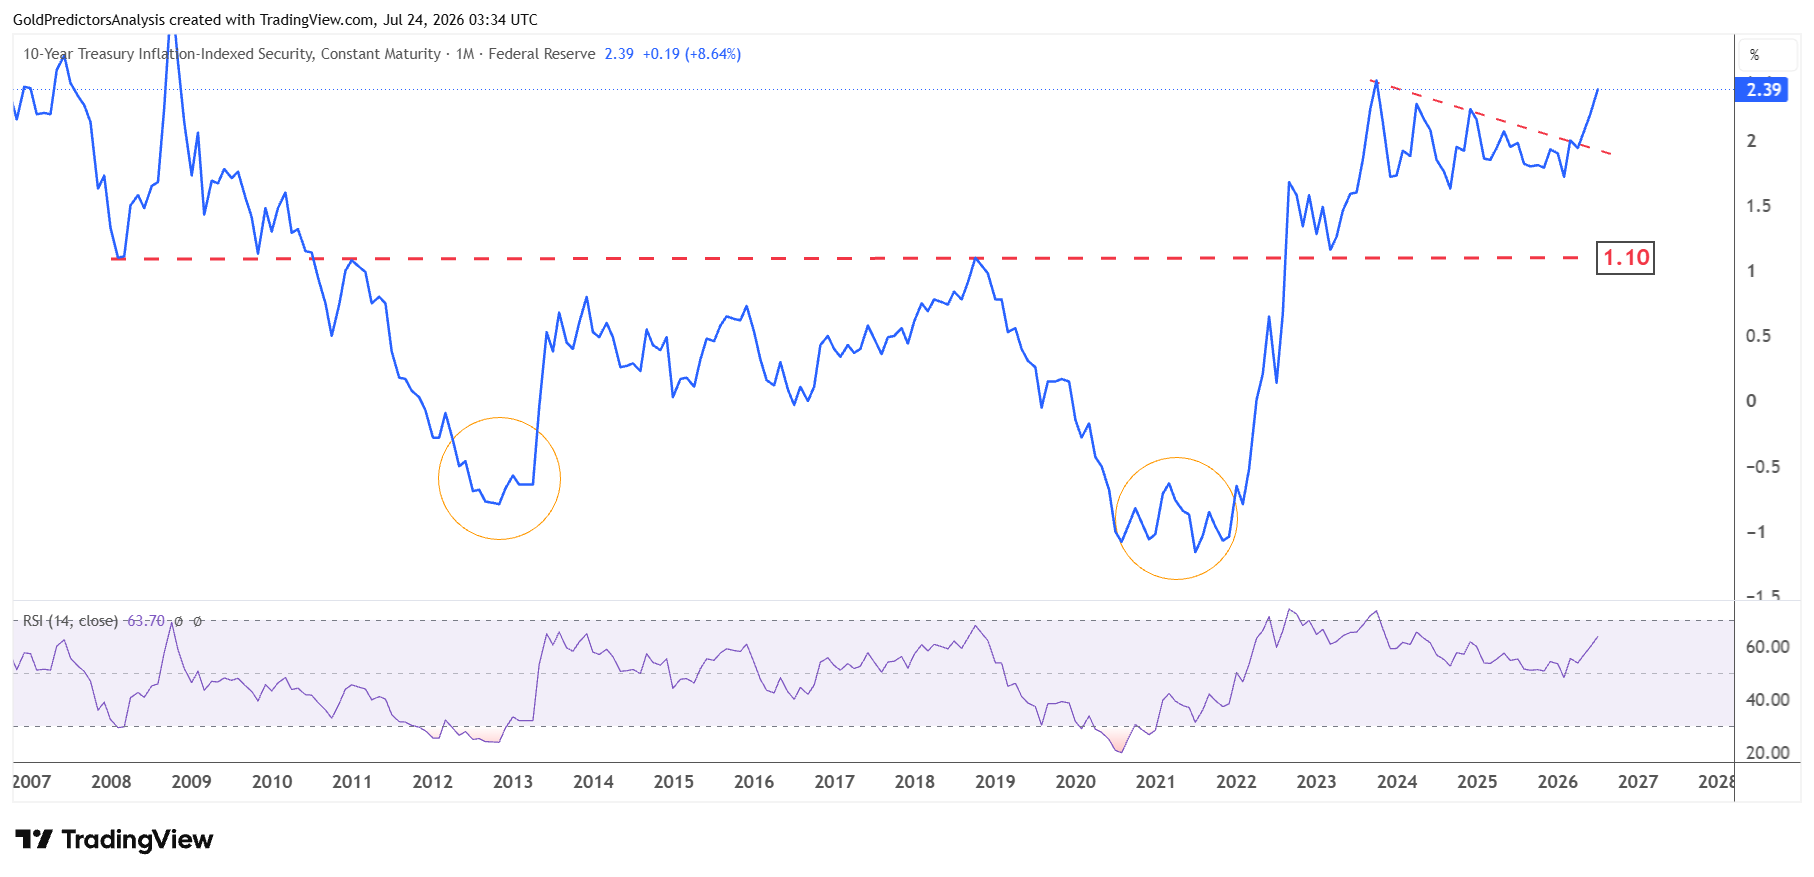
This same problem applies to the 10-year breakeven inflation rate as it is based on nominal Treasury and TIPS yields. But big spreads between the market-based breakeven rates and other inflation expectations measures may indicate that market conditions are influencing the data.
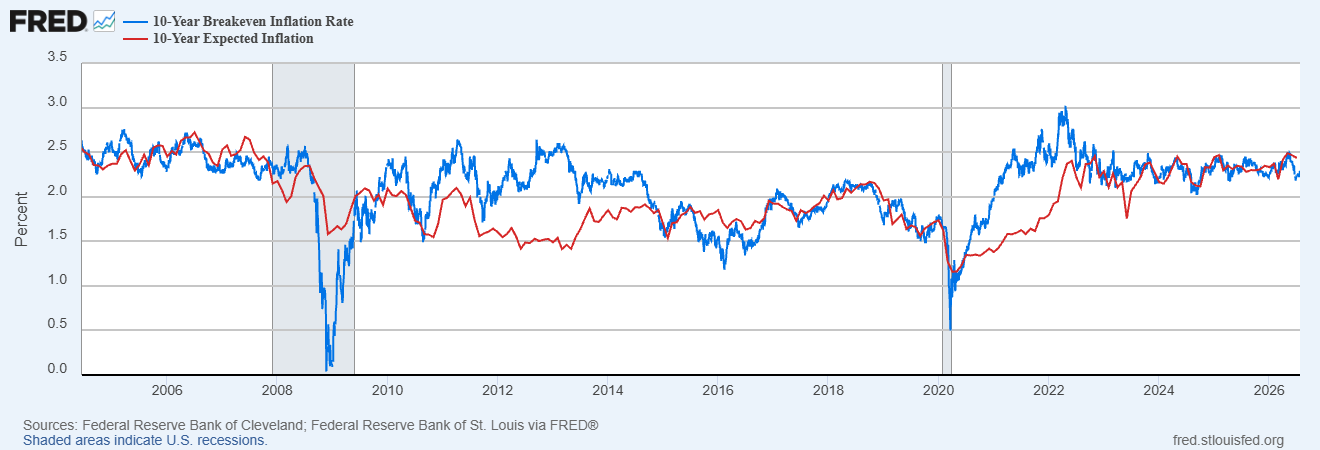
The continued upward momentum in US Treasury yields from fundamental and technical drivers may keep gold under pressure. The drop in yields would lower the opportunity cost of owning gold and provide another boost to a potential recovery. But as long as the US Treasury yields continue to rally due to high inflation expectations, the gold price rally may be limited.
Gold Price Eyes Major Support at $3,000–$3,500
Gold prices have broken the long-term structure as seen by the triangle at the $3,000 region. But the recent decline in the gold price from $5,600 is a significant correction. The monthly candles over the past three months suggest that the price may correct further before the next significant move.
From historical perspective, gold prices usually retrace back toward the breakout zone to keep the bull market healthy. This means that the strong support in gold remains around the $3,000 to $3,500 region. This support may produce the bottom before the next rally higher. But a break below $3,000 may push prices toward $2,500.
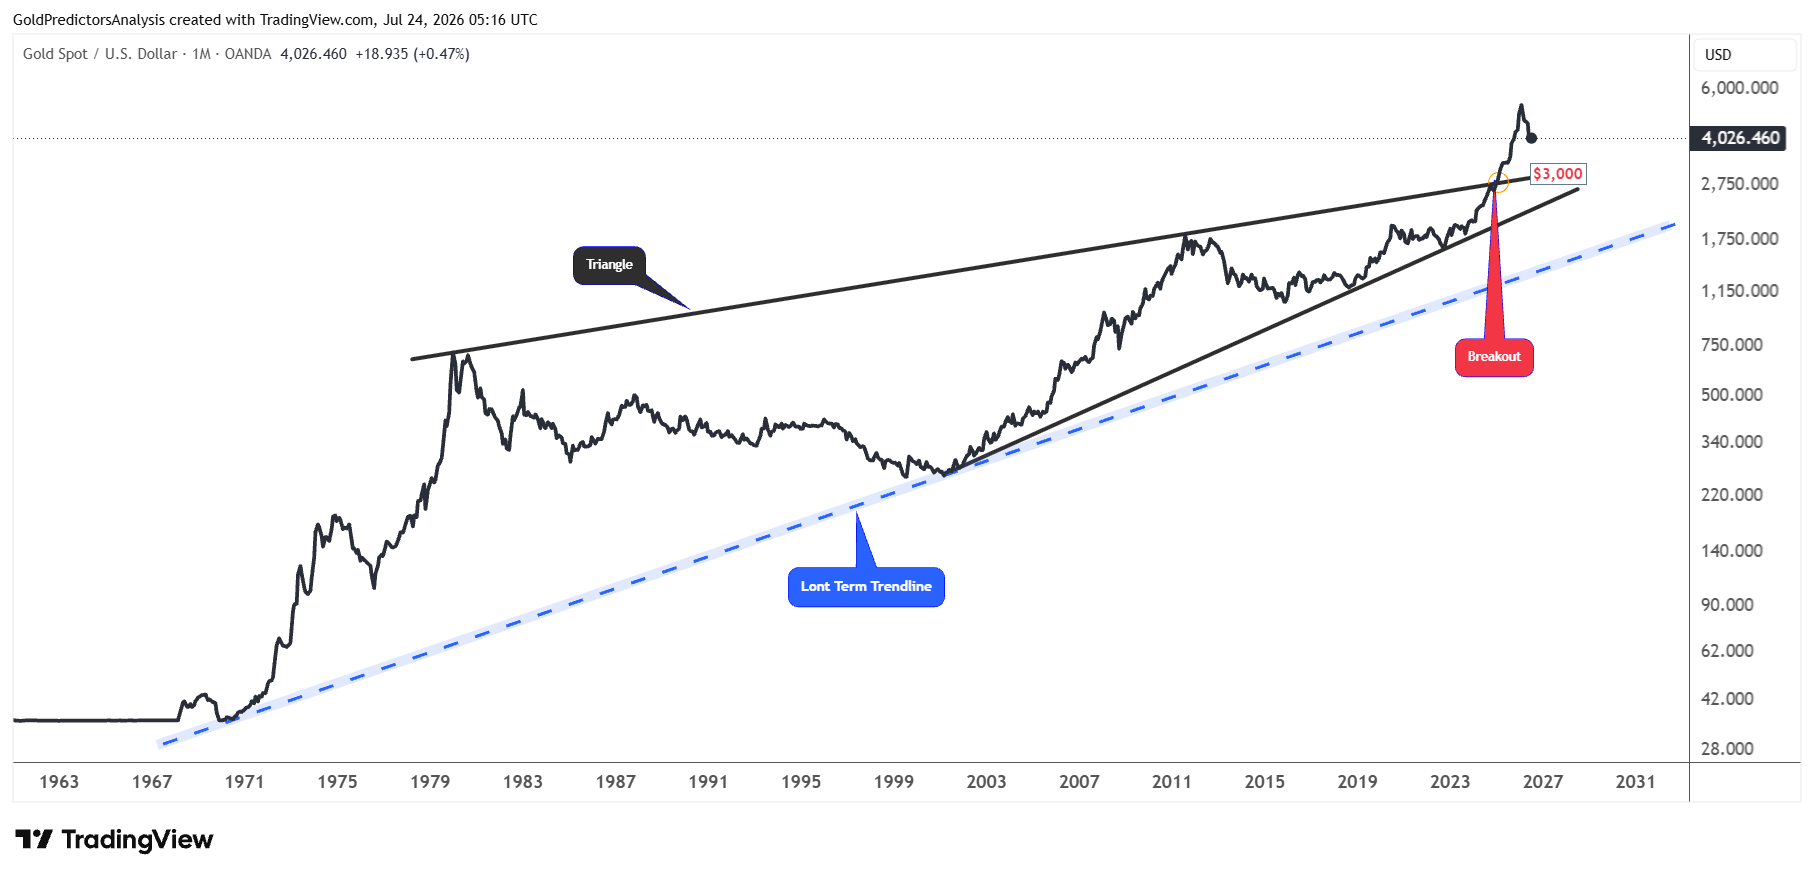
As long as prices remain above the long-term trend line at $1,500, the long term trend for gold still remains bullish. But the next move in the gold market is driven by movements in the oil market, the inflation scenarios and expectations of Fed rate cuts. These indicators are impacting the U.S. Treasury yield and the U.S. Dollar Index which remain the key drivers of gold movements.
Gold-Silver Ratio Signals Further Downside for Precious Metals
The gold-to-silver ratio is a good indicator to identify the peaks and bottoms in gold and silver (XAG) markets. It is interesting to note that silver continues to outperform gold during bull market rallies.
Therefore, when the ratio peaks, it confirms a bottom in gold and silver as silver prices start to lead gold. There are many examples from a historical perspective, as seen in the chart below. For example, the ratio peaked in May 2003, which produced a bottom in silver and initiated a strong surge in the gold market. Then, the ratio again peaked in October 2008, which produced a bottom in the gold and silver prices.
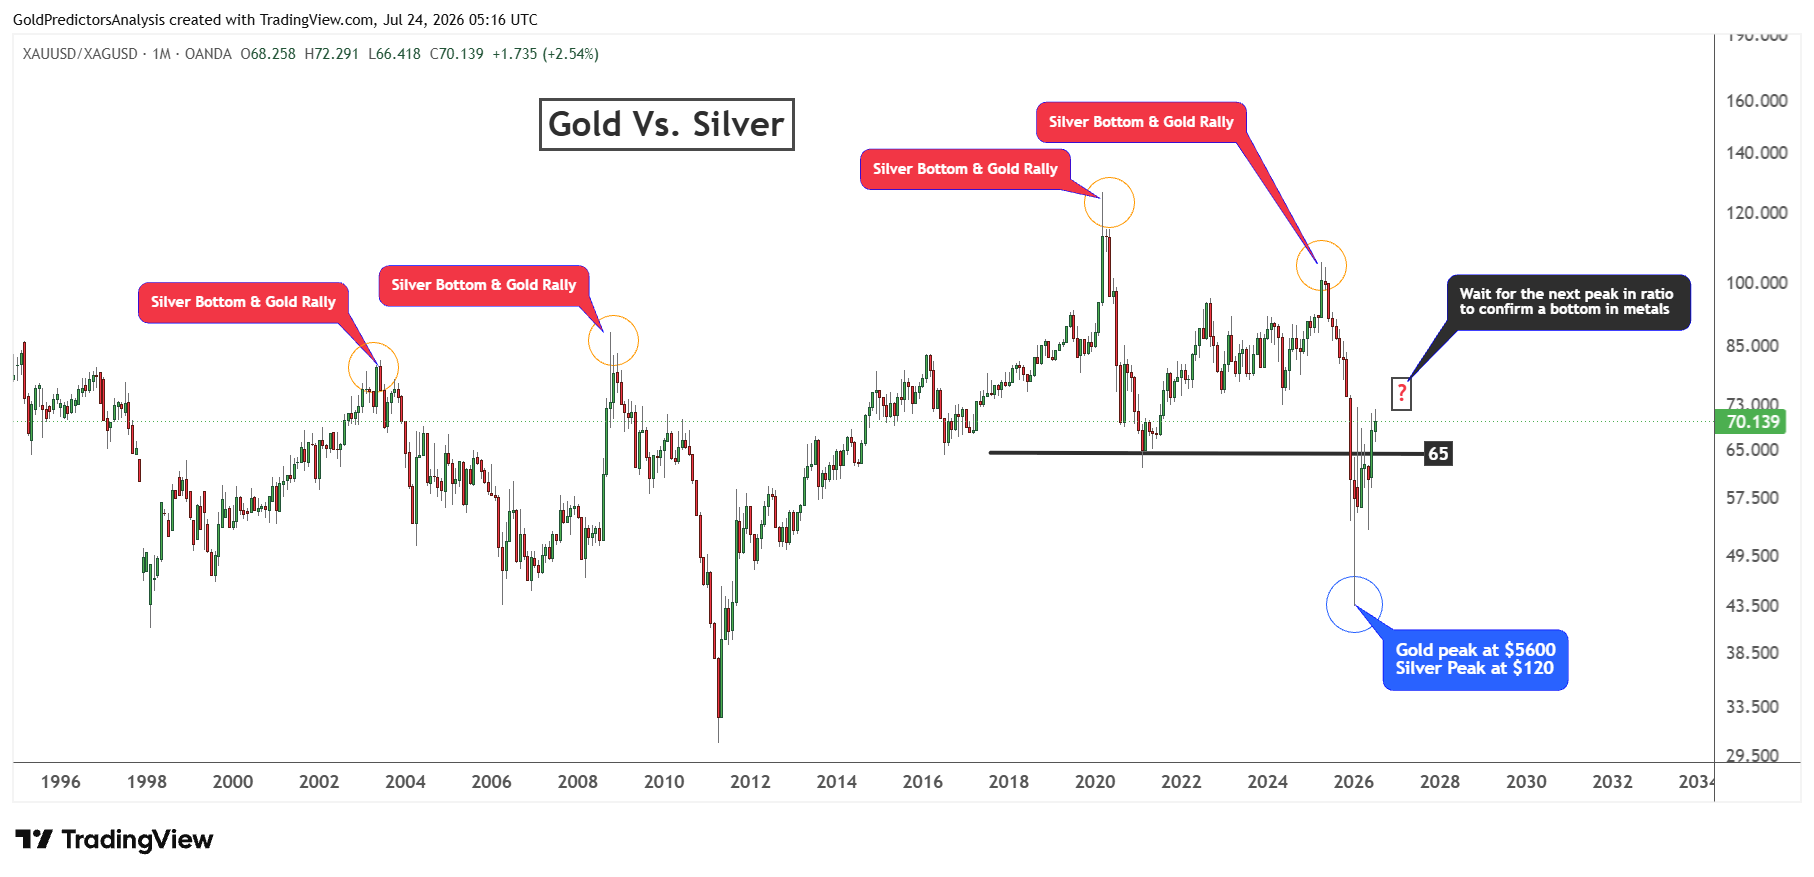
Similar scenarios were observed in March 2020 and April 2025. In both of these scenarios, the peak in ratio produced a silver bottom and a precious metals rally.
But it is interesting to note that the ratio produced a bottom at 43.40 in January 2026 and reversed higher above the 65 level in July 2026. When the ratio produced a bottom, the gold price peaked at $5,600 and the silver price produced a peak at $120.
The strong recovery from this bottom indicates that the ratio has bottomed and is continuing to rally. This indicates that gold and silver prices may continue to decline further.
Now the market is waiting for the next significant peak in the ratio to confirm a bottom in both metals. The recent monthly candle configuration suggests that the market is waiting for the next significant peak as the ratio has broken above 65. This indicates further downside in both metals.
Bottom Line
Gold price may remain under pressure as long as the U.S. Treasury yields continue to rise. The 10-year US Treasury yield shows positive structure in the short term and points to a move above 5%. The higher US Treasury yields can make bonds more attractive than gold. This keeps the gold price under pressure around the key support zone of $3,950-$4,000.
The long term structure in gold remains bullish but the current correction may not be complete. The $3,000 to $3,500 region remains an important support zone for the next major bottom. At the same time, the rising gold to silver ratio suggests that both metals may face more downside before any meaningful recovery develops.
The main risk to this bearish outlook is a sharp decline in Treasury yields or faster shift toward the Fed rate cuts. This scenario could trigger a healthy recovery in the gold price. A renewed rise in geopolitical or inflation uncertainty could also strengthen the safe haven demand and limit the downside.
Read more: Strong Dollar Keeps Precious Metals Under Pressure