



Gold (XAU) price recovered on Thursday, but a strong US dollar and high real yields continue to limit the rebound. The FOMC minutes kept the focus on the rate hike in December as officials weighed the risk of persistent inflation. The high cost of energy adds to these concerns, while central bank buying offers some support. In my view, a softer dollar and a break above $4,330 would strengthen the recovery in gold. This article presents the latest fundamental drivers, key technical levels for gold and signals from the gold-to-silver ratio to understand the next move in the gold market.
Gold Fundamentals: FOMC Minutes Keep Rate Hike Risks in Focus
December Rate Hike Risks and High Real Yields Limit Gold’s Recovery
The FOMC minutes released on Wednesday kept the expectations of further interest rate hikes in December. Most of the participants considered another hike appropriate before the end of 2026 while several viewed the current policy rate as only mildly restrictive.
The officials remained concerned that the inflation could stay above target as economic activity continued to expand. But future decisions will depend on incoming economic data. Therefore, the minutes support a cautious outlook for gold without confirming another hike at the October meeting.
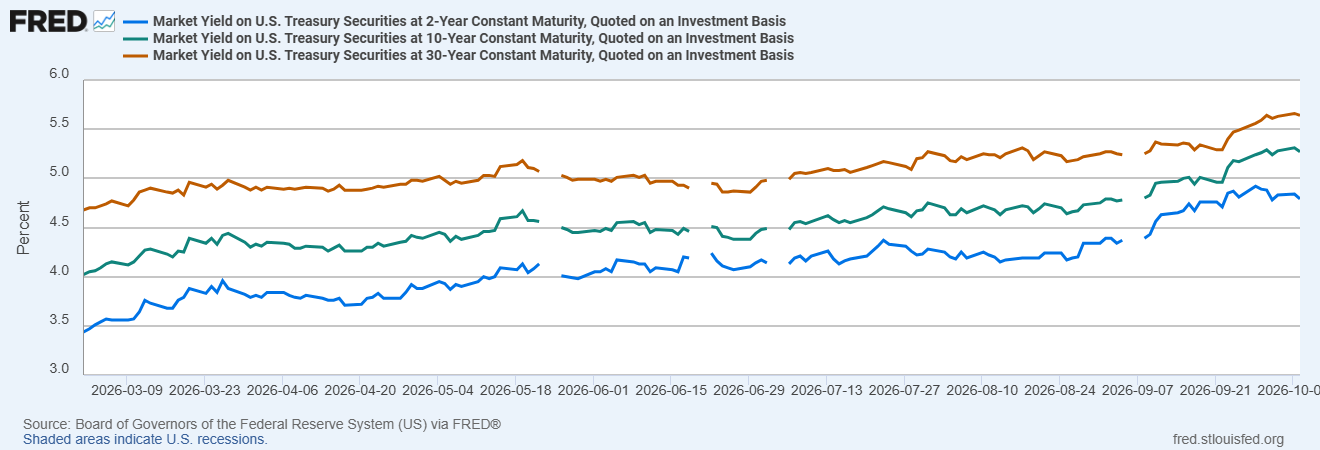
The market still favours a pause in October, but the probability of a rate hike in December remains around 80%. The gold price recovered on Thursday after touching a two-month low in the previous session. But the US dollar index remains near 102.20 and the 10-year Treasury yield is around 5.28%. These conditions continue to challenge the recovery. The chart below shows the increase in US Treasury yields since March, with yields remaining elevated in the long term.
Gold Price Forecast
Every new Gold analysis as it publishes, today's technical signal and key levels, live price — on one page.
See all Gold forecastsOil Above $100 Adds to Inflation Concerns
Energy prices remain central to the outlook for inflation. Brent oil recovered above $100 on Thursday as risks to shipping to the Middle East continued to threaten supply. US offshore operators shut in approximately 512,000 barrels of daily oil production as Isaias approached.
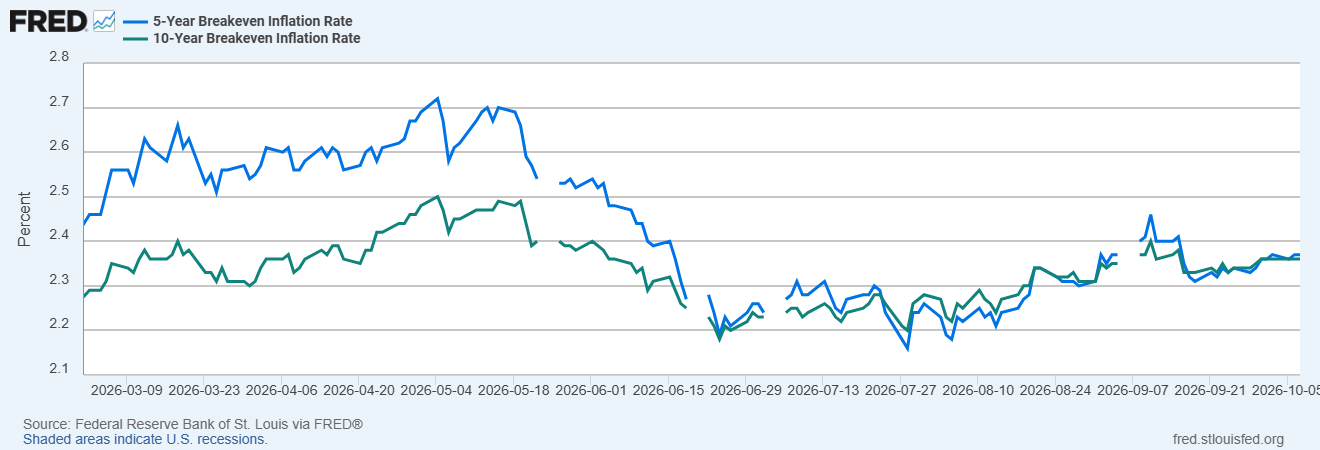
The FOMC minutes also highlighted the pressure for inflation from energy costs and strong investment in AI infrastructure. In my view, these pressures could limit the recovery in gold if investors respond by pricing in further monetary tightening. The chart below shows that the five and ten year breakeven inflation rates have recovered from the mid-year lows but remain below their spring peaks.
But the latest supply response could ease some of that pressure. IEA members supported accelerating the remaining oil releases under their existing emergency programme and prioritising diesel stocks. The outstanding commitments could bring approximately 100 million barrels to market. Faster deliveries could help contain the cost of energy but their impact will depend on continued shipping access and the duration of disruptions in production.
Bond Volatility and Central Bank Buying Shape Gold’s Outlook
The volatility in the bond market adds another risk to the gold outlook. The MOVE index eased to 102.56 on October 7, but a renewed increase in the index toward the warning level of 120 would signal greater uncertainty about the cost of borrowing.
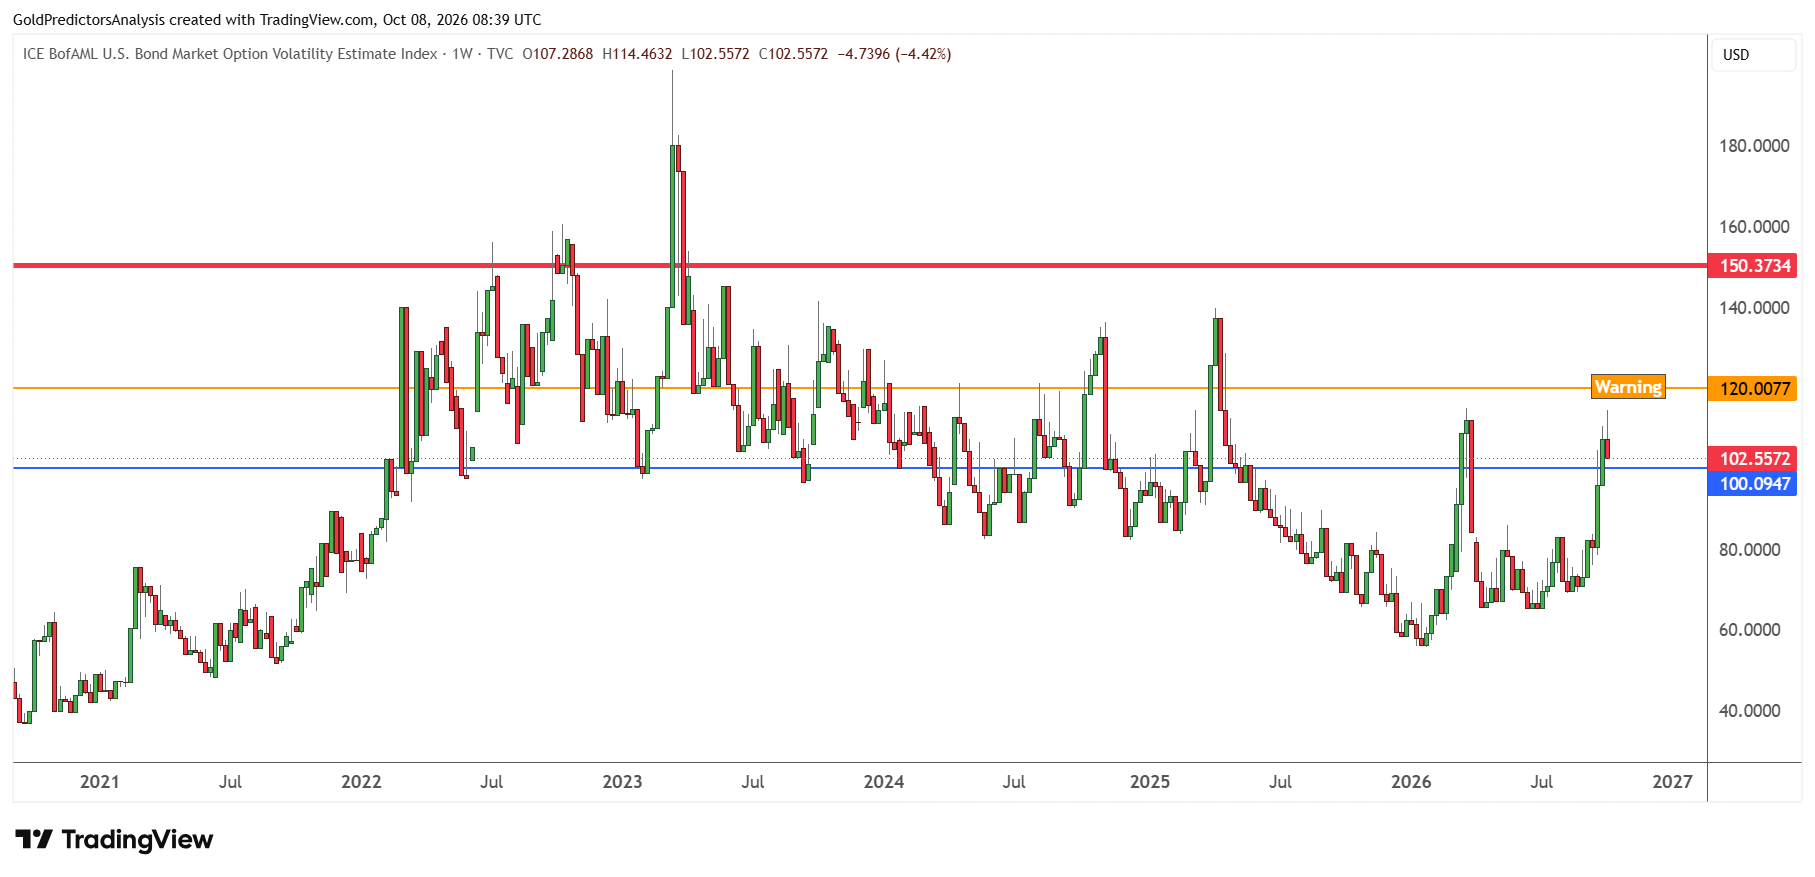
Under this risk scenario, a further increase in the 10-year Treasury yield toward 5.5% could tighten financial conditions and place additional pressure on stocks. The high real yields could weigh on bullion, while stronger demand for protection against financial instability could support it.
The bullion buying by the central banks provides a counterweight to these pressures. China increased its gold reserves for the 23rd consecutive month in September. The holdings increased to 77.47 million ounces from 76.73 million in August. This continued accumulation supports the broader demand outlook. However, this does not prevent the selling of gold in the short term. A more durable recovery in gold would become more likely if real yields and the dollar correct while central bank demand remained firm.
Gold Price Forecast: $4,000 Support at Risk
The outlook for spot gold has remained bearish in the short term over the past few days. The price is compressing within the triangle pattern that stretches from the January 2026 highs. The price remains below the 50- and 200-day SMAs and immediate support remains at the $4,000 area. This support area is defined by the triangle pattern.
A break below $4,000 will likely push prices towards the $3,800 region. The support of $3,800 is indicated by the descending trend line that stretches from the October 2025 highs. This correction will likely present a strong buying opportunity for investors to target the $4,500 region.
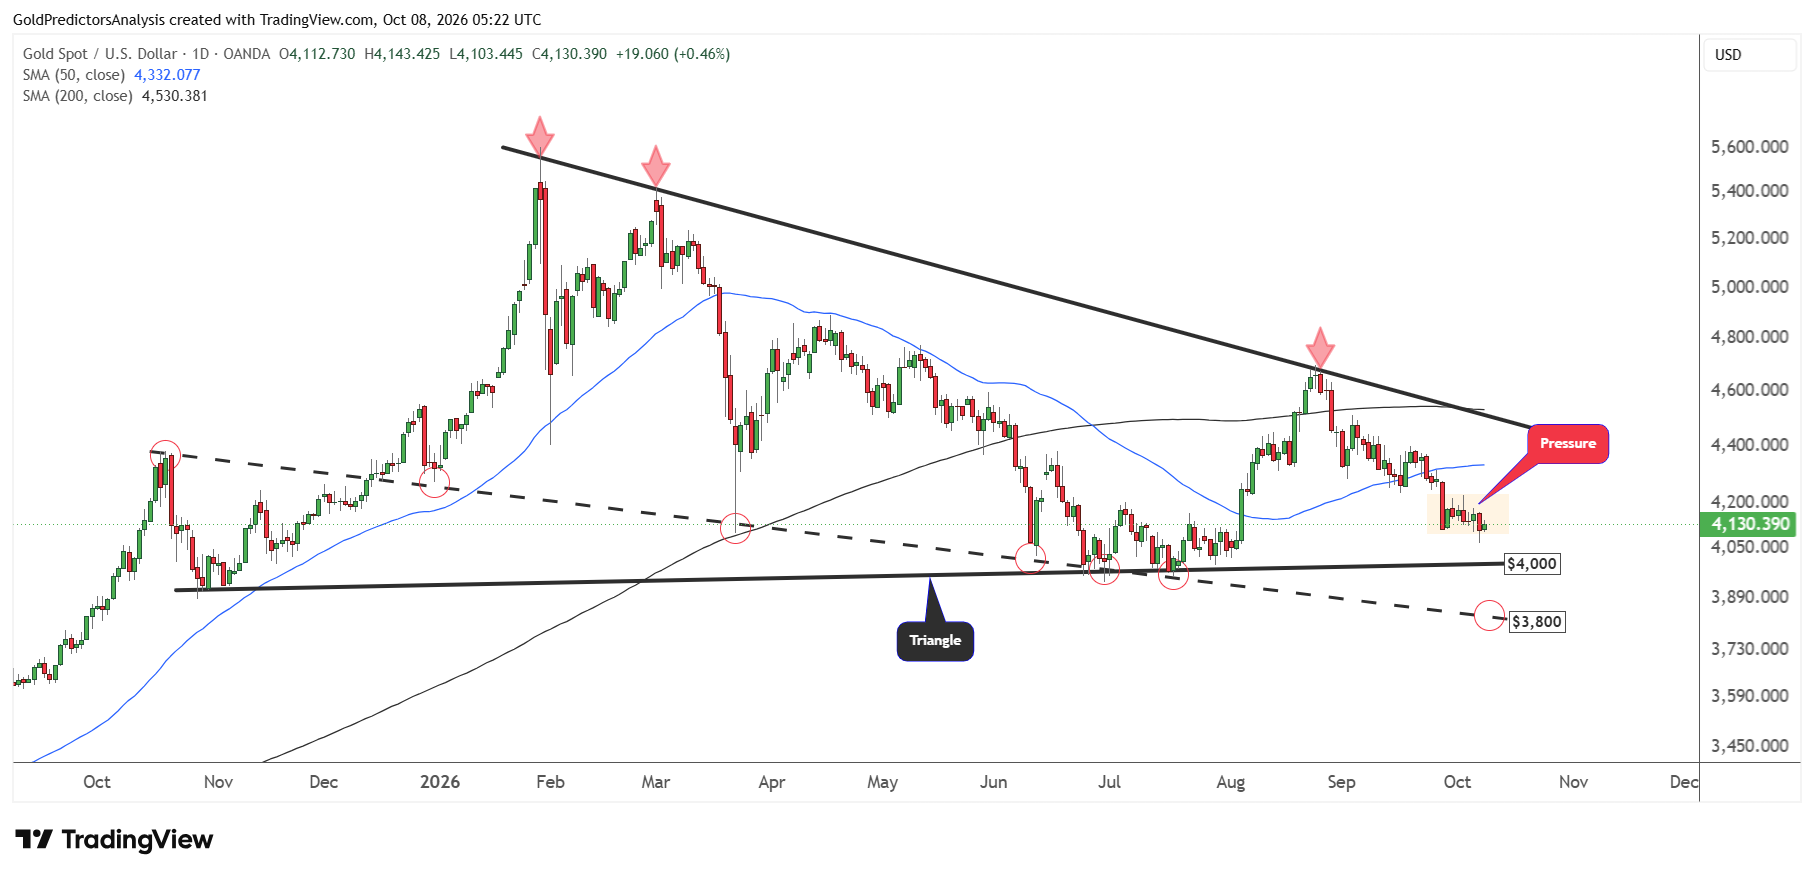
However, if prices fail to break below $4,000 and then break above $4,330, this will likely push prices towards the 200-day SMA at $4,530. As long as the price remains below $4,530, the possibility of further downside in the gold market remains high.
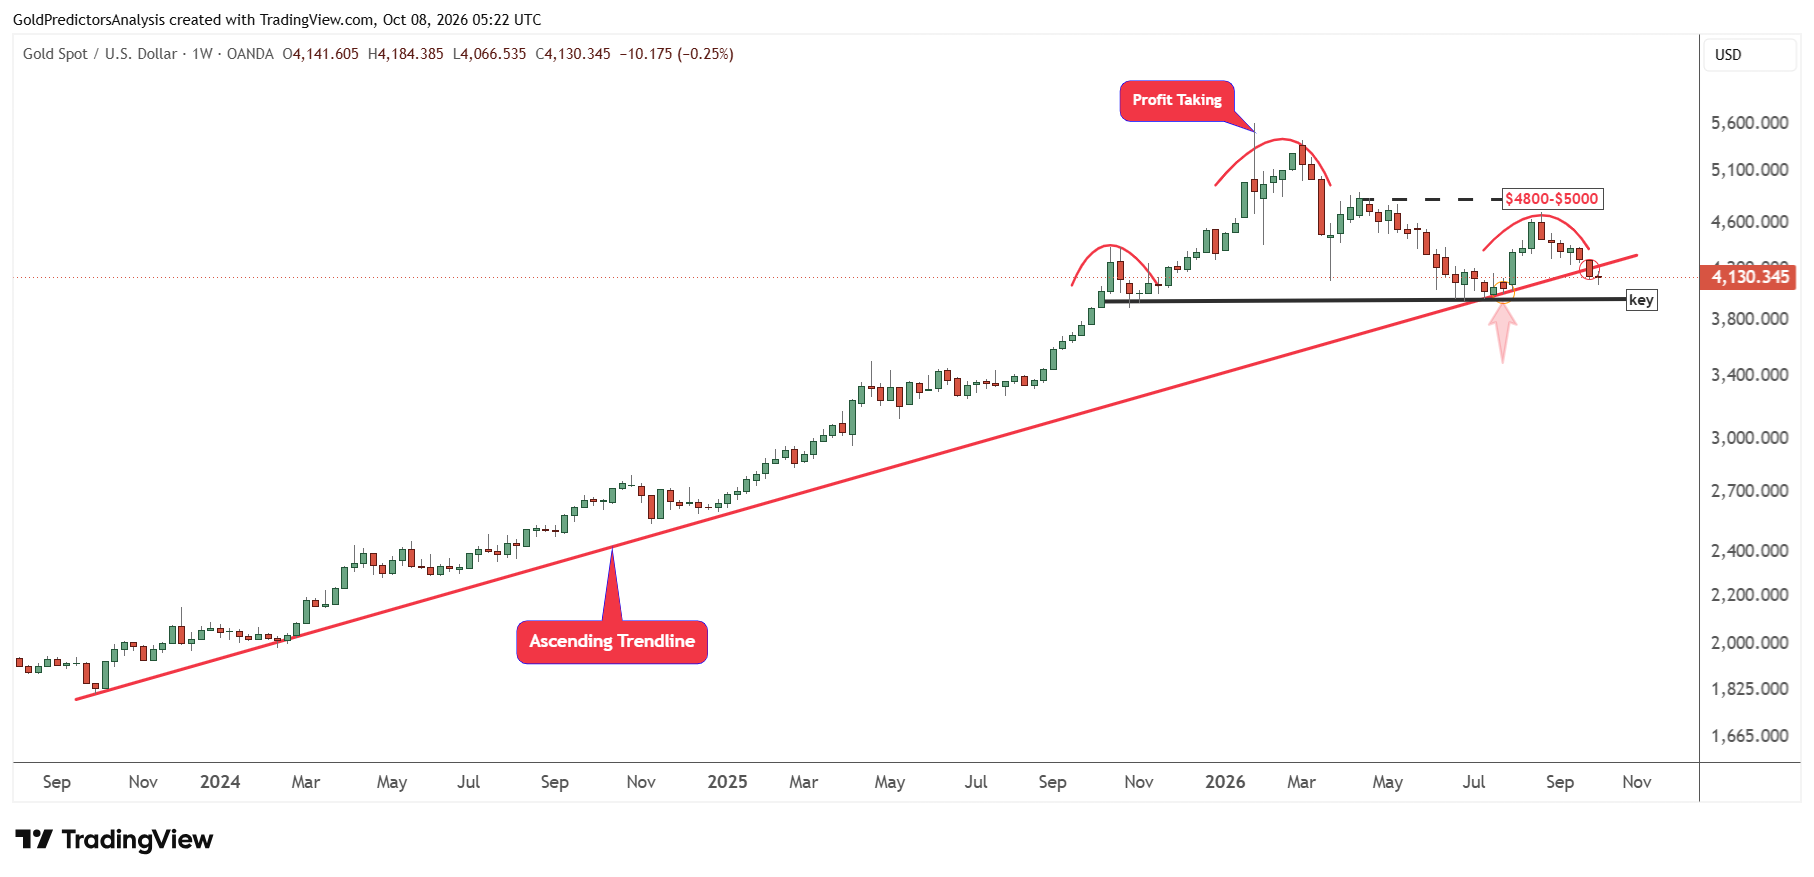
The weekly chart for spot gold also shows that prices closed below the ascending trend line that stretches from the October 2023 lows. However, prices must close below $4,200 this week to confirm this breakout and open the way for a drop towards the $4,000 area.
The chart shows that the $4,000 region remains the key level. A break below this level will likely confirm the head and shoulders formation and push prices to lower levels.
Gold-to-Silver Ratio Rebounds Toward 73 Resistance
The negative price action in the gold market in the short term is further supported by the price action in the gold-to-silver ratio. The weekly chart for the gold-to-silver ratio shows that the ratio is rebounding from support at 64.
The positive behaviour in the gold-to-silver ratio suggests negative price action in the gold and silver (XAG) markets. This is because precious metals bottom when the ratio produces a peak.
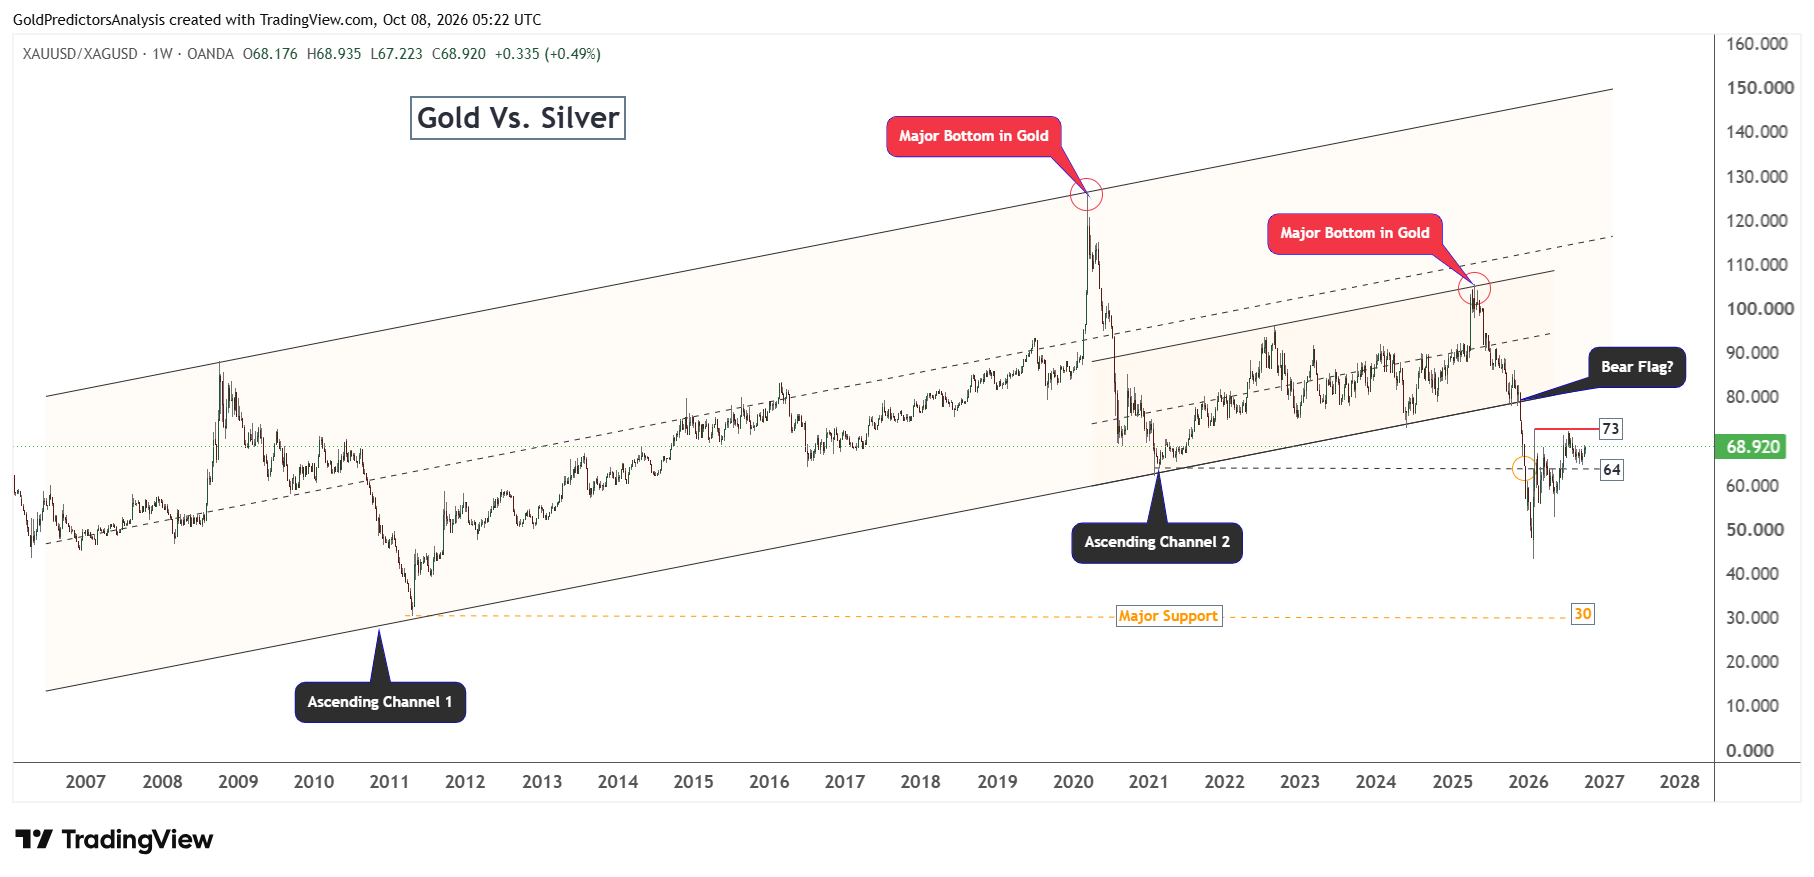
The ratio is now moving towards resistance at the 73 level. A break above the 73 level will indicate further downside in gold and silver prices. However, if the ratio breaks below the 64 level, it will increase the possibility of a bottom in gold and initiate a rebound in precious metals.
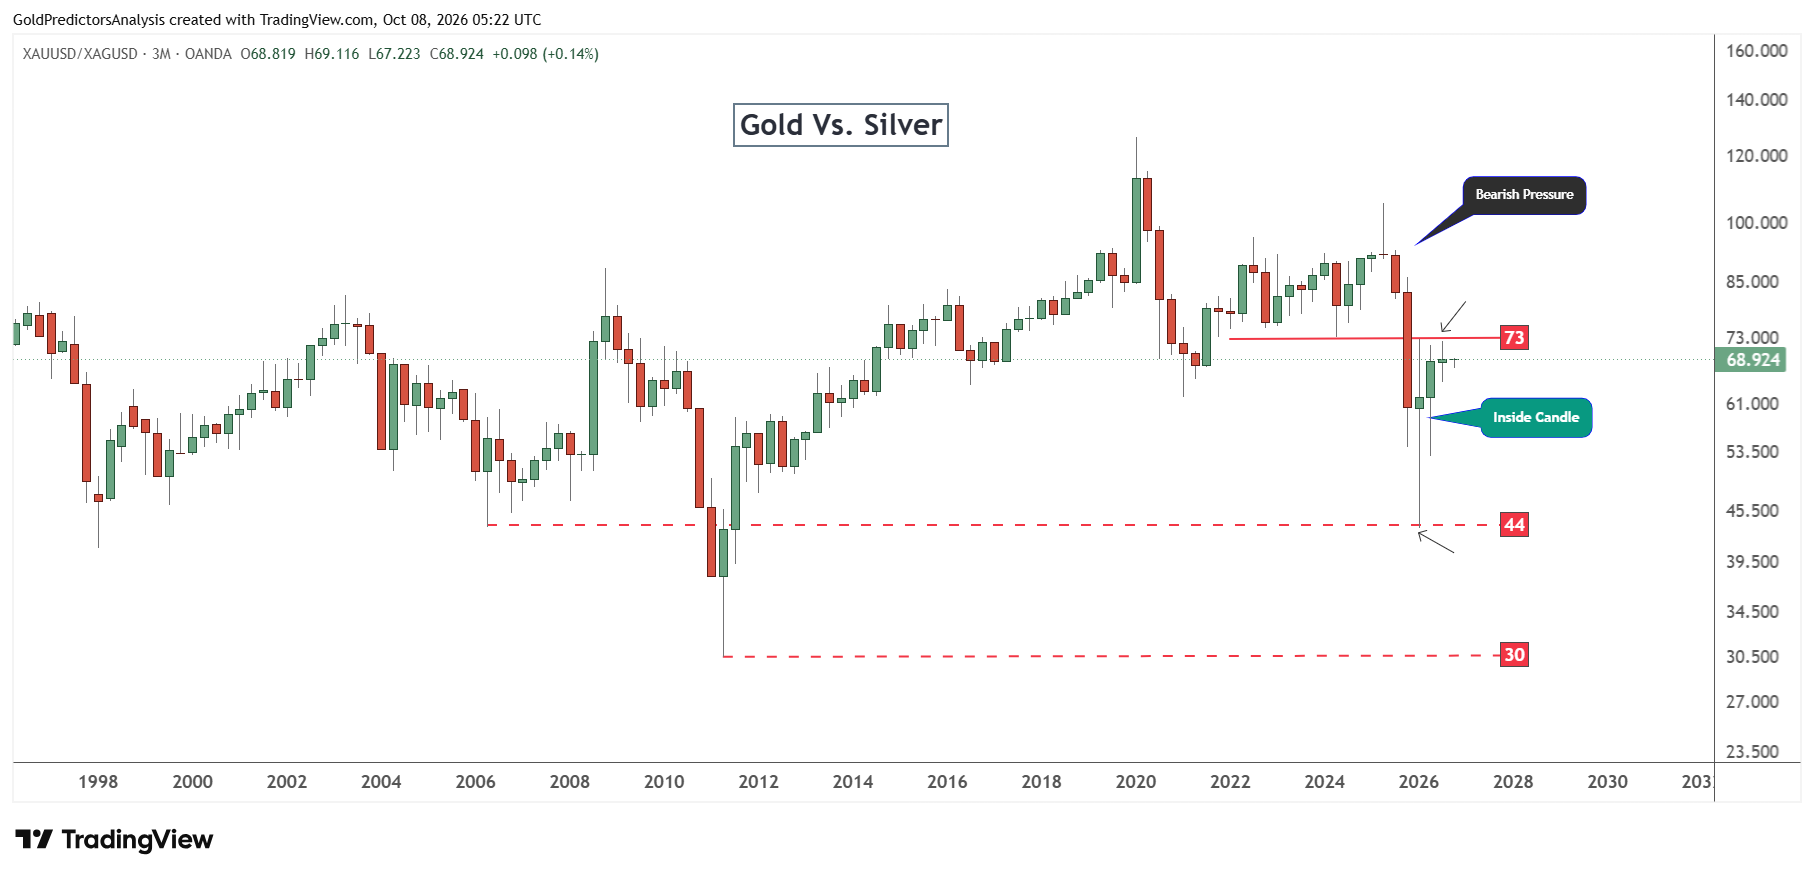
The next peak in the gold-to-silver ratio will likely produce a bottom in the gold market. The quarterly outlook for the gold-to-silver ratio also shows that the ratio formed an inside candle in Q2 2026. But it failed to break above the 73 level in Q3.
Now, the ratio is again rebounding in Q4 2025. If the ratio breaks above the 73 level, it will likely indicate that gold and silver prices have some more room to drop before marking a low. On the other hand, if the ratio confirms a top and continues to drop towards the 44 area, it will likely initiate another strong rally in gold and silver prices.
What to Watch Next
Gold remains under pressure as high real yields make bonds more attractive and the strong dollar limits the recovery. The FOMC minutes keep a December rate hike in focus. The high cost of energy could sustain inflation and strengthen the case for further tightening. The buying in the central bank offers support, but it may not offset these pressures in the short term. A softer dollar and lower real yields would give gold more room to recover.
The support level of $4,000 remains critical. A weekly close below $4,200 would increase the risk of a test of this support. A break below $4,000 could open the way towards $3,800. But a break above $4,330 would bring the $4,530 resistance into view. The ratio of gold to silver provides another signal to watch. A break above 73 in the ratio would strengthen the downside warning, while a drop below 64 would support the case for a recovery in precious metals.
Read more: High Yields Raise the Risk of a Deeper Correction in Gold