



Gold has pulled back from its January 2026 peak near $5,600, prompting a growing number of analysts to argue that the precious metal has already formed a major long-term top. This assessment is understandable. The recent high coincided with a significant resistance line on the long-term Gold-to-S&P 500 ratio chart – one that also capped the major peaks in January 1980 and September 2011.
Both of those episodes were followed by prolonged periods of underperformance for gold relative to equities. After the 1980 peak, gold declined 72% over the next 19 years. Following the 2011 high, the metal fell 45% during the subsequent five years.
On the surface, the similarities may appear compelling. But focusing solely on the price of gold ignores a crucial ingredient in the equation. The Gold-to-S&P 500 ratio is exactly that – a relative valuation measure. Understanding where the ratio may head next requires analysing both sides of the trade rather than gold in isolation.
Looking Beyond Gold
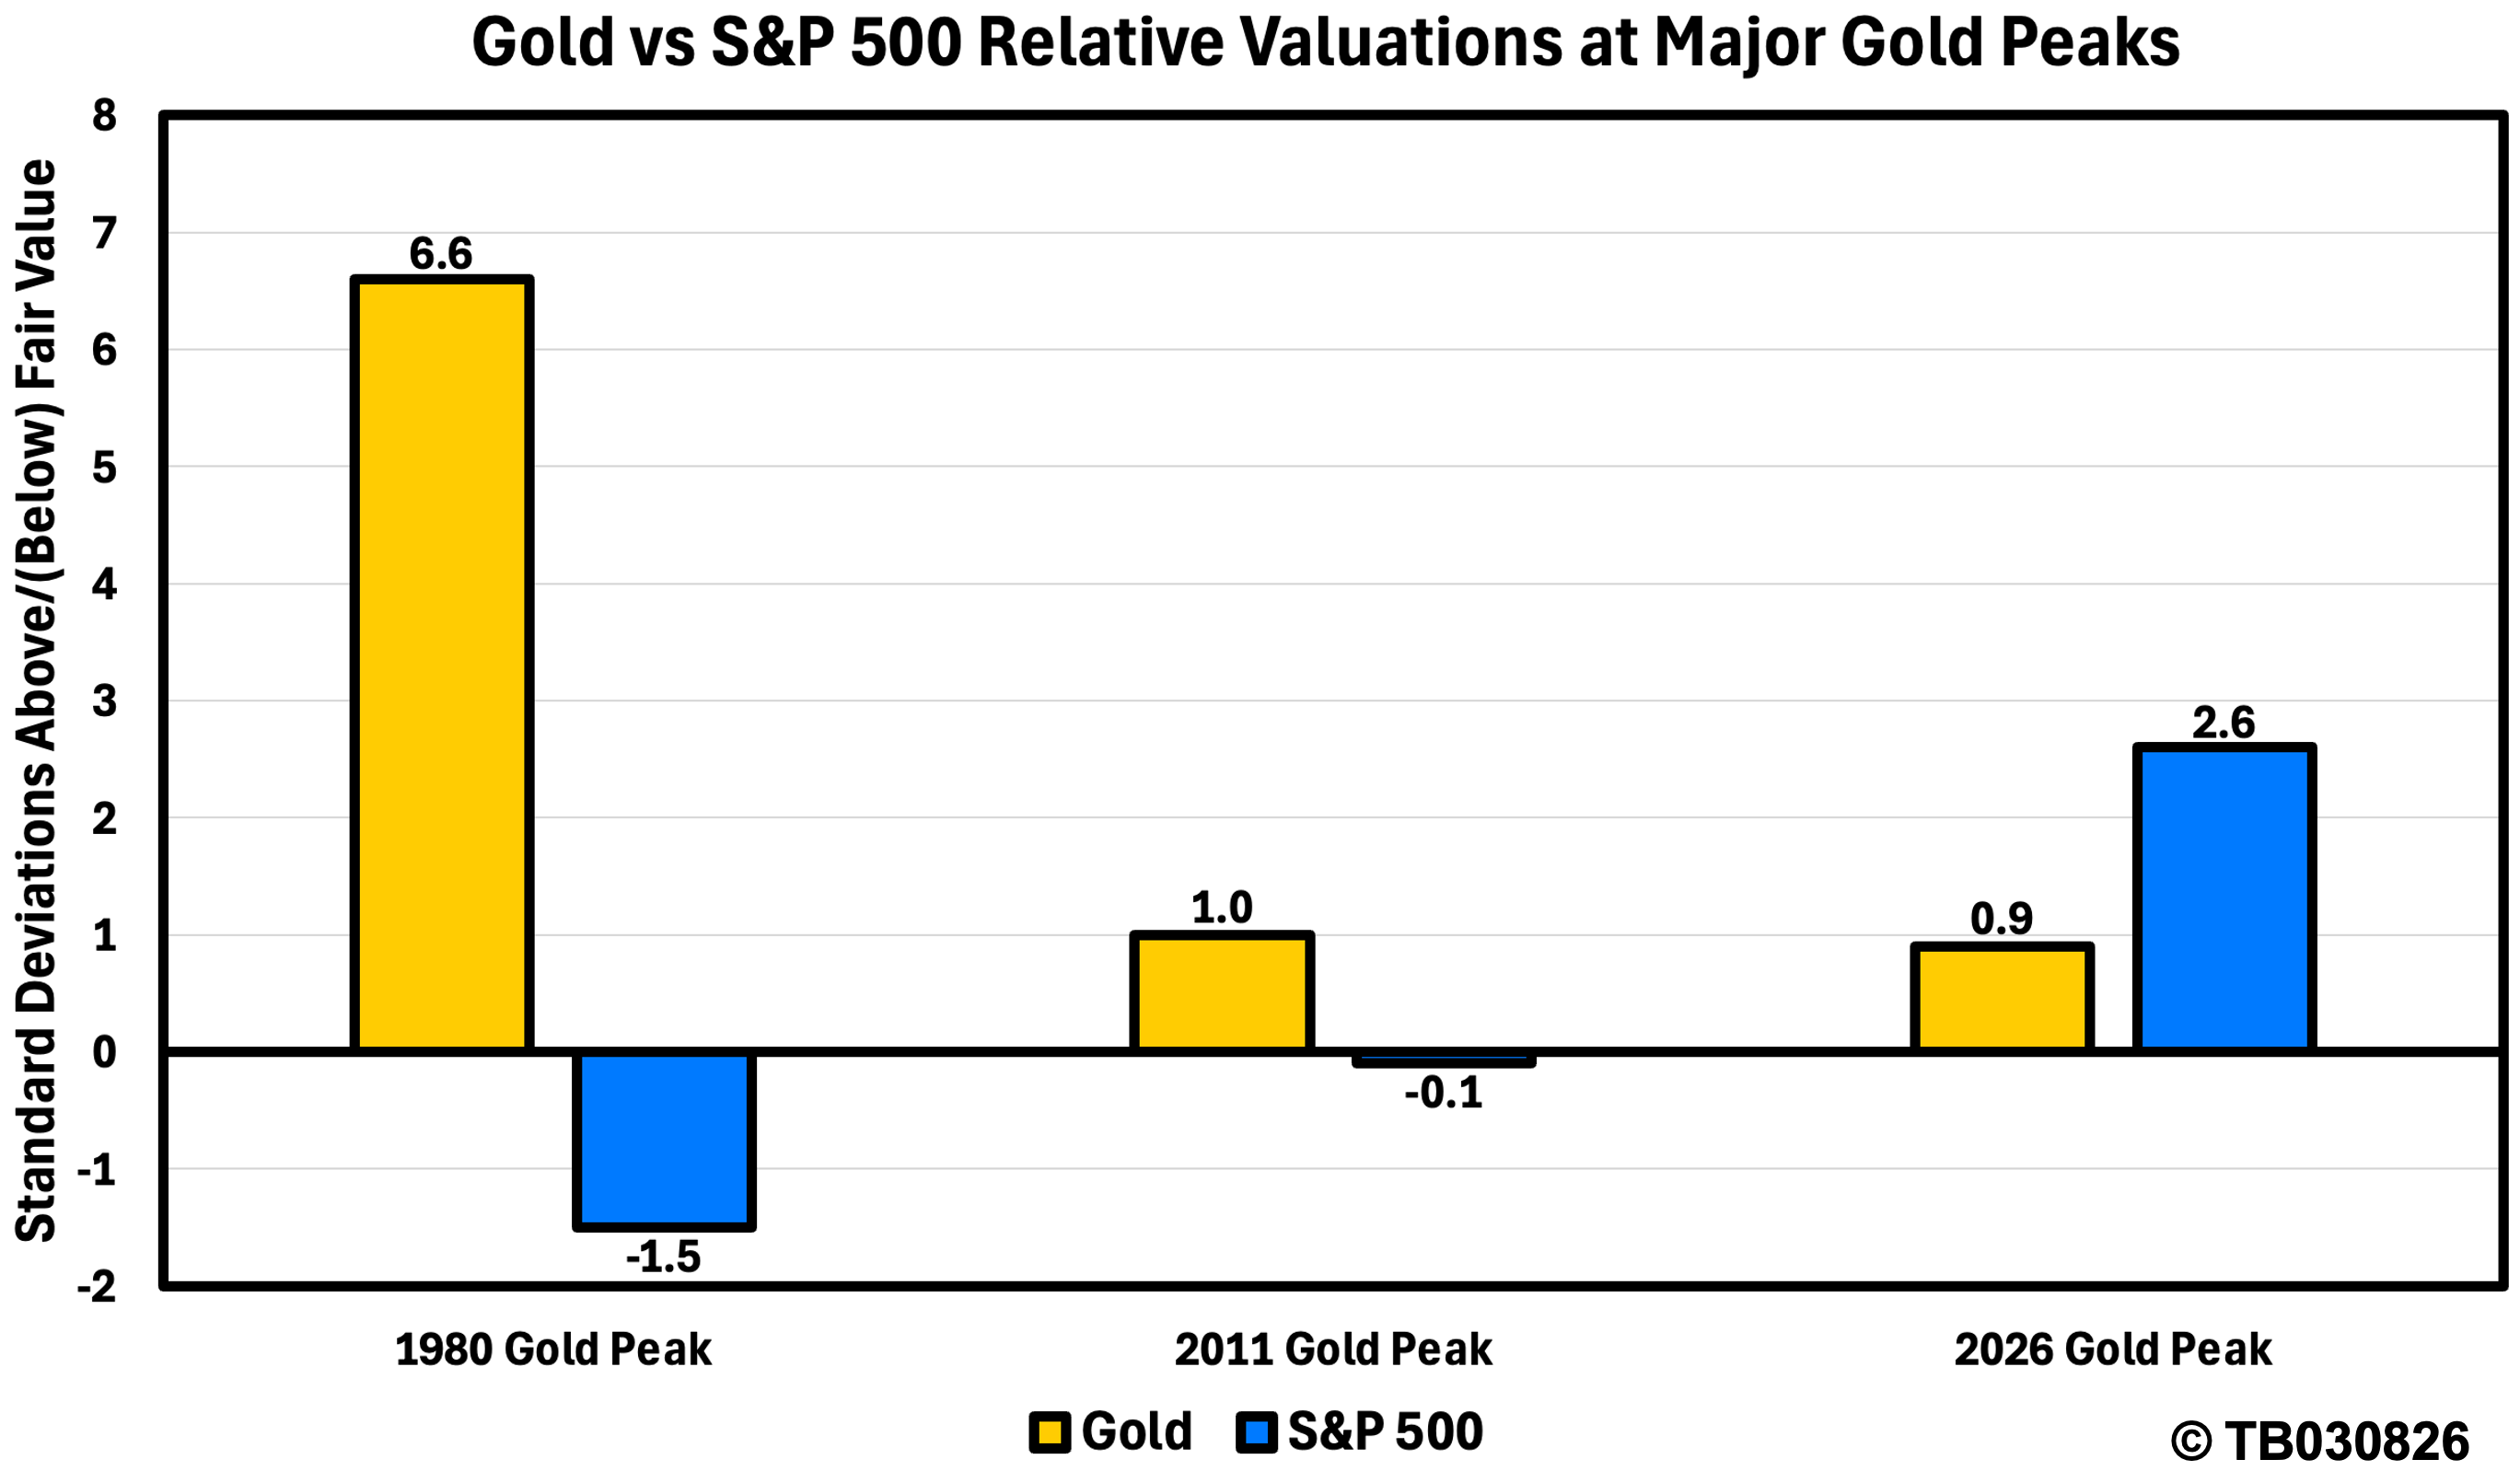
The major difference between today’s market and previous cycle peaks lies not in gold itself, but in the valuation of the U.S. equity market. At the January 1980 gold peak, my long-term valuation model suggested gold was trading 6.6 standard deviations ABOVE fair value, while the S&P 500 was 1.5 standard deviations BELOW fair value.
In other words, investors were rotating out of one of the most overvalued assets in history into one of the cheapest. That relative valuation gap proved decisive. Over the following two decades, the Gold-to-S&P 500 ratio collapsed by 98%, driven not only by weaker gold prices but also by one of the strongest equity bull markets on record.
A similar story unfolded in 2011. When gold reached its all-time high in September 2011, it was 1 standard deviation ABOVE fair value, while the S&P 500 remained 0.1 standard deviations BELOW fair value. Although the gap was far smaller than in 1980, equities were still cheaper than gold. Once again, capital gradually rotated back into stocks, causing the Gold-to-S&P 500 ratio to fall 78% over the following decade.
Why 2026 Is Different
Gold Price Forecast
Every new Gold analysis as it publishes, today's technical signal and key levels, live price — on one page.
See all Gold forecastsToday’s market presents a completely different valuation backdrop. At gold’s January 2026 high, my valuation model placed the metal 0.9 standard deviations above fair value. That alone might appear comparable to previous cycle peaks. The difference is where equities sat. Rather than being undervalued, the S&P 500 stood 2.6 standard deviations above fair value, placing it among the most expensive equity markets ever recorded. This dramatically changes the relative valuation picture.
Comparing the two assets highlights the contrast:
- 1980: The S&P 500 was 8.1 standard deviations cheaper than gold.
- 2011: The S&P 500 was 1.1 standard deviations cheaper than gold.
- 2026: The S&P 500 was 1.7 standard deviations more expensive than gold.
That distinction is difficult to ignore. Previous secular peaks in gold occurred when investors had an attractive alternative in undervalued equities. Today, investors face a market where both assets appear expensive on an absolute basis, but equities remain considerably more exorbitant than gold. From a relative valuation perspective, the current environment looks fundamentally different from either 1980 or 2011.
Relative Valuation Drives Relative Performance
Investors often assume that because gold reached a familiar resistance level, history must repeat itself. Technical analysis is valuable, but long-term market cycles are rarely driven by price patterns alone. Valuation plays a central role. Historically, major declines in the Gold-to-S&P 500 ratio occurred when three conditions aligned:
- Gold was expensive.
- The S&P 500 was cheap.
- Equities offered substantially better long-term gains than precious metals.
Only the first condition exists today. While gold is modestly above fair value, U.S. equities remain significantly more costly according to long-term valuation measures. Unless equity valuations normalise through either a prolonged period of underperformance or a major market correction, it becomes difficult to build the same bearish case for gold that existed during previous cycle peaks.
A Multi-Decade Bullish Pattern
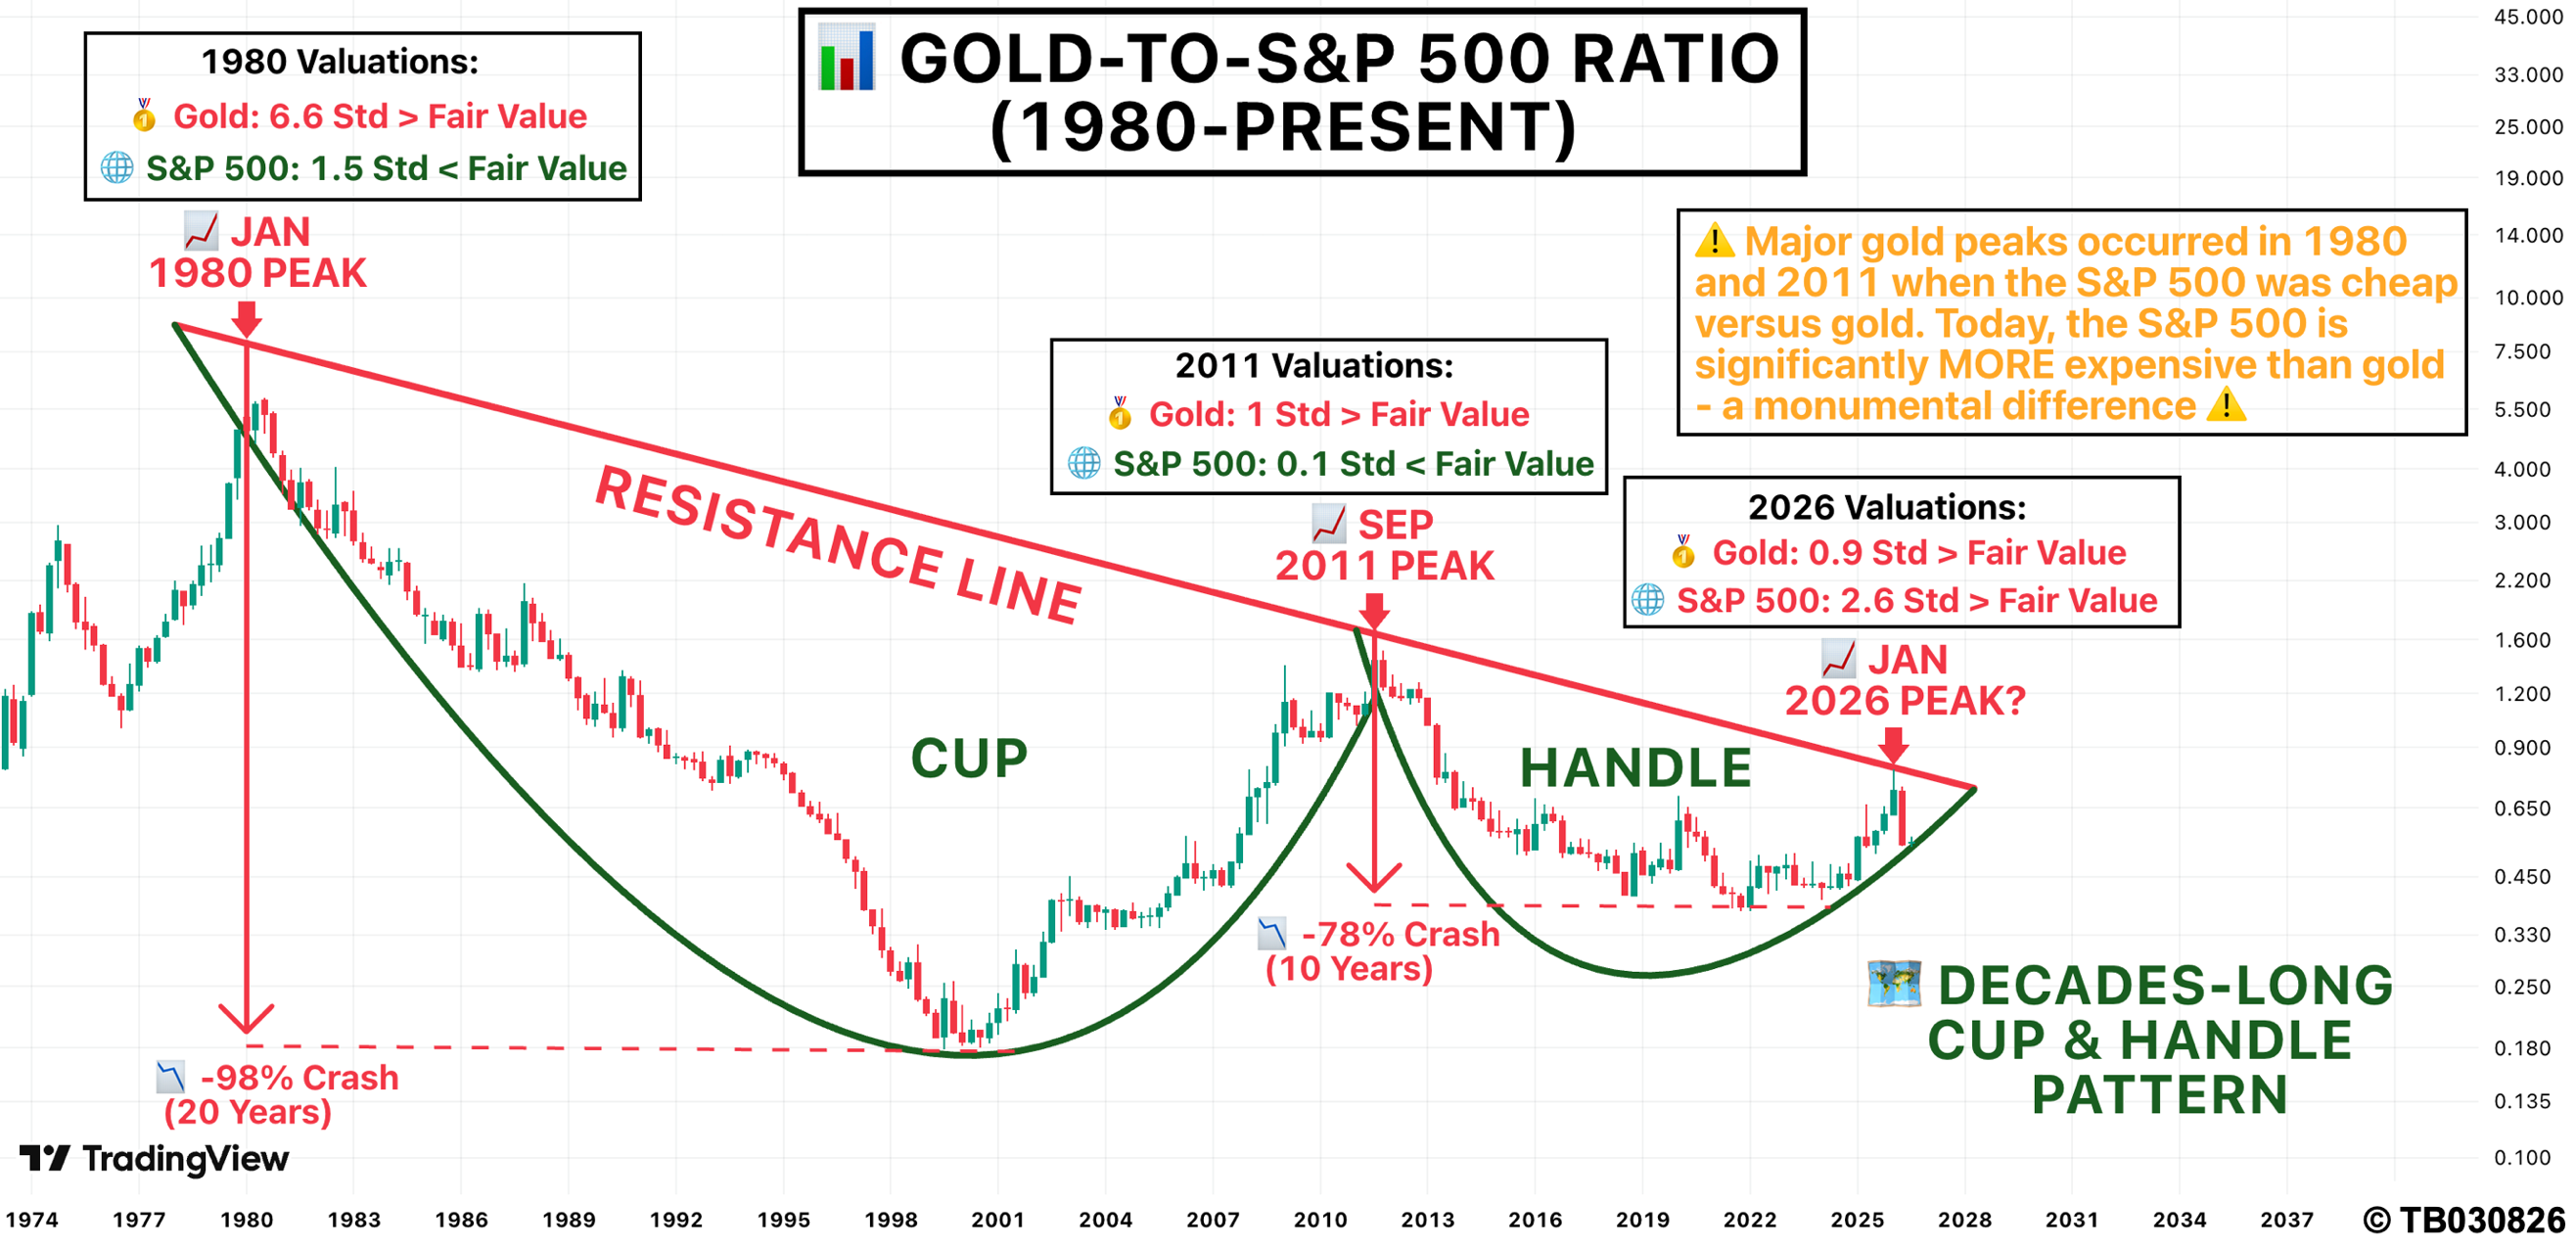
The long-term Gold-to-S&P 500 ratio chart may also be signalling something even more significant. Rather than completing another cyclical peak, the ratio appears to be forming a massive multi-decade cup-and-handle pattern stretching back to the early 1980s. If confirmed, a decisive breakout above the long-term resistance line would carry significant technical implications.
The traditional measured-move target from the pattern projects a Gold-to-S&P 500 ratio of 3.6. For context, the ratio currently sits at 0.54. That implies the potential for 6.5x outperformance by gold relative to U.S. equities over the coming years.
Whether that outperformance is driven primarily by rising gold prices, falling equity prices, or a combination of both remains uncertain. However, the technical structure aligns closely with the valuation backdrop currently developing.
What Could This Mean For Investors?
My longer-term valuation studies continue to suggest gold could reach $9,250 by 2028. If achieved, and assuming equity valuations simultaneously mean revert toward historical norms, the implications for the broader market could be significant.
Under that scenario:
- Gold could rise 130% from current levels.
- The S&P 500 could decline to 2,550 points, representing a fall of 66%.
These figures should not be interpreted as precise forecasts. Markets rarely move in straight lines, and countless macroeconomic variables will influence the eventual outcome. The more important takeaway is the underlying relationship.
Investors drawing direct comparisons with 1980 or 2011 risk overlooking the single biggest difference between those periods and today. Back then, gold was expensive while equities were cheap. Today, gold appears only moderately expensive, while U.S. equities remain among the most richly valued markets in modern history.
Until that relationship changes, the long-term case for continued gold outperformance remains considerably stronger than many headlines suggest.
Positioning For A Potential Gold Bull Market
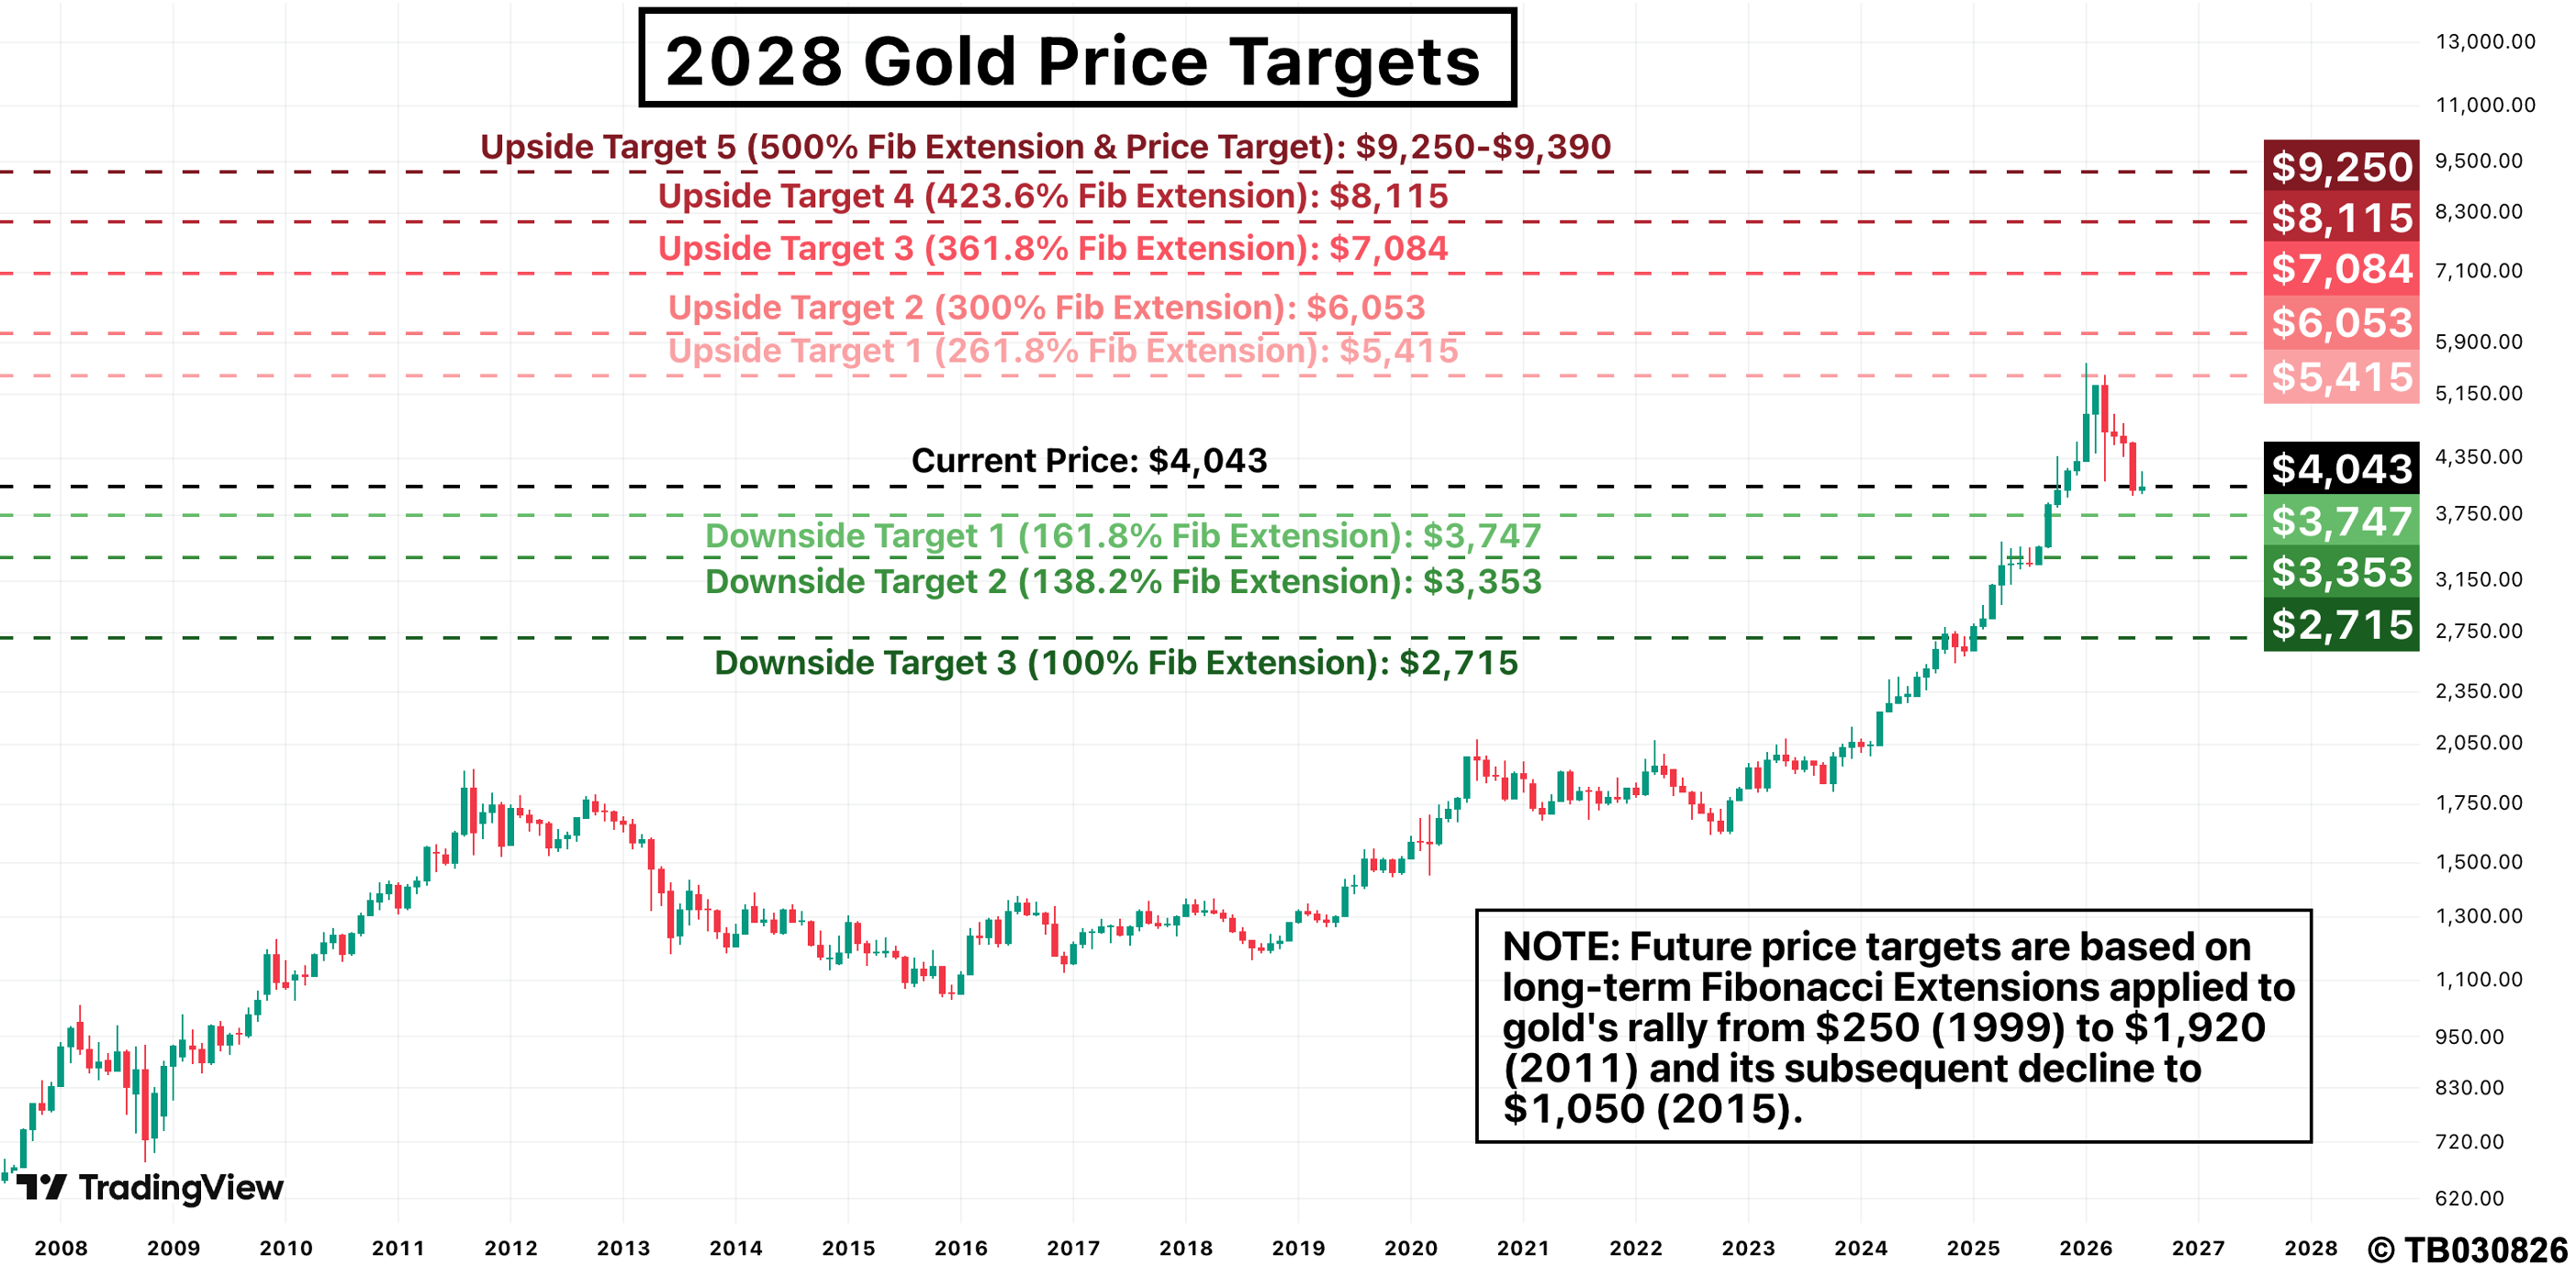
If my longer-term outlook proves correct, simply buying and holding at today’s prices may not be the most efficient approach. Instead, I will be looking to scale into gold on weakness while progressively taking profits as prices move closer to my long-term $9,250 target. With gold currently trading at $4,043, here is my strategy:
- Current ($4,043): Holding 25% of the intended position.
- $3,747: Buying one-third of the remaining allocation.
- $3,353: Buying one-half of the remaining allocation.
- $2,715: Completing the remaining allocation.
Scaling into weakness allows investors to build exposure while reducing the risk of committing too much capital at elevated prices. If all downside targets were reached, the average purchase price would fall to $3,465, 17% below today’s price.
As prices recover, I would be looking to reverse the process by taking profits progressively rather than attempting to identify the exact market top:
- $5,415: Selling 20% of holdings.
- $6,053: Selling 25% of the remaining position.
- $7,084: Selling one-third of the remaining position.
- $8,115: Selling one-half of the remaining position.
- $9,250: Exiting the remaining position.
If those levels were achieved, my average selling price would be $7,183. Combined with the average purchase price of $3,465, that would represent a gain of 107%, equivalent to annualised returns of 44% over two years if gold reached my target by mid-2028.
Positioning For A Potential S&P 500 Bear Market
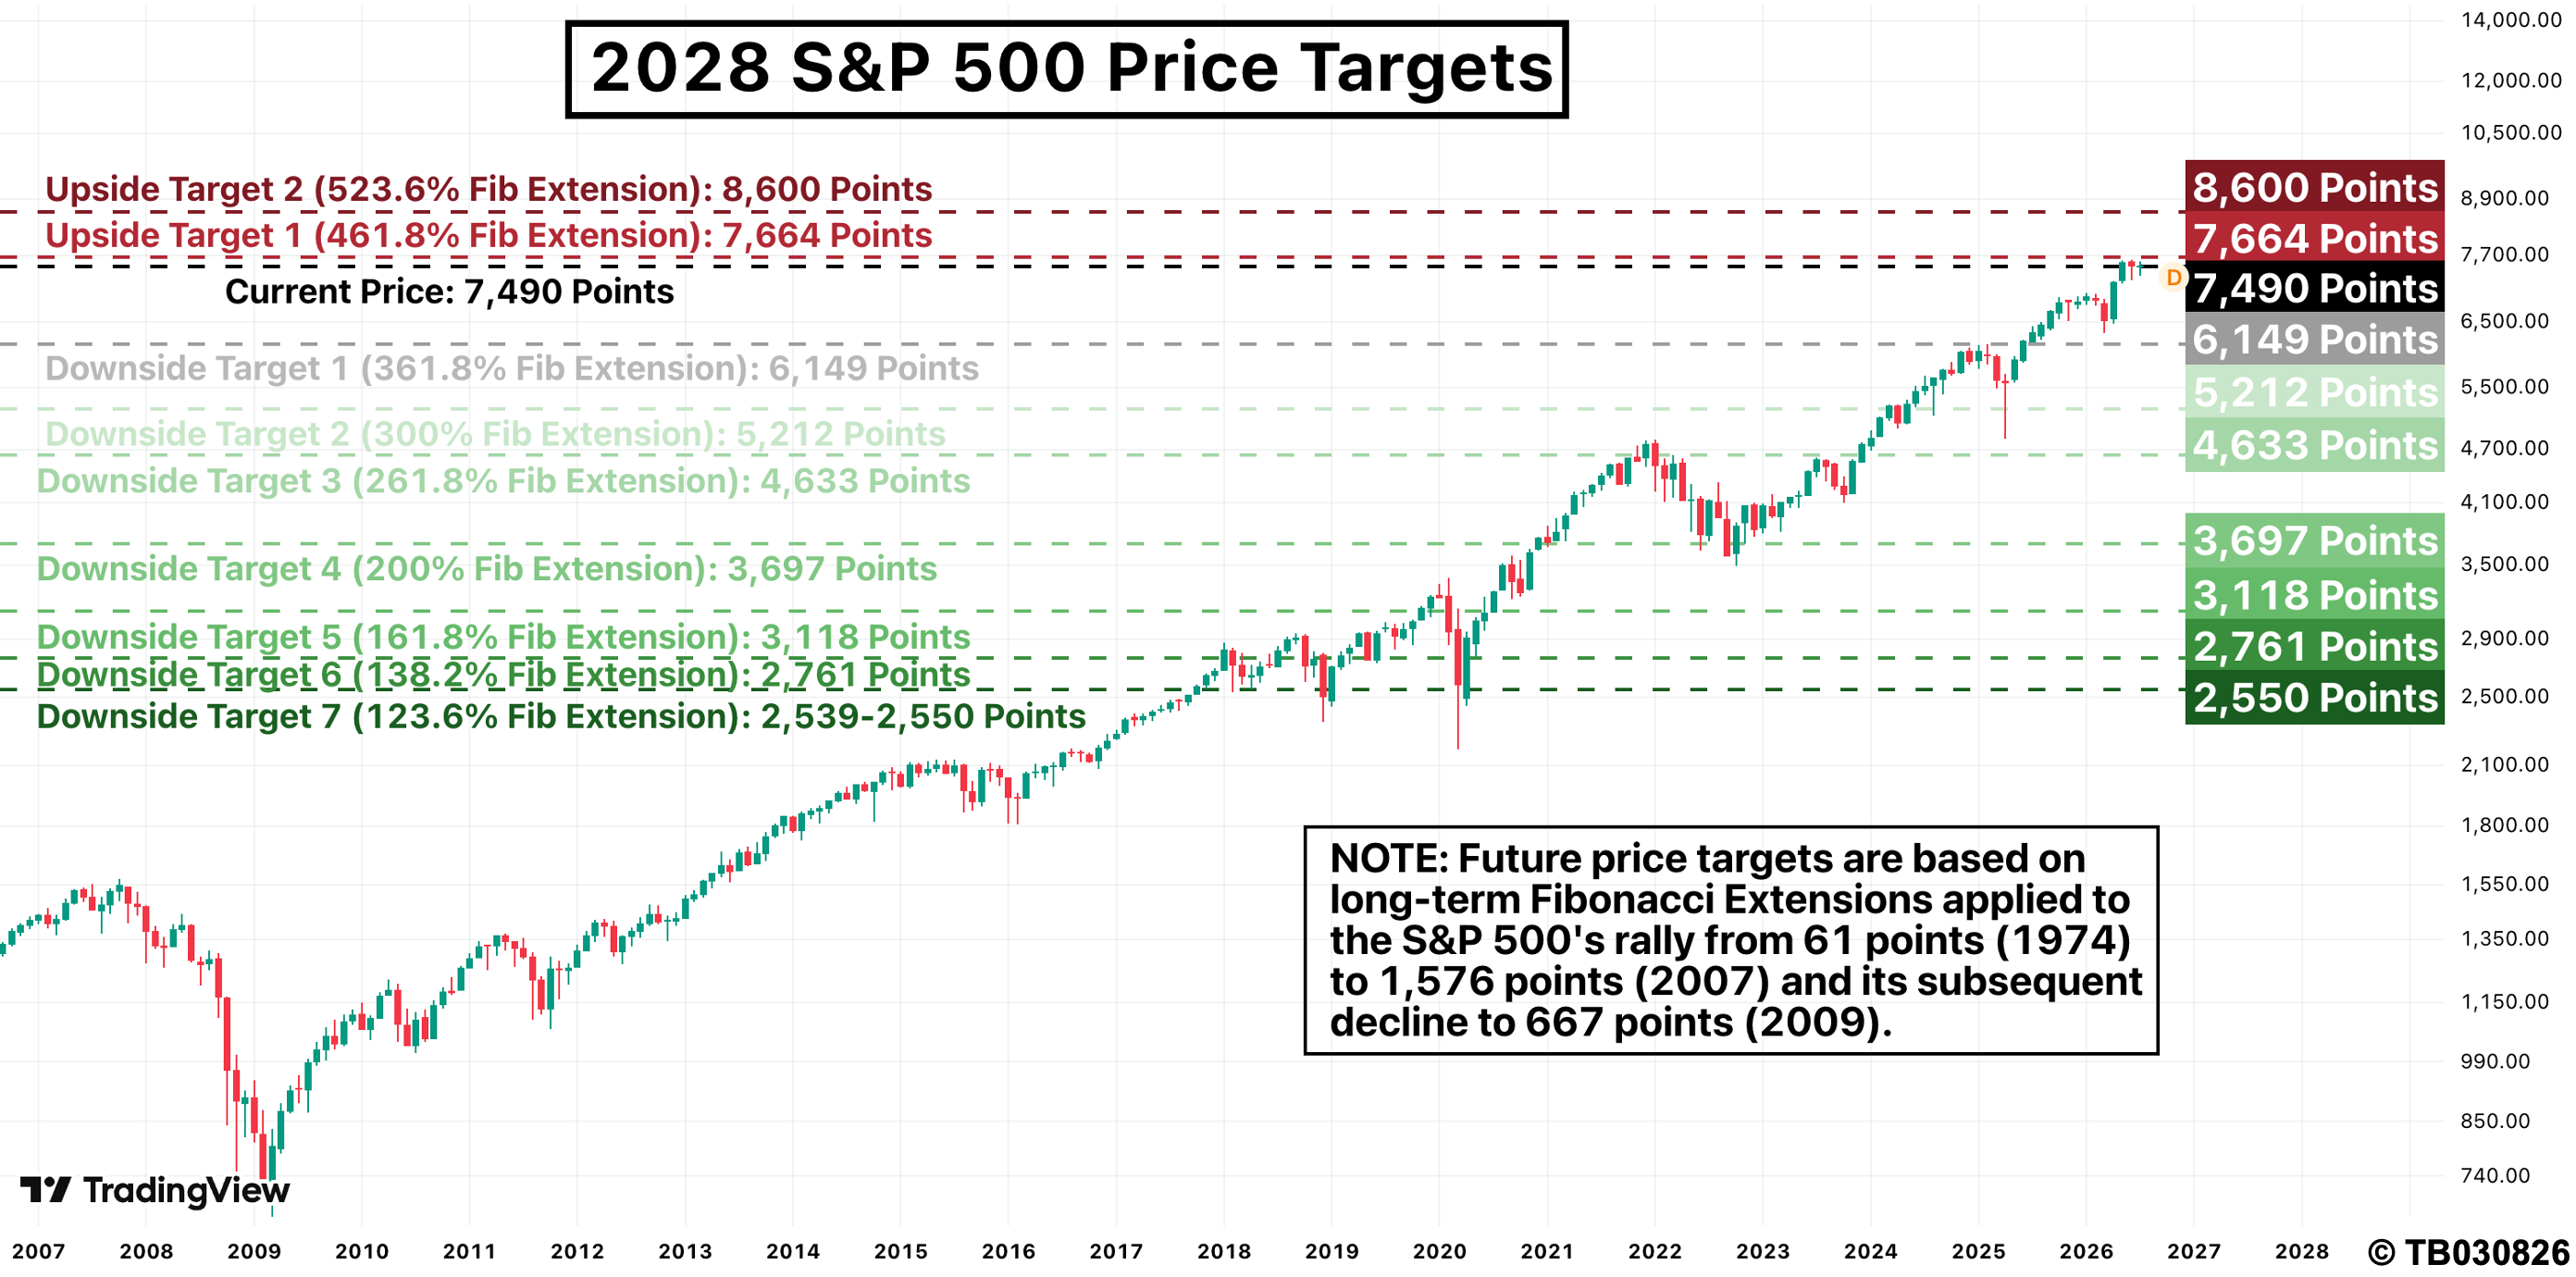
The same disciplined approach applies to U.S. equities. Rather than attempting to call the exact top, I would gradually reduce existing S&P 500 exposure as prices advance while preparing to establish short exposure if the market confirms a major trend reversal. My upside roadmap would be:
- 7,664 points: Selling half of the remaining long exposure.
- 8,600 points: Exiting the remaining long position.
Should both upside targets be achieved, the average exit price would be 8,132 points, representing a gain of 9% from current levels. However, I would abandon the bullish positioning if the S&P 500 broke below 7,085 points, limiting downside risk to 5% and producing a 2:1 reward-to-risk ratio. A confirmed break below 7,085 points would instead trigger a gradual short-selling strategy, with profits taken progressively into further weakness:
- 6,149 points: Covering one-seventh of the short position.
- 5,212 points: Covering one-sixth.
- 4,633 points: Covering one-fifth.
- 3,697 points: Covering one-quarter.
- 3,118 points: Covering one-third.
- 2,761 points: Covering one-half.
- 2,550 points: Covering the remaining position.
Rather than attempting to buy back the entire short position at the ultimate low, scaling out allows profits to be locked in while reducing exposure to the powerful counter-trend rallies that often occur during bear markets. Assuming an average short-covering level of 4,017 points after initiating the position below 7,085 points, the trade would generate a gain of 43%, equivalent to annualised returns of 20% over two years if the S&P 500 reached my 2,550 point target by mid-2028.
Final Thoughts
The key message is that today’s valuation backdrop differs fundamentally from the environments that preceded the major gold peaks of 1980 and 2011. In both previous episodes, investors rotated from expensive gold into cheaper equities. Today, both assets appear expensive on an absolute basis, but U.S. equities remain substantially more overvalued than gold. Until that relative valuation gap closes, the long-term case for continued gold outperformance remains intact.
Ultimately, the objective should not be to predict every short-term swing, but to implement a disciplined plan that gradually accumulates exposure during corrections, systematically locks in profits during advances, and manages risk throughout the cycle. If my longer-term targets ultimately prove correct, such an approach offers the potential to capture a significant portion of both the precious metals bull market and a possible secular decline in U.S. equities.