


Since January, gold has suffered one of its most violent reversals in years. At one point, the precious metal had lost $8 trillion of market value – equivalent to wiping out the entire Japanese stock market. It also suffered its worst quarterly performance relative to the S&P 500 in more than four decades, at one point lagging U.S. equities by around 30%. And all of this happened as a major Middle East war escalated. The irony was hard to miss. The asset supposedly designed to protect against geopolitical chaos had become one of its biggest casualties. But gold has now staged a powerful rebound. On 21st August, gold surged to $4,600, its highest level in more than three months, after gaining more than 5% during the week. So perhaps the more interesting question isn’t: Why is gold falling? It is: Was the sell-off simply a rope-a-dope trick?
Gold Isn’t Really About Gold
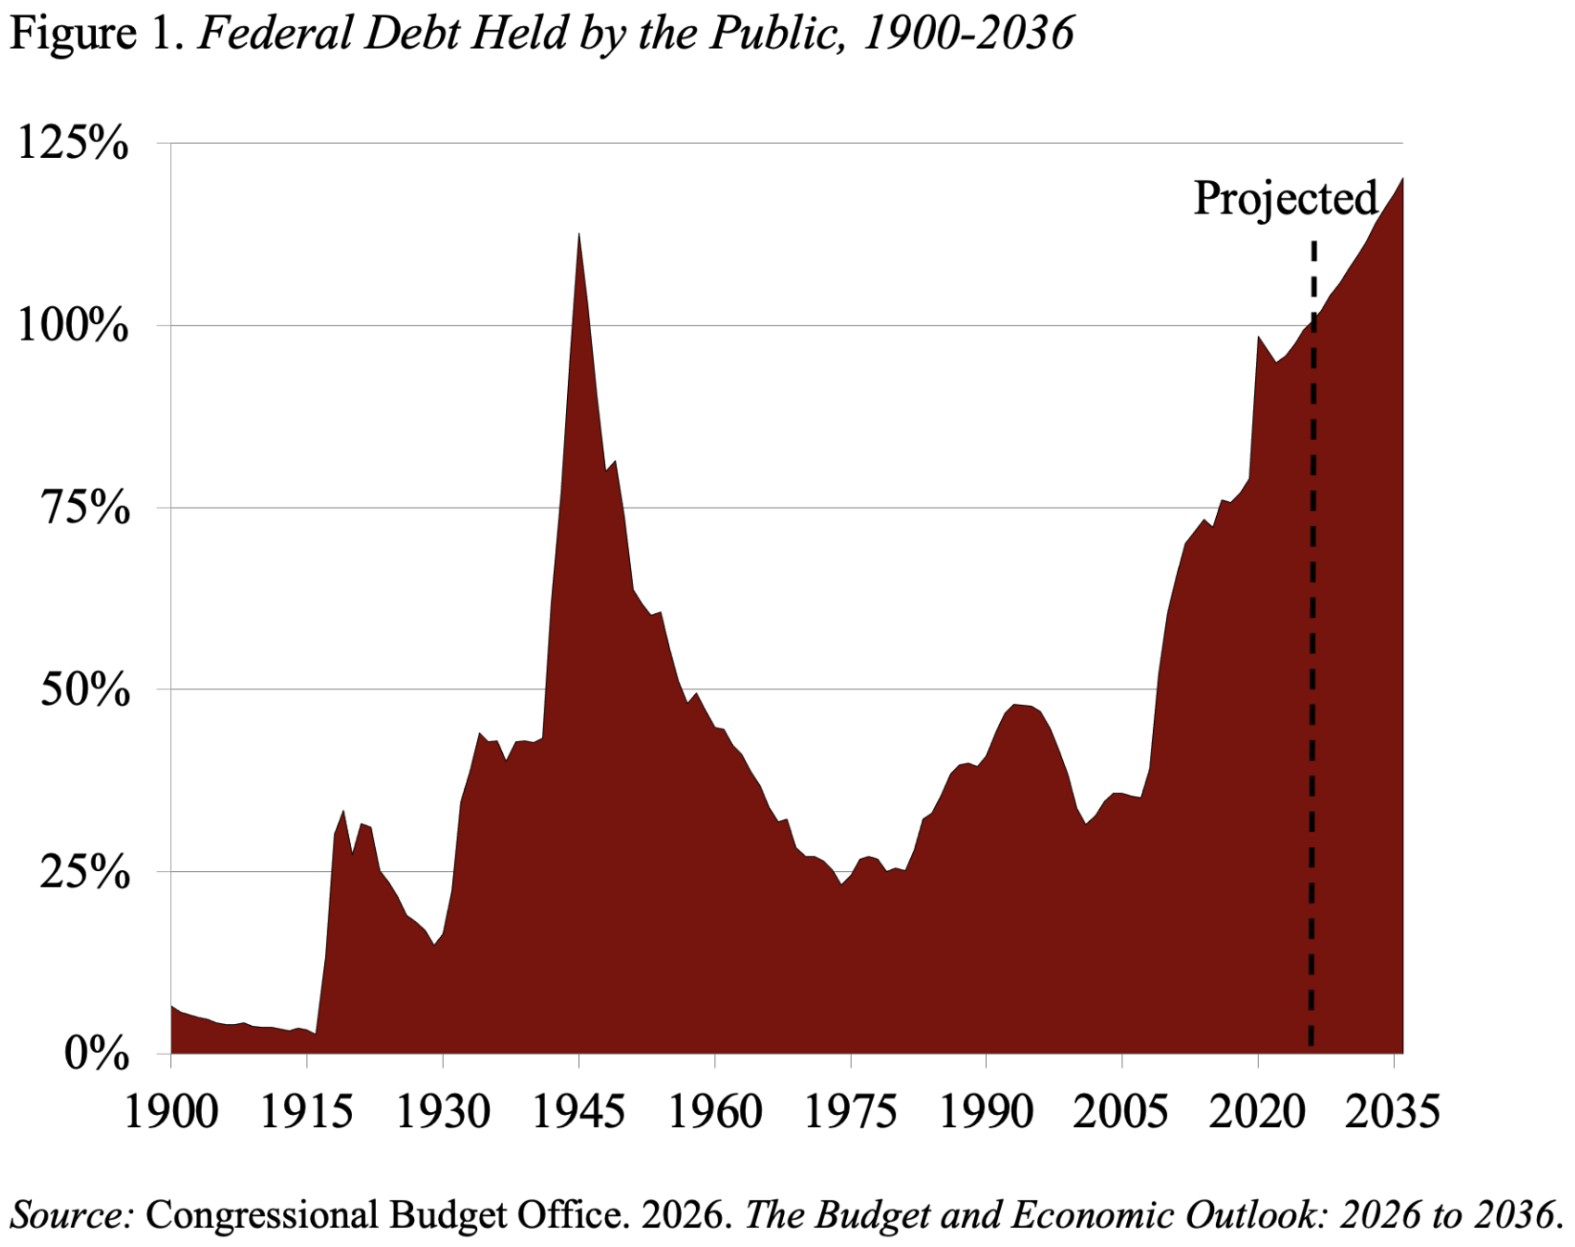
In the long-run, I believe gold’s biggest driver isn’t geopolitics. It is debt and currency debasement. The U.S. government’s fiscal position continues to deteriorate. The Congressional Budget Office projects a $1.9 trillion federal deficit in 2026, equivalent to 5.8% of GDP, while debt held by the public is projected to rise from 101% of GDP in 2026 to 120% by 2036.
At some point, governments carrying this much debt face an uncomfortable choice:
A) Tax the economy heavily → strangle growth, suppress investment and risk a major recession.
B) Allow inflation and currency depreciation to do some of the work → reducing the real value of outstanding debt without imposing the immediate political pain of aggressive taxation and spending cuts.
That is where gold comes in. Gold cannot be printed. Dollars can. So if the supply of dollars grows relentlessly while the supply of gold barely does, the price of gold doesn’t necessarily have to “rise.” The dollar can simply fall in value relative to gold. That is the debasement trade.
Gold Price Forecast
Every new Gold analysis as it publishes, today's technical signal and key levels, live price — on one page.
See all Gold forecastsCentral Banks Are Still Buying
This is the structural evidence behind the argument. Central banks accumulated an average of 1,000 tonnes of gold per year between 2022-24 – 2x the average pace of the preceding decade.
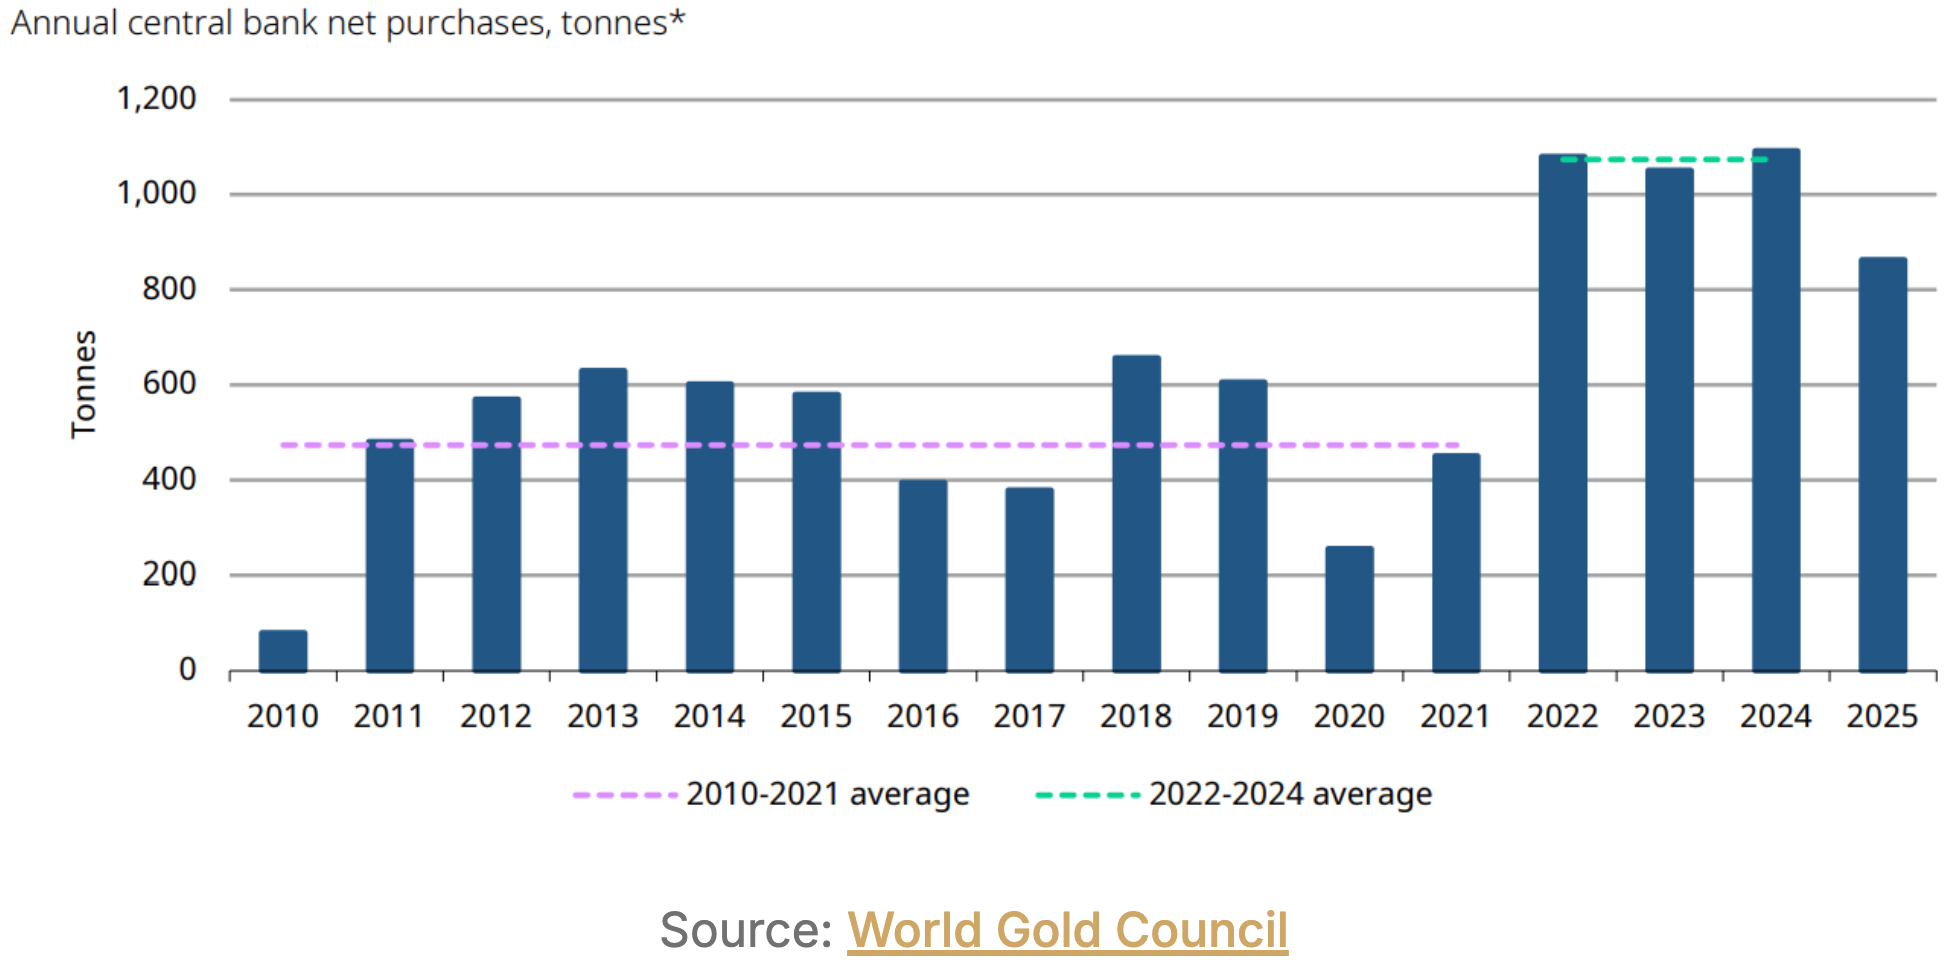
And in 2026, a record 45% of central-bank reserve managers expect their own gold holdings to increase over the next 12 months. So while investors can sell gold when the short-term economics turn against it, some of the world’s most important institutions continue to accumulate it. They aren’t trading the next Fed meeting. They’re positioning for the next decade.
So Why Did Gold Fall?
Because gold operates on two very different time scales:
- Long-term → Debt & Debasement.
- Short-term → Real Interest Rates.
Gold pays no interest. Treasuries do. So when real yields rise, the opportunity cost of holding gold increases. That is exactly what happened during the sell-off.
The Fed has maintained its policy rate at 3.75%, while inflation remains above its 2% target. The July Fed minutes also showed that some officials were concerned enough about persistent inflation to contemplate further rate increases, if necessary. So the bearish argument wasn’t irrational. Higher-for-longer rates can absolutely hurt gold. But this is where my model becomes important.
The Fed’s Dual Mandate Tells A Different Story
The Fed has two core objectives:
1. Keep inflation under control.
2. Keep the labour market healthy.
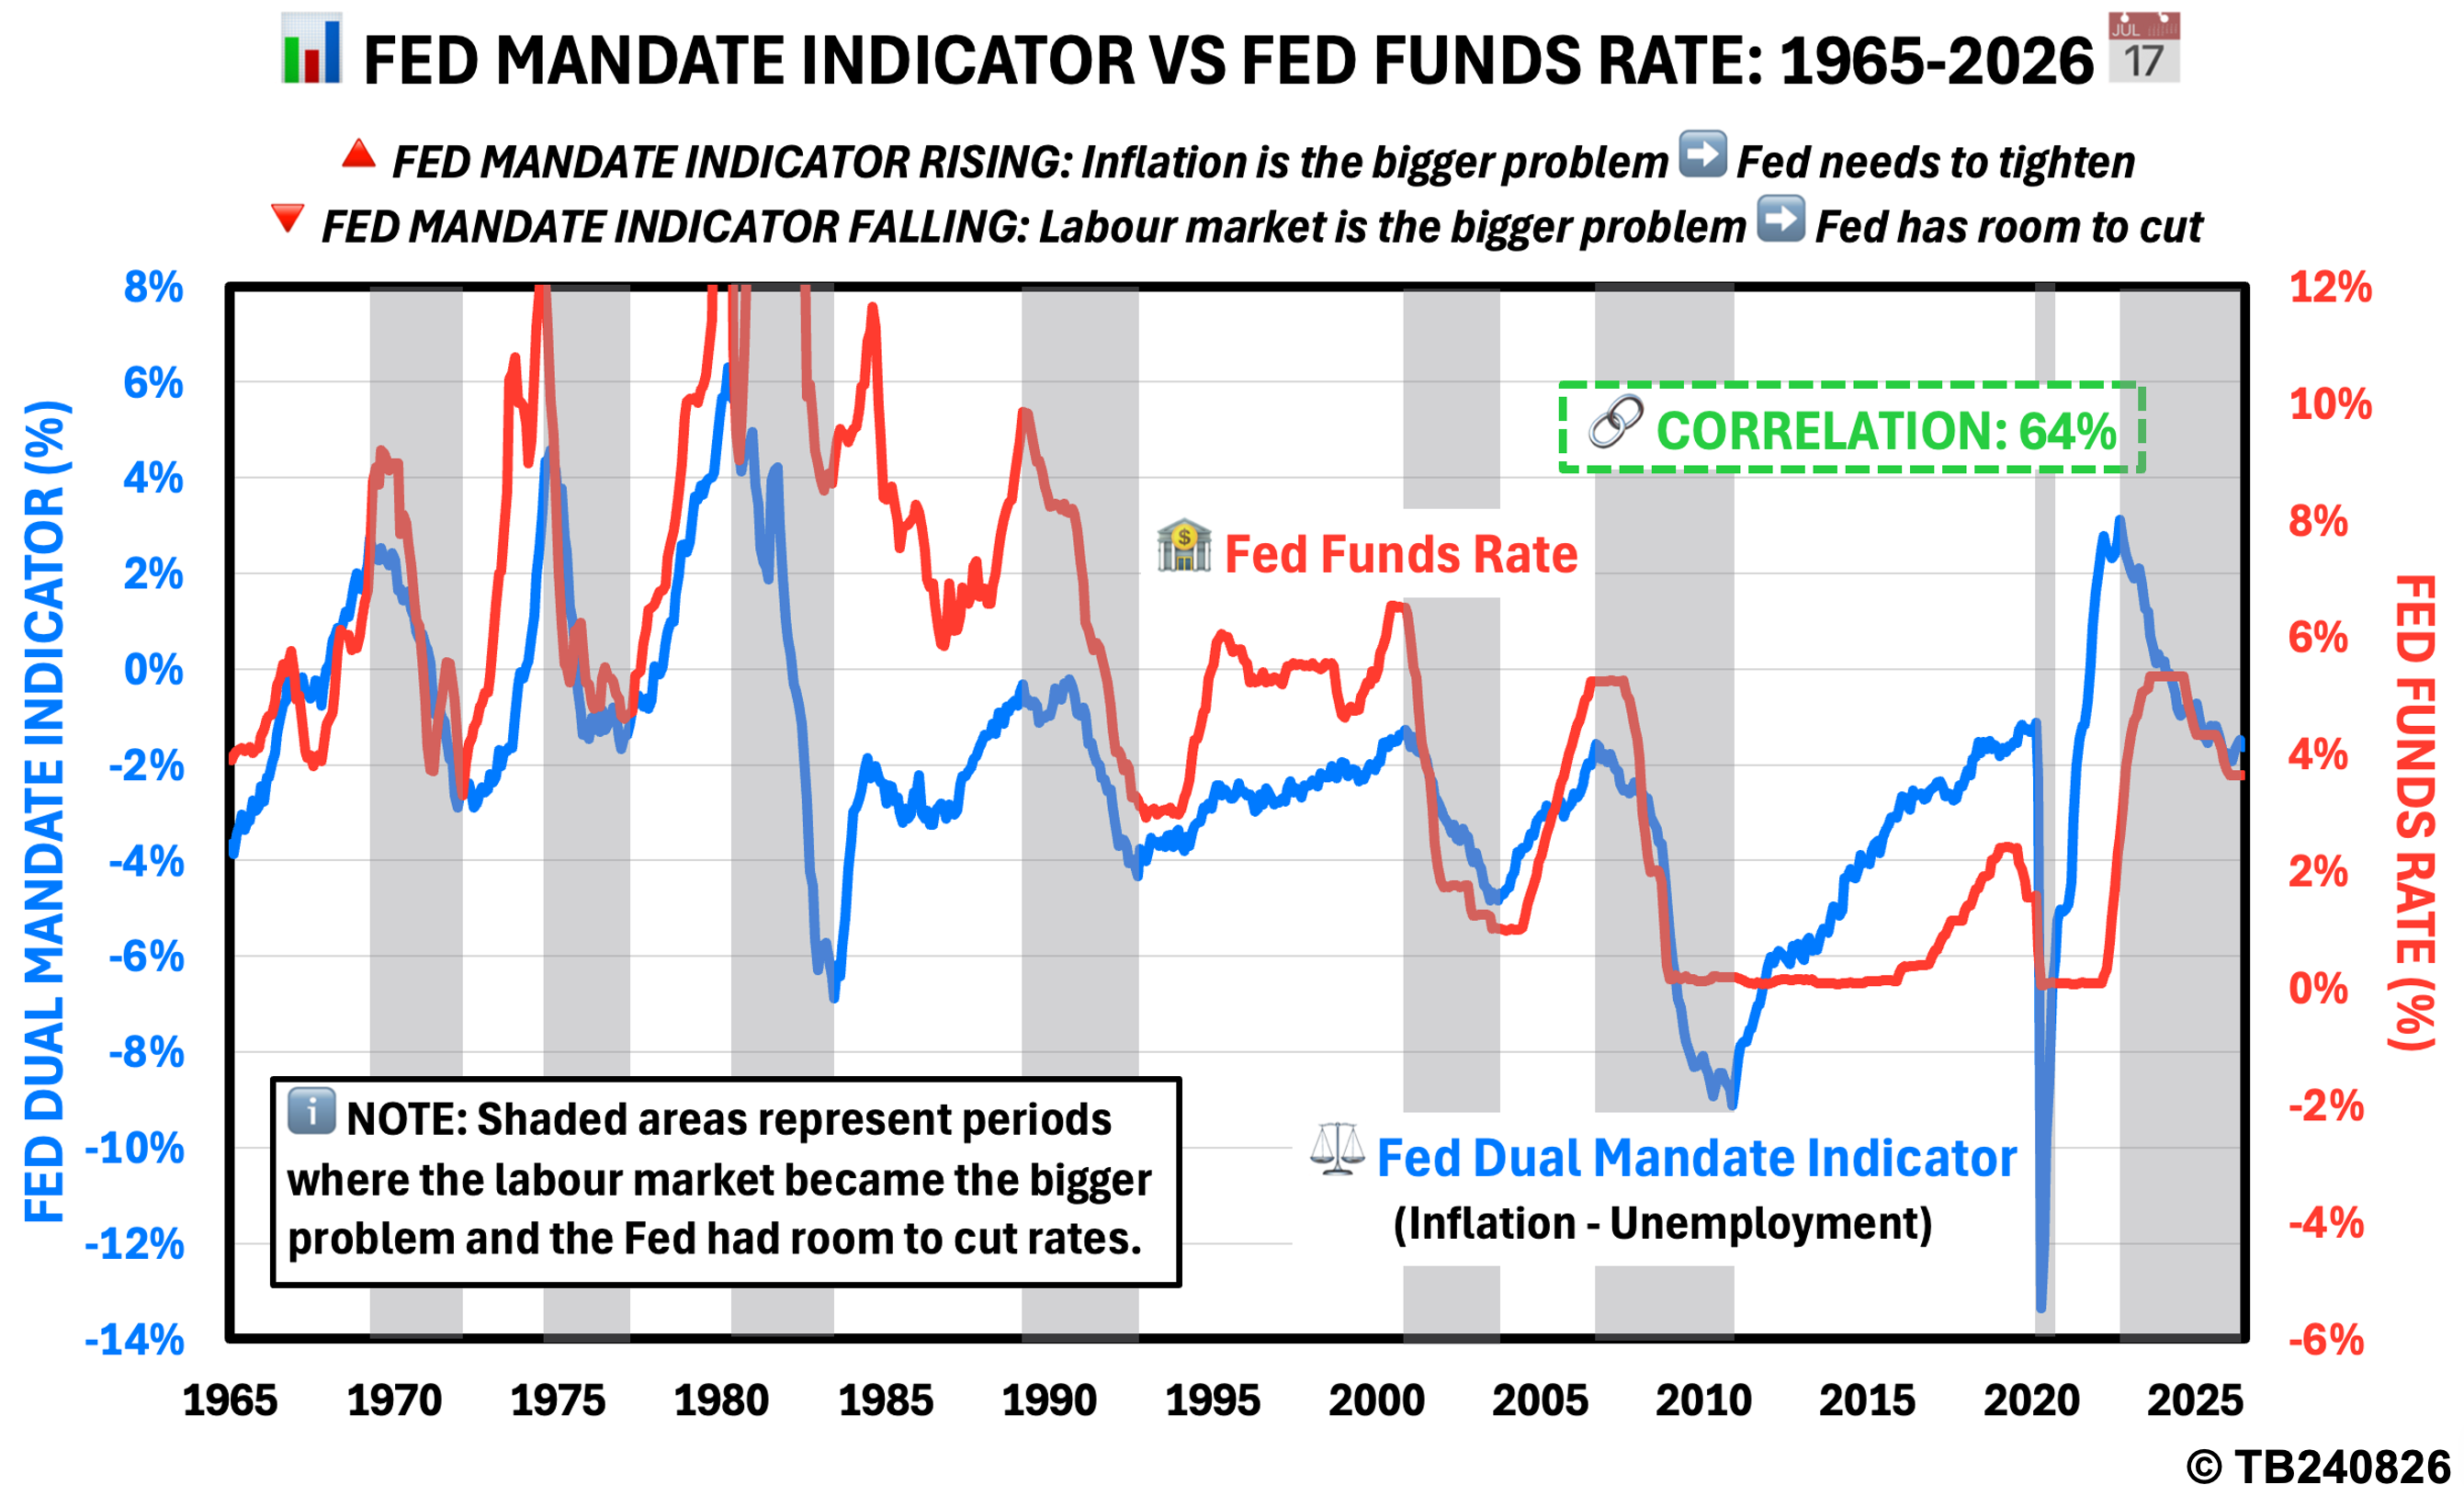
So I built a Fed Dual Mandate Indicator combining the two.
Here’s The Key
When my indicator rises, inflation is becoming the bigger problem. That is when the Fed needs to tighten. When it falls, the labour market is becoming the bigger problem. That is when the Fed has room to cut.
And when I overlay the Fed’s policy rate against the indicator, the relationship is more than fleeting. The Fed tends to tighten when inflation dominates. It tends to ease when employment becomes the bigger concern.
And right now? My indicator does not suggest that the economy is screaming for dramatically higher interest rates. That matters enormously for gold. The recent sell-off was driven, at least in part, by expectations that the Fed could keep rates higher for longer. But if the data does not justify another major tightening cycle, that particular headwind could begin to disappear.
The Treasury Changes The Equation
And now there is another development that could become increasingly important. The U.S. Treasury has announced that it will double the size of some long-duration Treasury buybacks, raising individual operations from $2 billion to at least $4 billion for 10-to-30-year bonds. The move comes after long-term Treasury yields surged to their highest levels in years, with the 30-year yield briefly reaching 5.34%, its highest level since 2007.
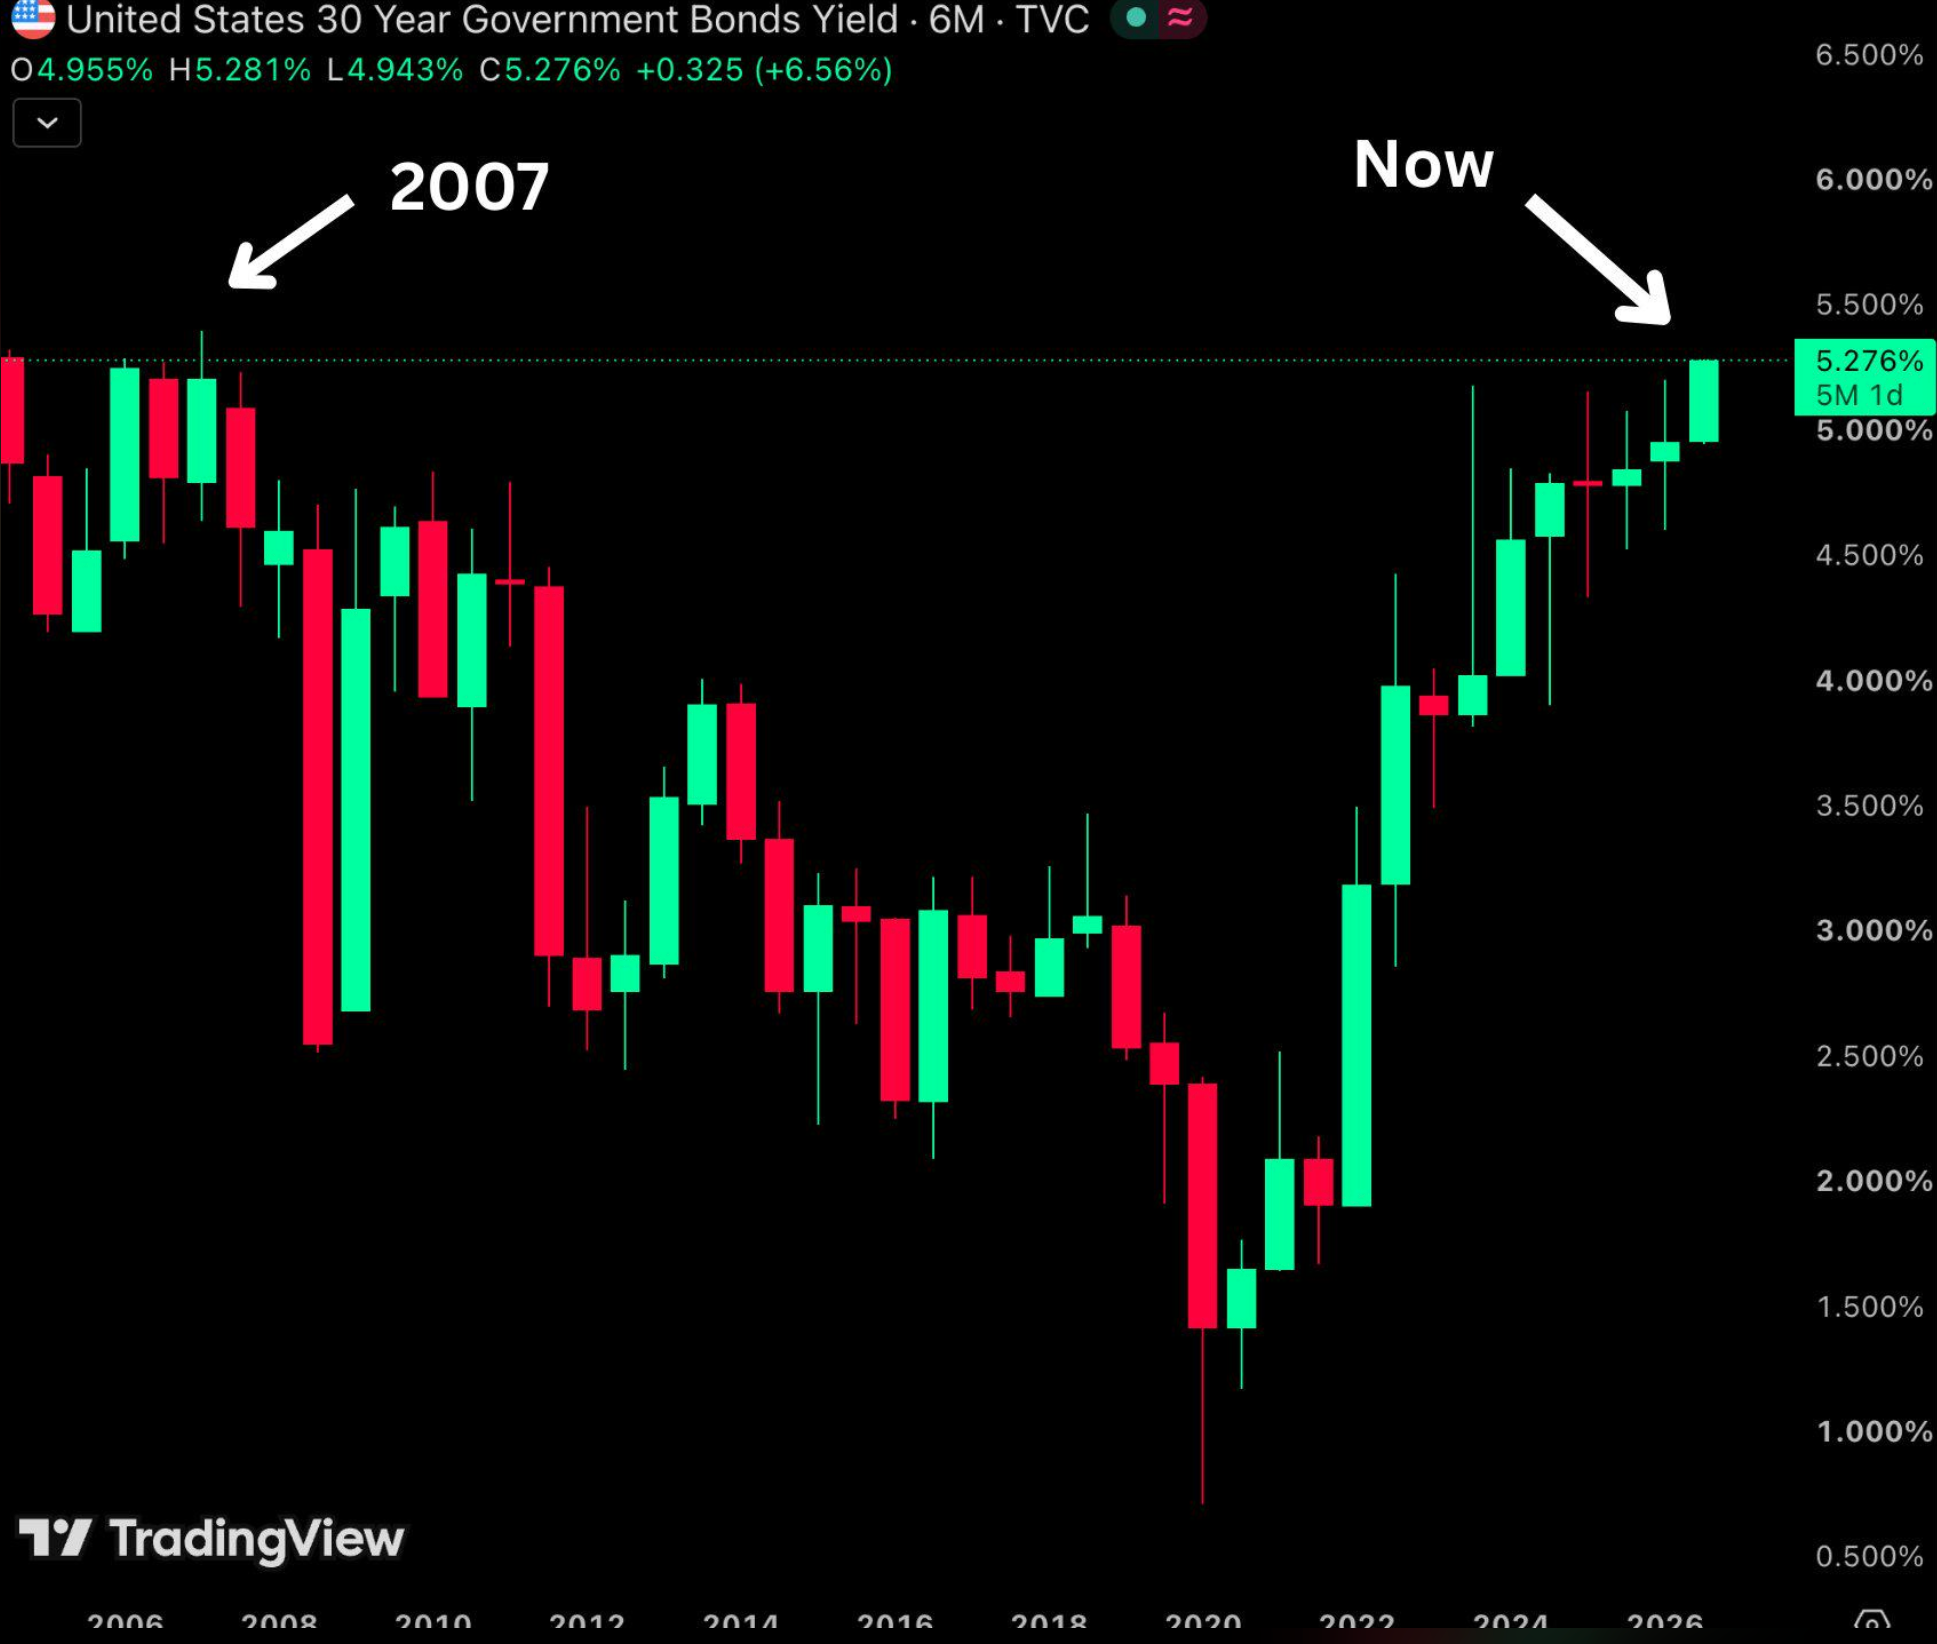
Officially, the objective is to improve liquidity and support the functioning of the Treasury market. But there is a bigger question. How much higher can long-term borrowing costs realistically go when the U.S. government is carrying more than $40 trillion of debt?
The Treasury isn’t printing money. This isn’t quantitative easing. But it does demonstrate how sensitive policymakers have become to conditions in the long end of the bond market. And that matters because if fiscal pressures eventually force policymakers to prioritise debt sustainability alongside inflation and employment, the monetary environment could become considerably more favourable for gold.
The Policy Trilemma
This leaves policymakers facing three competing objectives:
1. Control Inflation.
2. Protect the Economy.
3. Contain the Cost of Government Debt.
It is difficult to maximise all three simultaneously. Aggressively fighting inflation requires restrictive monetary policy. Supporting growth argues for lower rates. Containing the government’s debt burden creates pressure to prevent borrowing costs from remaining excessively high. Eventually, something may have to give. And gold could benefit enormously if policymakers ultimately tolerate some combination of:
- Lower real rates.
- Higher inflation.
- A weaker dollar.
- Financial repression.
How I Would Trade Gold
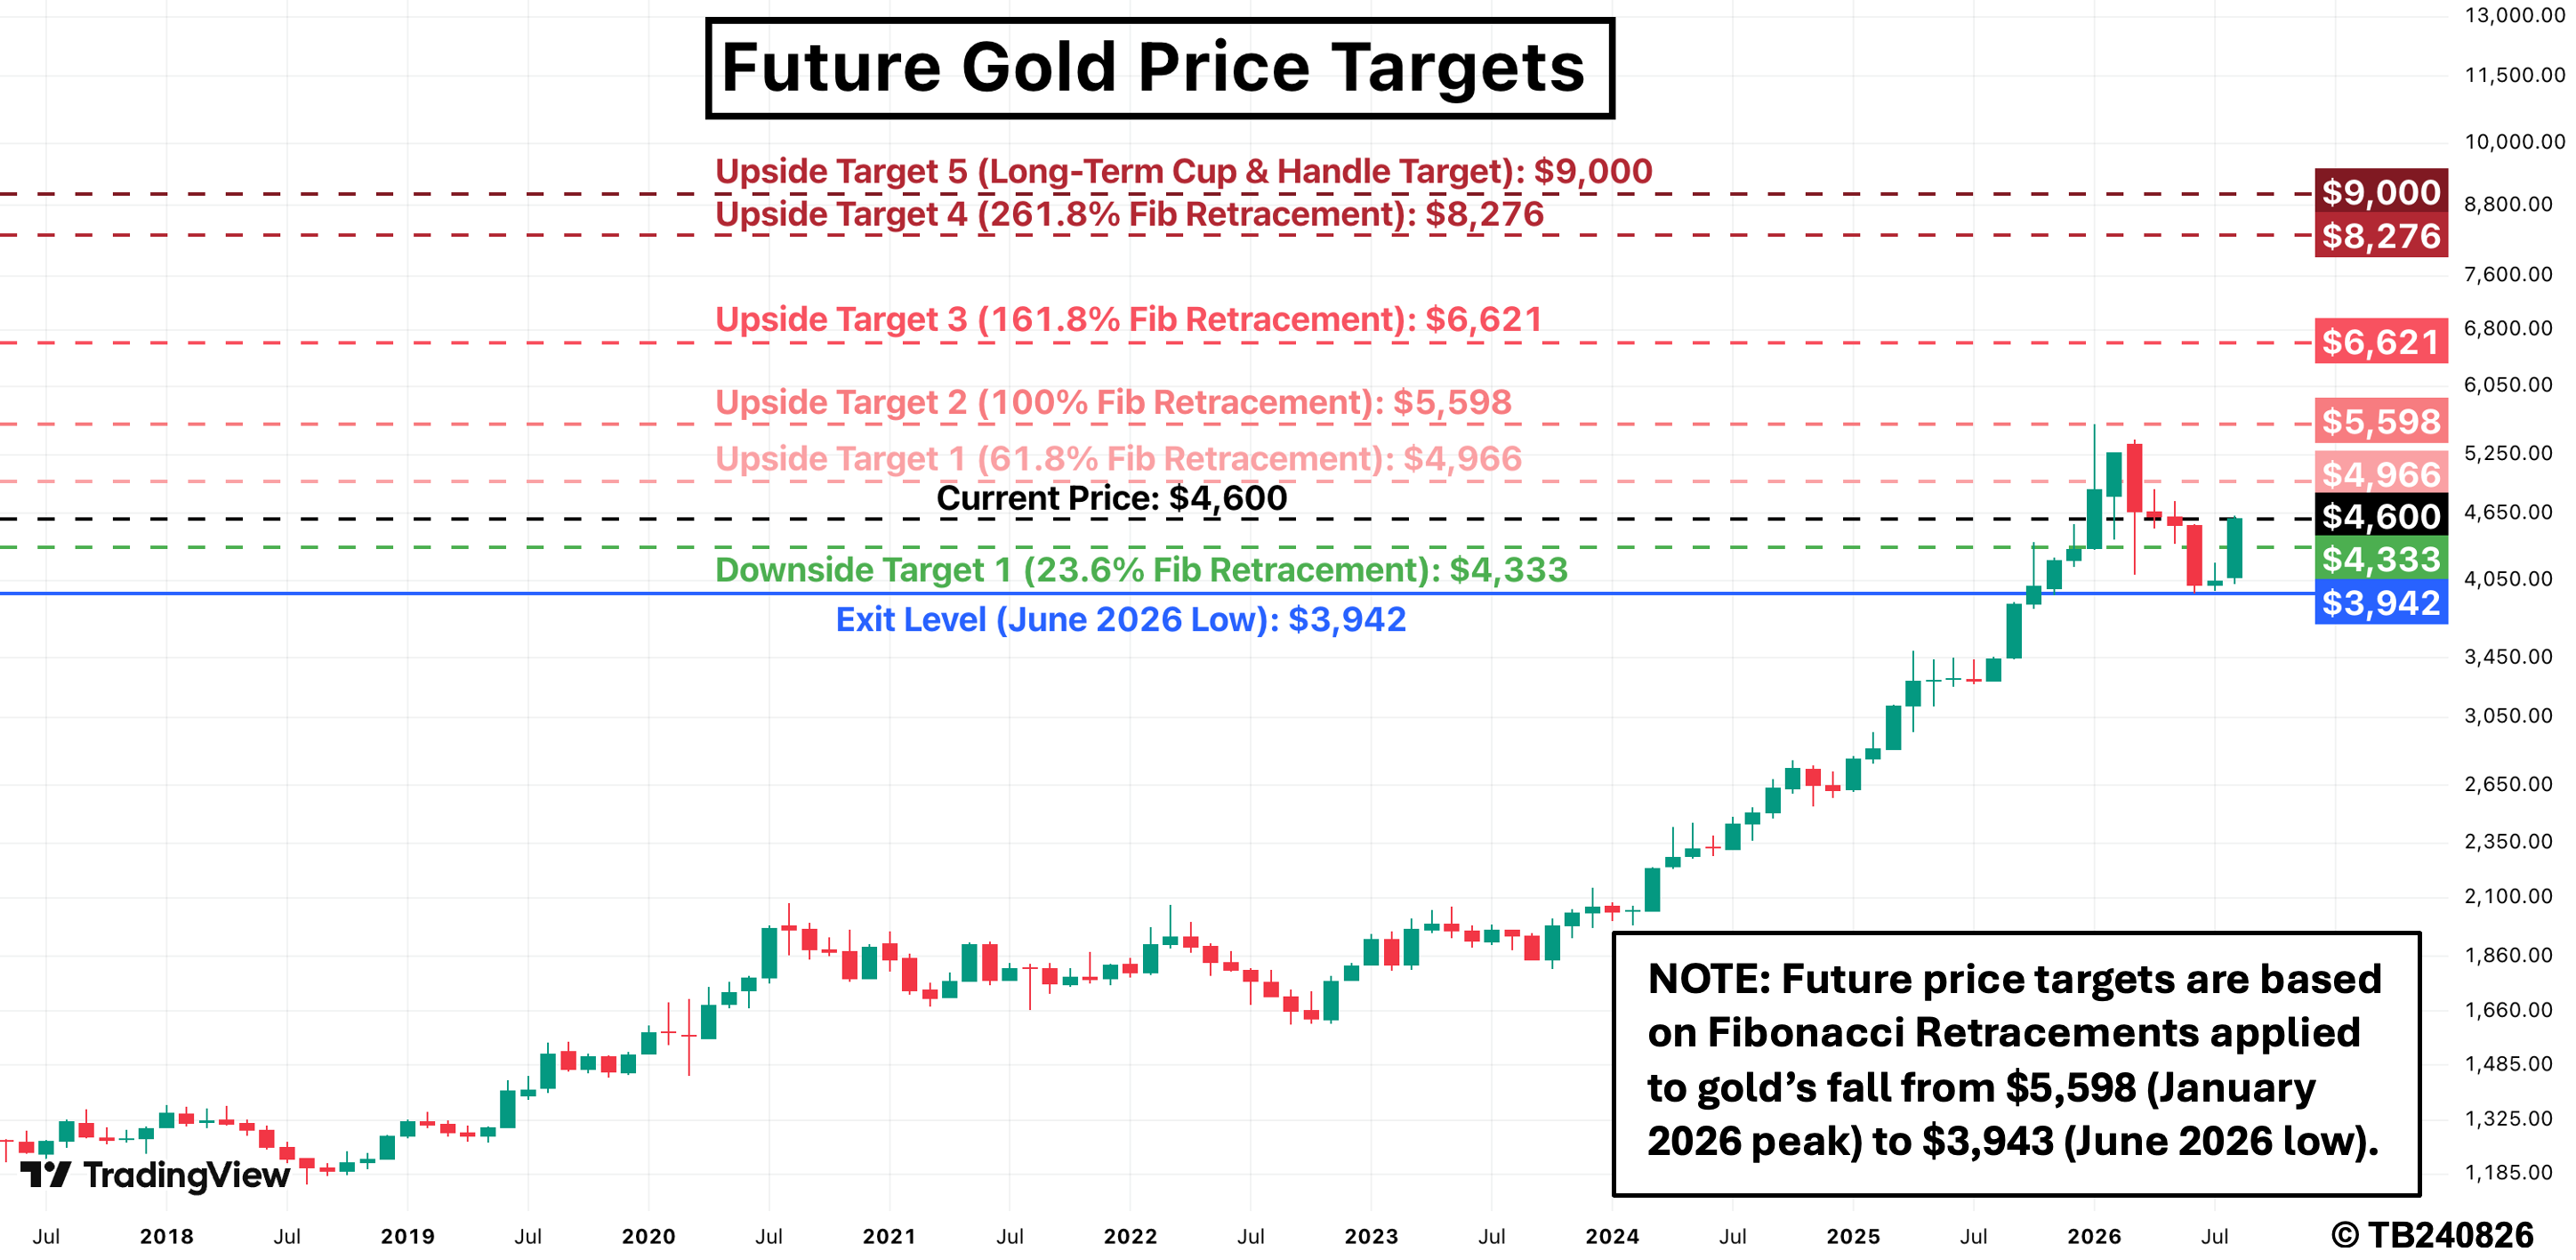
For investors who believe gold is in the early stages of a new long-term uptrend, the key question is how to express that view while controlling downside risk. At the current price of $4,600, I would be slightly cautious, initially allocating only 50% of my intended gold allocation. Gold has already risen 17% over the past two months, so I would prefer to keep capital available to take advantage of a pullback.
If gold falls to my first downside target of $4,333, I would deploy the remaining 50%. This would effectively dollar-cost average into the position rather than committing all of my capital after such a strong rally. A move to $4,333 would represent a 38.2%-50% Fibonacci retracement of gold’s rally from $3,942 to $4,632 – a typical retracement range following a sharp move higher.
I would remain bullish on gold as long as it held $4,333. If it broke below that level, I would turn neutral. However, $3,942 would be my line in the sand. If gold broke below $3,942, I would exit the entire position and turn bearish.
Assuming I bought 50% at $4,600 and 50% at $4,333, my average purchase price would be $4,466. A decline from that average entry price to $3,942 would therefore represent a potential loss of 12%.
How I Would Take Profits
I would manage the upside in stages rather than attempting to pick the top:
- At $4,966, I would take 20% of my gold position off the table.
- At $5,598, I would take a further 25% of the remaining position.
- At $6,621, I would take 33% of the remaining position.
- At $8,276, I would take another 50% of the remaining position.
If gold approached my final target of $9,000, I would reassess whether the original investment thesis still justified maintaining the remaining exposure.
The Risk-Reward
Assuming gold first pulls back to $4,333 and subsequently rises to $9,000, my average purchase price would be $4,466. Under the staged profit-taking strategy above, the resulting total return would be 54%. That compares with a potential 12% loss if gold falls through my $3,942 stop-loss level. In other words, the strategy offers an approximately 4-to-1 risk-reward ratio.
Put simply, for every $1,000 I am prepared to risk, I would be targeting $4,000 of potential upside. The attraction is therefore not simply the potential upside in gold. It is the ability to define the downside before entering the trade while allowing the position to participate in a potentially much larger long-term move.
The Rope-a-Dope
Perhaps gold’s most important characteristic this year has been how convincingly it initially appeared to fail. Geopolitical risk exploded. Gold fell. Inflation remained elevated. Gold fell. Interest rates stayed high. Gold fell.
Investors began questioning whether the great gold bull market was over. But then the market started looking beyond the next Fed meeting. The Treasury became more active in the long end of the bond market. The dollar weakened. Gold broke back above its 200-day moving average. And the precious metal surged above $4,600.
Suddenly, the narrative looks very different. The question isn’t simply whether gold can survive higher rates. It is: What happens if markets begin pricing the fiscal consequences of America’s debt problem? Because if the next phase of this cycle is not about relentlessly rising real rates… but instead about lower real rates, currency debasement and financial repression… then the forces driving gold could look very different.