



June WTI Pushes Back Toward $100 as Netanyahu Says It Is Not Over
June WTI crude oil futures pushed to $100.37 Monday before pulling back and the message from that price test is clear. The war premium that analysts said was erased last week is not gone. It is sitting right there at $100 waiting to see which side blinks first. Netanyahu said the conflict is not over. Trump called Iran’s latest response totally unacceptable. OPEC production just posted its steepest drop in two decades. The war premium everyone said was gone is already coming back. Here is what is actually driving this market.
Technical Outlook
June WTI Crude Oil Futures
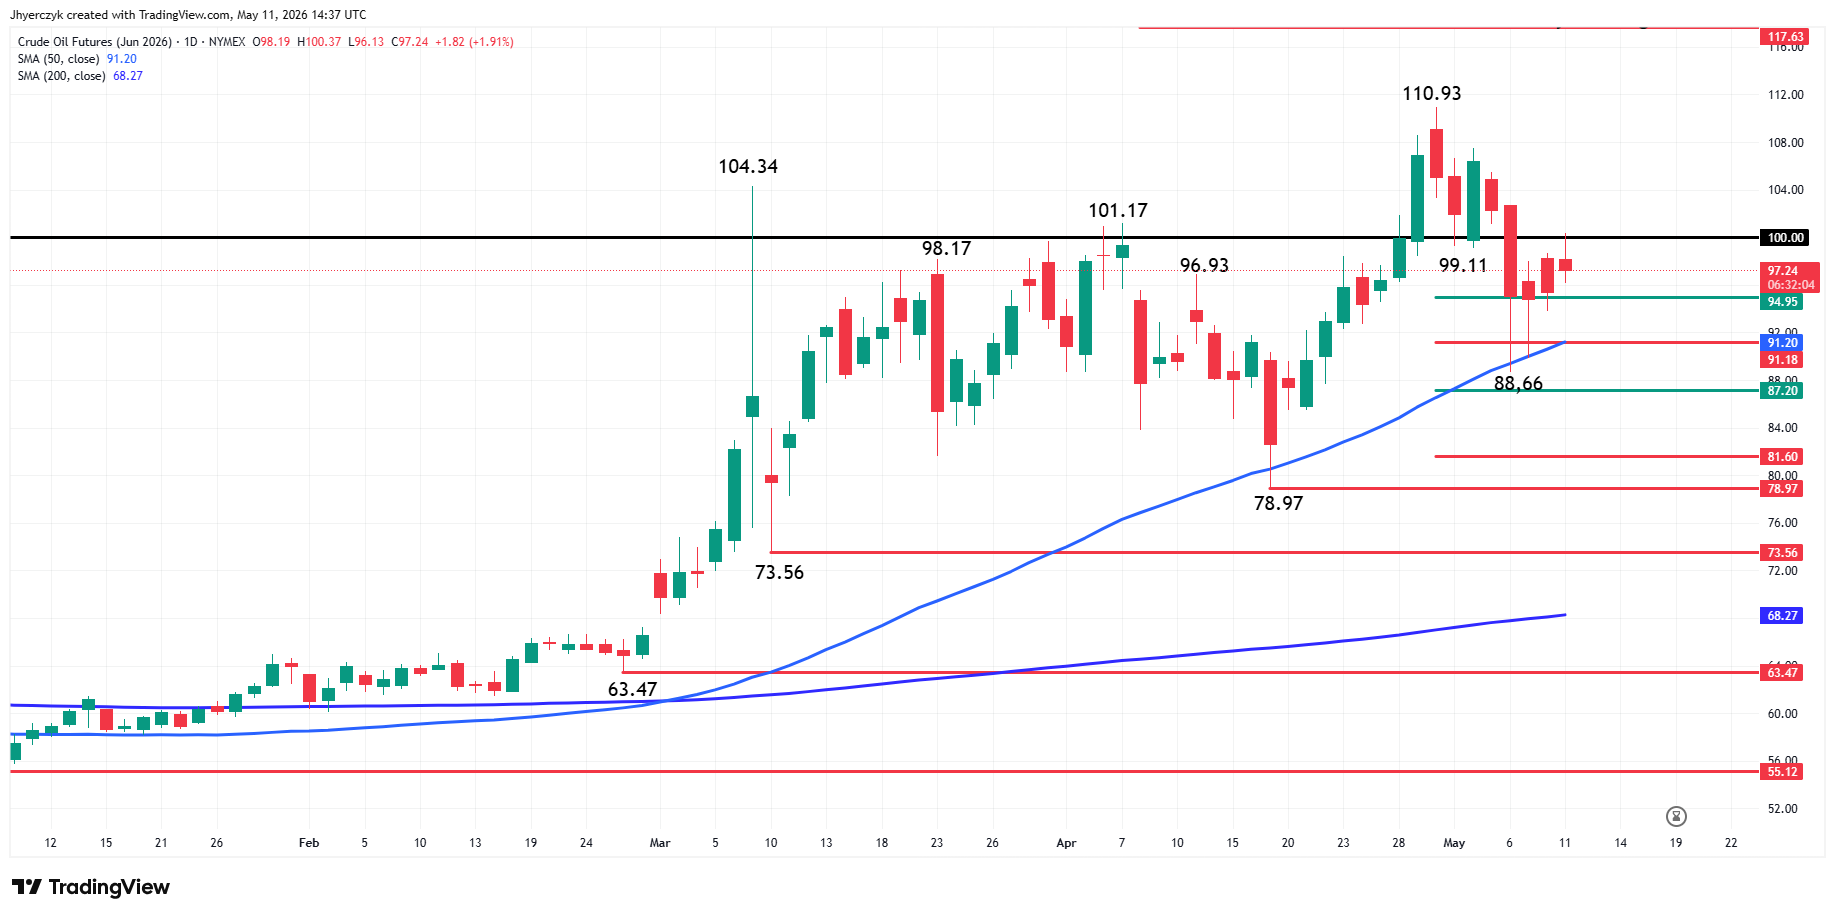
June WTI crude oil futures are edging higher on Monday as traders continue to assess the impact of the latest news from the Middle East. Earlier in the session, the market retraced half of the break from $110.93 to $88.66, to $99.80 and even extended to the psychological $100.00 level to $100.37, before breaking down.
Traders are now facing a possible retest of the support zone at $94.95 to $91.18, and the 50-day moving average at $91.20. Look for buyers on the pullback to this area. If the 50-day MA fails then the selling could extend into $87.20 to $81.60. Buyers could continue to come in on weakness into support as long as the swing bottom at $78.97 holds as support.
On the upside, a sustained move over $100.00 would put $110.93 back on the table.
July Brent Crude Oil Futures
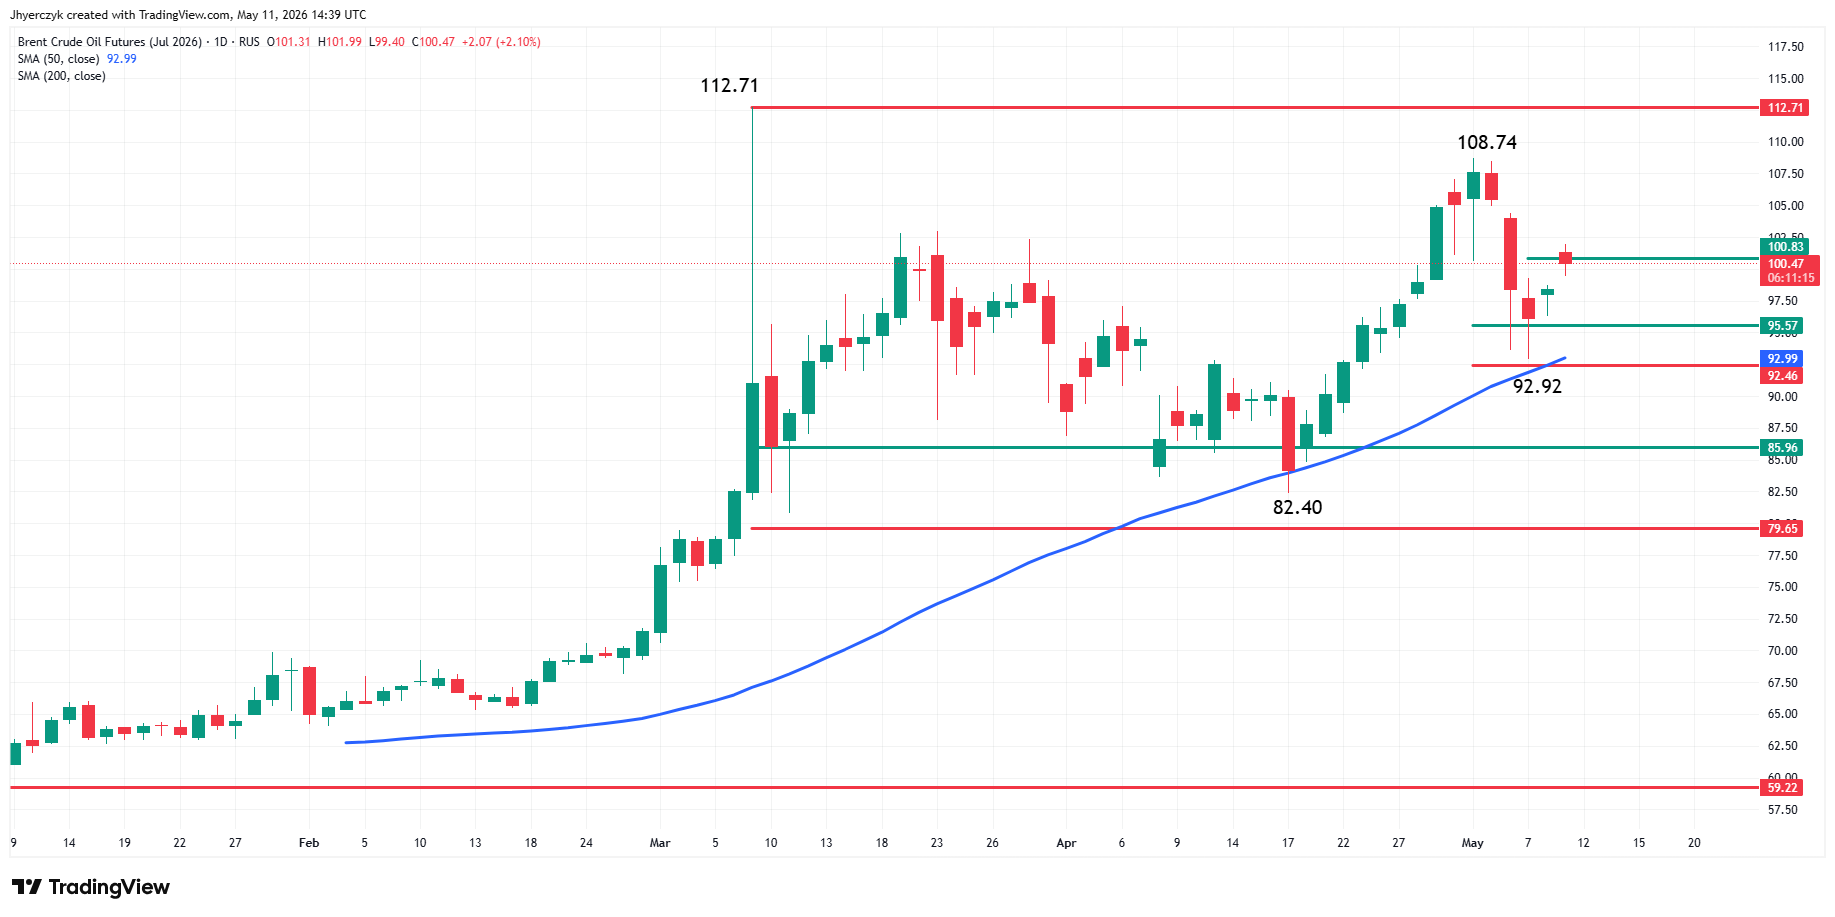
July Brent crude oil futures are also posting a similar chart pattern. The short-term range is $108.74 to $92.92. Its 50% level is $100.83. Earlier today, the market tested $101.99. A sustained move over the 50% level will indicate more buyers are coming in to support the move. This would put $108.74 to $112.71 on the radar.
Brent Oil Price Forecast
Every new Brent Oil analysis as it publishes, today's technical signal and key levels, live price — on one page.
See all Brent Oil forecastsA failure to overcome $100.83 will indicate the presence of sellers. This could lead to a retest of $95.57 to $92.46 and the 50-day moving average at $92.99. With the main trend up according to the swing chart, buyers are likely to return on a test of this zone.
If the 50-day moving average fails to hold, sellers could hit the market even harder with the long-term retracement zone at $85.96 to $79.65 a possible target.
With last week’s steep sell-off from multi-year highs, headlines were written saying the war premium had been erased. I don’t know if this is true because the chart pattern suggests that perhaps only 50% of the premium had been removed. Furthermore, the current two day rally indicates that half of the premium lost has been recovered. Without a true failure near $110.83 for June WTI and $108.74 for July Brent, its tough to say there is no war premium in the market. Additionally, traders are still buying dips so the bullish tone remains despite the steep sell-off.
Oil Rebuilds the War Premium as Iran Risks Escalate
Last week analysts wrote the war premium out of June WTI crude oil. The chart is telling a different story. The selloff from $110.93 stopped at $88.66 and the market immediately started recovering. Monday it pushed to $100.37 before pulling back. That is not a market that has fully priced out geopolitical risk. That is a market that removed roughly half the premium and then started putting it back. Netanyahu said over the weekend that operations involving Iran are not over and that nuclear and missile infrastructure remains a target. Trump rejected Tehran’s latest response before markets opened Monday. Those are not peace headlines. Those are escalation headlines and crude oil priced them in immediately.
OPEC Production Just Posted a Historic Drop
April OPEC output hit the lowest level in more than two decades. Production fell roughly 830,000 barrels per day as Strait of Hormuz disruptions forced Gulf producers to cut shipments. Kuwait took the hardest hit. Saudi Arabia and Iraq both lost output. The United Arab Emirates held steady because it has export routes that never touch the Strait. I’ve been watching supply data for a long time and a drop that size in a single month is not a rounding error. It is a structural tightening and it landed on top of an already restricted shipping picture. Those two things building on each other at the same time is not a setup that favors the bears.
The Strait Is Still the Center of Everything
Twenty percent of global oil flows through the Strait of Hormuz on a normal day. This is not a normal day and has not been since February. The rerouting happening right now is not free. Every tanker that takes the long way around pays more and charges more and that cost moves through the entire supply chain before it is done. Insurance rates are up. Delivery timelines are longer. Physical market participants are adjusting to a world where the Strait is not reliably open and that adjustment has a price tag attached to it every single day. Tehran decides when that changes. Nothing out of Tehran on Monday suggested it changes soon.
The Demand Destruction Conversation
Crude at these levels eventually creates its own ceiling and I think we are getting closer to that conversation. When fuel costs get high enough, consumers pull back and businesses find ways to use less. Developing economies hit that threshold faster than wealthier ones. I am not seeing demand destruction in the data yet but the fact that analysts are starting to talk about it tells me the market is aware the floor could become a ceiling if prices keep running. The Trump and Xi Jinping meeting later this week matters for a different reason. China is the largest importer of Persian Gulf crude and Beijing has real incentive to push for stability in the region. A signal out of that meeting that de-escalation is possible takes June WTI crude oil lower quickly. I am watching it closely.
What I’m Watching
The $100.00 level on June WTI crude oil is where this week gets decided. Push through it with conviction and $110.93 comes back into play. Stall here and the market resets toward the support zone at $94.95 to $91.18 with the 50-day moving average at $91.20 as the next line of defense. July Brent crude oil has its own version of the same test sitting at $100.83. Both pivots matter and both are telling the same story. Buyers have come in on every dip since February and nothing Monday changed that pattern. The bullish tone holds as long as $78.97 stays intact on June WTI. Lose that and the whole setup changes. Until then the dip buyers are still in control and the chart is still pointed higher.
If you’d like to know more about how to trade crude oil, please visit our educational area.