



Oil just posted its sharpest one day drop in weeks. The trigger was a ceasefire pause and unresolved talks, not a confirmed change in how the tankers actually move through the Strait of Hormuz. My read of the shipping tracker and inventory data says the market has room to give some of that move back. One data series decides whether that read is right i.e. verified vessel transits.
WTI Crude Posts Its Sharpest One-Day Drop in Weeks
WTI crude fell $6.70 on July 27, 2026, 7.5%, to close at $82.61, its lowest settlement since the July 16. Brent fell further in percentage terms, $8.42 or 8.7%, to $88.36, its lowest close since July 17, per the same report. By the morning of July 28, WTI had eased again to $80.98 intraday, roughly 2% lower. Here is the trigger. President Trump ordered a halt to the US strikes on Iran around July 25. Iran’s army said it had “halted retaliatory operations,”. Iranian and Omani negotiators, with Saudi Arabia’s foreign minister also engaging Tehran, advanced talks on restoring safe Hormuz transit. A day before the crash, a tanker struck a naval mine and exploded after leaving Iran’s designated corridor, according to Iran’s IRGC – linked Tasnim news agency, cited in The Jerusalem Post. That’s a single sourced claim from a combatant party, worth reading with that in mind. Kazakhstan’s CPC terminal also resumed loadings the same Monday, after losing roughly 1.8 million barrels a day to drone strikes days earlier, a second repair I think the Hormuz only framing leaves out.
The Market Has Tried Pricing a Hormuz Resolution Before
The broader trend this market has tried pricing this kind of resolution before. The Strait of Hormuz has been disrupted since the US and Israel struck Iran on February 28, 2026. A ceasefire followed on April 7 – 8 after more than five weeks of fighting, and a US – Iran memorandum of understanding on June 18 aimed at reopening the strait. The EIA’s July 7 press release priced that MOU as durable i.e. $27 off Brent’s Q3 2026 forecast, to $74. The Short-Term Energy Outlook cut Q4 a further $19 to $70.00, down from $103 in Q2, expecting “most crude oil production” back to pre conflict levels by the year end. That MOU did not hold three weeks Iran struck three commercial vessels off its designated corridor around July 6 – 7, and the US resumed strikes. By July 21, tanker movements had plunged to 39 for the week from 85 the week before. I read the EIA’s own Q3 call as stale now, not wrong when written, just overtaken. The FOMC’s own calendar has the July 29 decision the market is also pricing into this window.
WTI Crude Financial Analysis
Verified Transit Data Hasn’t Moved the Way the Price Already Has
Verified ship tracking data carries the clearest evidence here, ahead of the diplomatic headlines. The IMF’s own PortWatch dataset recorded just 10 transits on July 23, 2026, its most recent published day, against an 88 per day pre crisis baseline, down from 15 on July 19. PortWatch publishes on a roughly two day lag, so no reading yet covers the July 25 pause, and through July 23 the trend was still falling, not recovering. Nor is the mine threat resolved Iran’s own signed commitment, under the Islamabad MOU’s Point 5, to demine the strait within 30 days expired July 18, ten days before this crash, and outside estimates separately still run 40 to 50 days from mid June. A tanker reportedly hit a mine on July 26, a day before the crash, on the same single sourced Tasnim claim from the News section above. I think a pause with no verified transit recovery yet, layered on a clearing operation that just registered an unresolved mine report, is a thin basis for an 8% one day move.
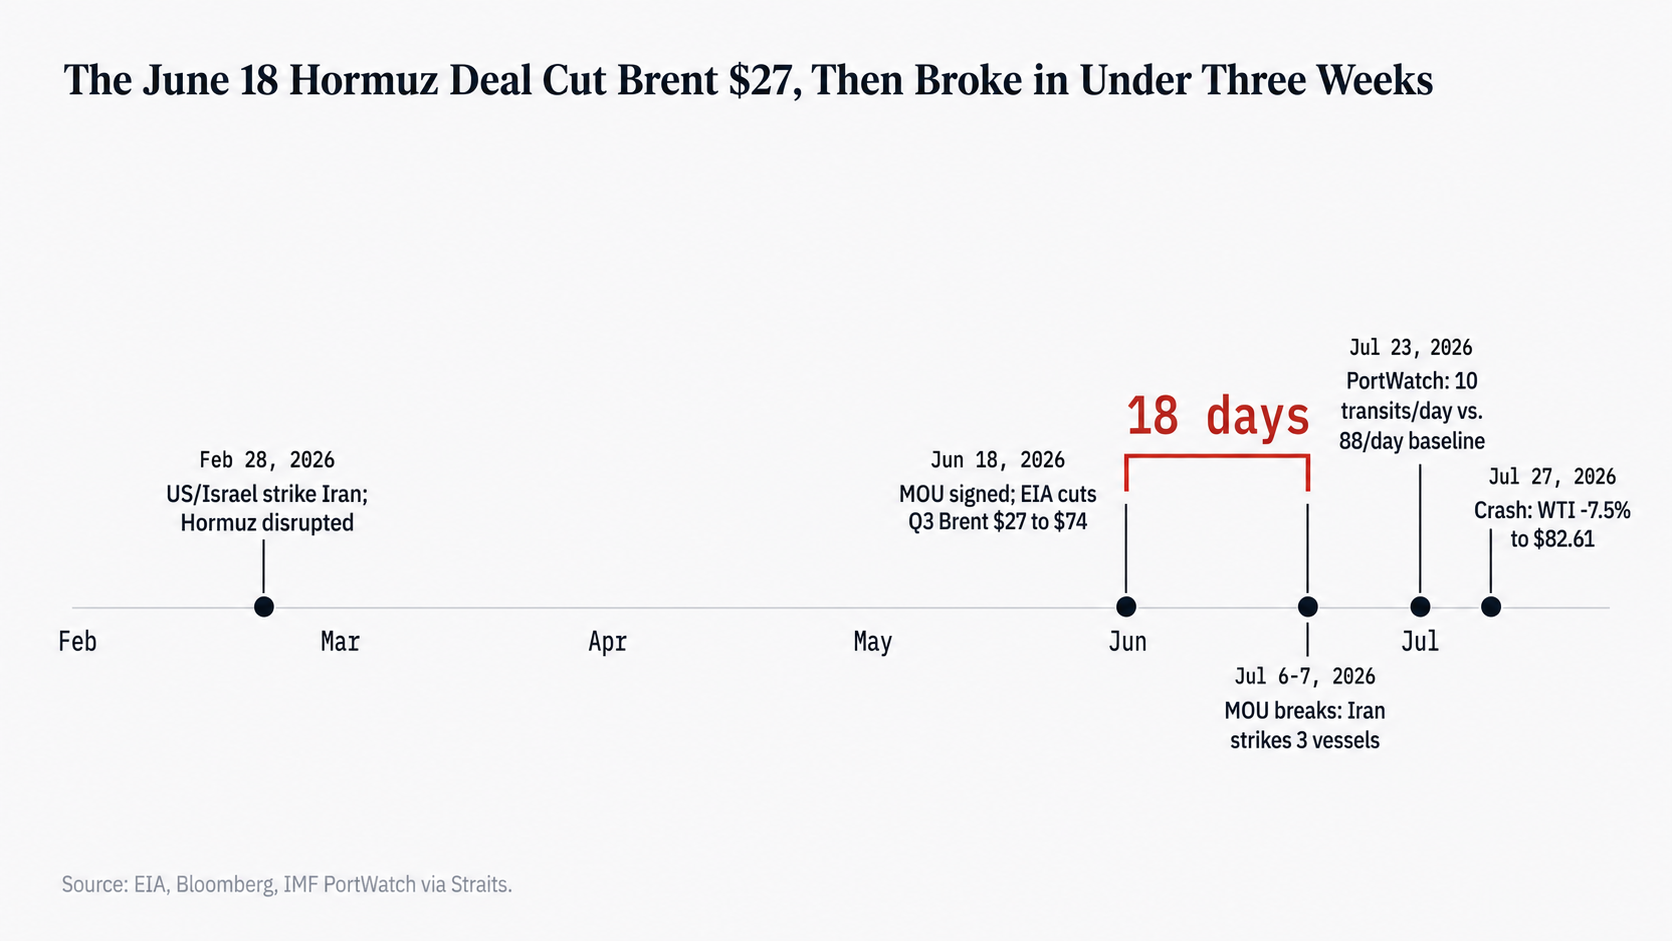
Hormuz timeline showing the June 18 agreement, its breakdown within 18 days, and WTI’s July 27 selloff. Source: EIA, Bloomberg, and IMF PortWatch via Straits.
WTI Crude Oil Price Forecast
Every new WTI Crude Oil analysis as it publishes, today's technical signal and key levels, live price — on one page.
See all WTI Crude Oil forecastsCushing Is Below Its Operating Minimum While National Inventories “Build”
NYMEX WTI futures show speculative, non commercial accounts net long roughly 81,700 contracts: 310,182 long against 228,493 short, as of July 21, 2026, the most recent report available and six days before the crash it helps explain, per the CFTC’s Commitments of Traders report. It is a long book built during the mid July rally, and a 7.5% one day drop can force part of it out mechanically. Cushing, Oklahoma, the physical delivery point for WTI, tells a tighter story than the national headline suggests. Commercial crude inventories excluding the SPR built 2.0 million barrels for the week ended July 17, but Cushing stocks did the opposite, falling 674,000 barrels the same week to 19.37 million barrels. That is below the roughly 20 million barrel level treated as the hub’s minimum operating tank bottom, and its lowest level since 2014. Call it a genuine divergence the national number built while the delivery point itself kept draining. Cushing tightness does not by itself guarantee the flat price moves higher. Inventory effects can show up unevenly across delivery points, so I read it as reinforcing evidence alongside the transit data, not an independent driver.
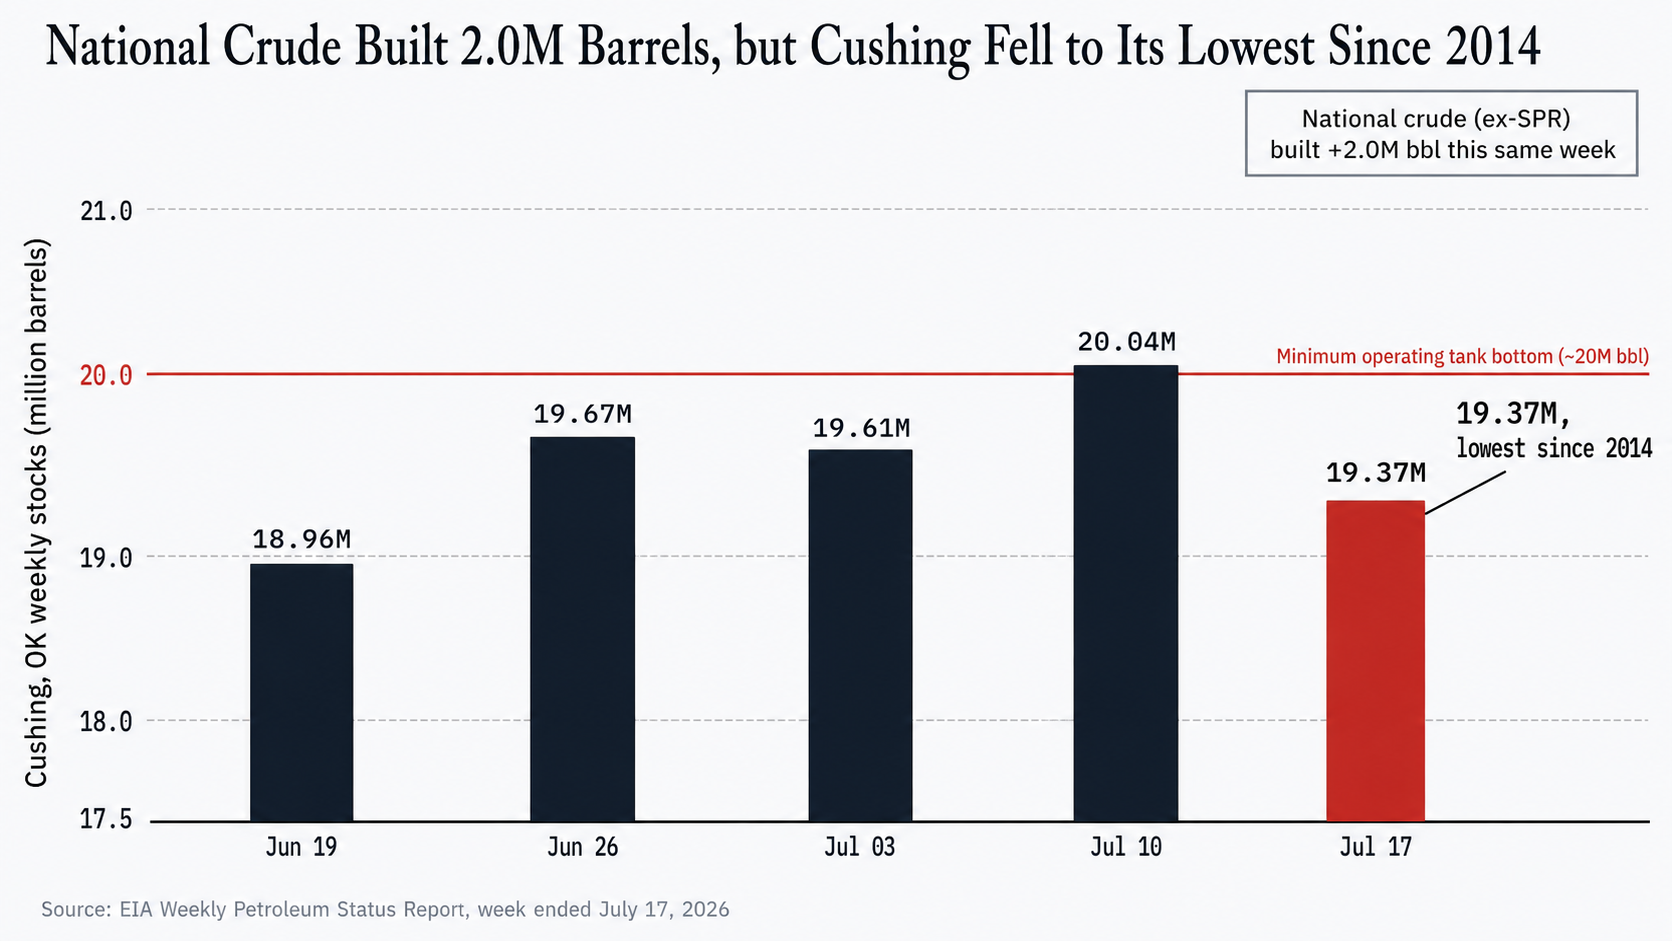
Cushing crude inventories fell to 19.37 million barrels in the week ended July 17, even as U.S. commercial crude stocks increased. Source: EIA Weekly Petroleum Status Report.
WTI Price Forecast: $86-$90 Recovery Versus $80 Invalidation
My base case for WTI crude is a recovery toward $86-$90 over the next two to four months, as the gap between Monday’s diplomatic repricing and the still unrecovered transit data closes. Call it mostly a round trip i.e. the pre crash close was near $89 ($82.61 plus its own $6.70 drop), so $86 to $90 is most of that move back, not a fresh high. In my view, the fair entry zone sits at $80 – $83, deliberately floored at the invalidation line, not set below it. Here is a fair objection. Markets should price credible probability before confirmation, not wait for data. My answer is about size i.e Monday’s move assumes more certainty than the market’s own precedent earned, since the June 18 MOU broke within three weeks and this pause sits a day removed from a fresh mine strike. Size versus evidence, that gap is the trade. A third party CME tracker put July 29 hold odds at 65.7% as of July 27, 2026, per growbeansprout.com, a secondary input here, not the driver. Invalidation: two consecutive PortWatch reads toward the 88 per day baseline, combined with Cushing resuming a multi week build above 20 million barrels, would confirm this de escalation is not like the June 18 MOU; that combination, or a sustained WTI close below $80, breaks the call.
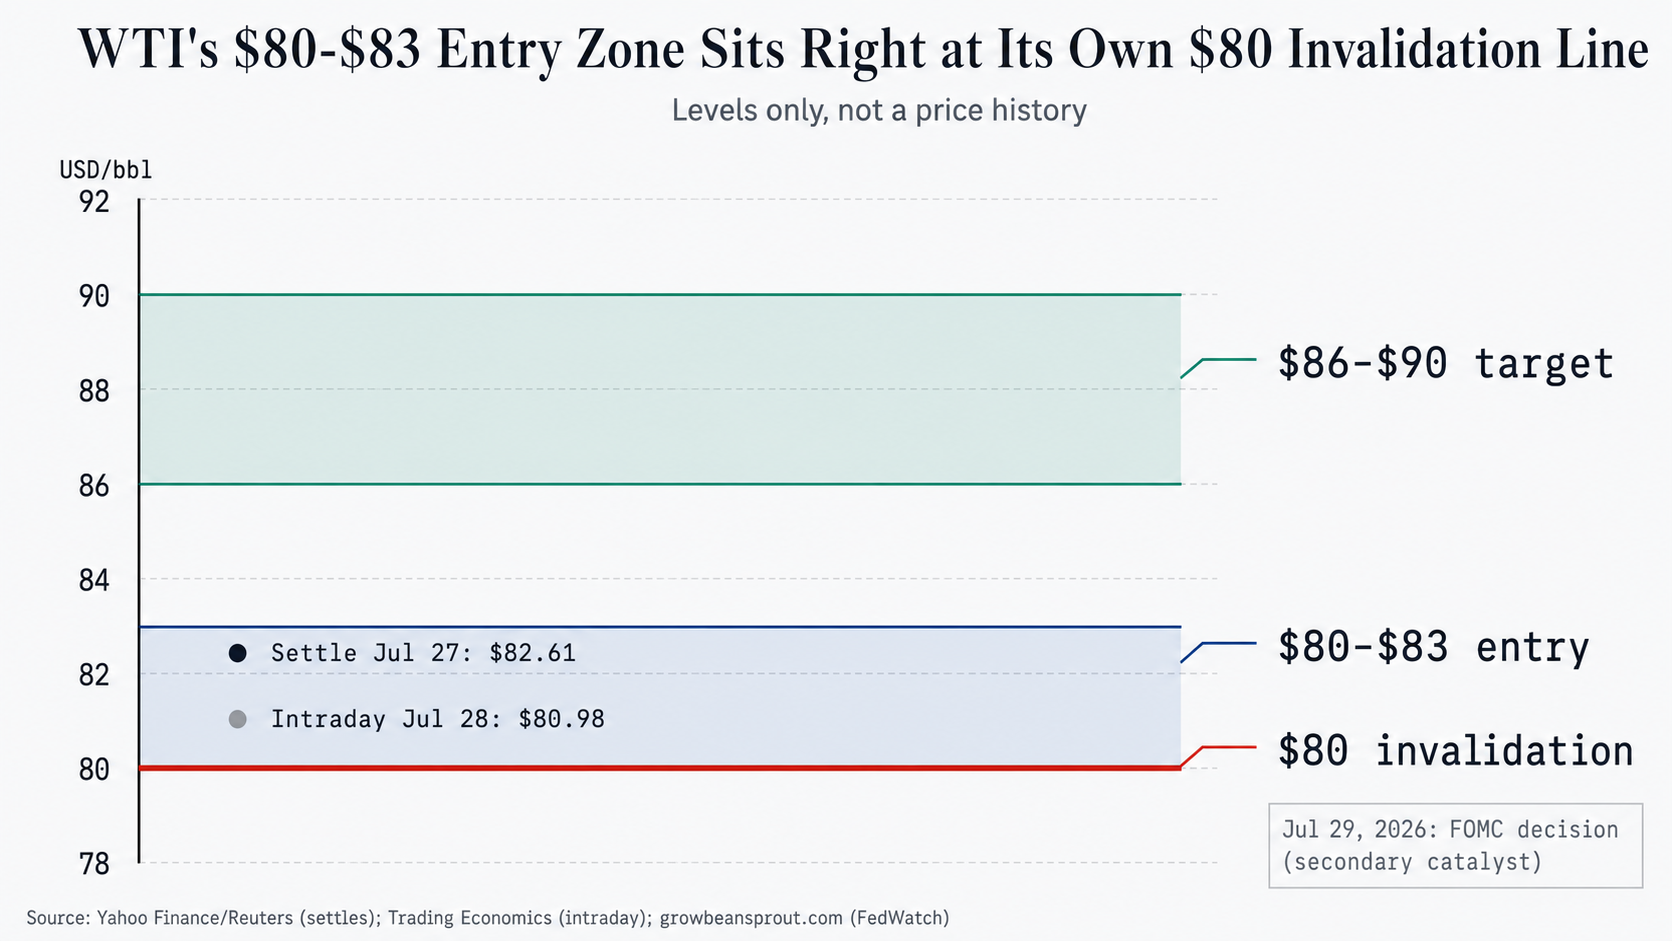
WTI price setup showing the $80-$83 entry zone, $86-$90 target range, and $80 invalidation level. Source: Yahoo Finance, Reuters, Trading Economics, and CME FedWatch via Growbeansprout.com.
The Move Lower Has Room to Partially Reverse
The base case stays WTI recovering toward $86 – $90 over two to four months, or a break below $80 if transit data actually confirms the strait reopening. The bigger picture this is the latest in a pattern of priced in Hormuz de escalations that have not held this year. My July 7 call carries the same methodology: written when WTI traded below $68, it set a base case of $74 to $76 on a similar gap between positioning and the physical data. WTI printed $82.61 on Monday, already through that old target. The same kind of gap, this time in verified shipping data, is why I think the move lower has room to partially reverse. The FX Empire Economic Calendar has the July 29 decision and the next scheduled EIA inventory release.