


Platinum (XPL) consolidates below $1,900 as investors weigh tight inventories against weak investment and consumer demand. WPIC expects a surplus of 265,000 ounces in 2026. This mainly reflects investment outflows rather than strong supply growth. But the high Treasury yields, weak Chinese demand and rising oil prices create downside risks. The $1,900 resistance now holds the key to the next move. In my view, the outlook remains bullish above $1,700 but platinum must break $1,900 to target $2,200-$2,300. This article examines the latest macro developments and technical structures to understand the next move in platinum.
Platinum Fundamentals: WPIC Surplus and Fed Rate Risks
WPIC Forecasts a Platinum Surplus Despite Tight Inventories
Platinum is trading around $1,860 an ounce on Wednesday. The price has gained over 8% in August. But the latest report published by the World Platinum Investment Council (WPIC) shows mixed prospects. It forecasts a surplus of 265,000 ounces in 2026. This was due to investment outflows in the first half of the year. The expected surplus could limit some price gains in the near term.
The outlook for demand is also mixed. WPIC expects a net investment outflow of 83,000 ounces this year. The jewelry demand could decline by 15% due to high prices and sluggish Chinese demand. Automotive demand could decline 4%. But the demand for industrial use could rise by 5%. This development should provide some support. Moreover, previous deficits have already reduced inventories. By end of the year, above-ground stocks could cover just 3.4 months of global demand. Therefore, this modest surplus does not alleviate the risk of tight supply.
Fed Rate Risks, China Demand and Oil Prices Shape Platinum Outlook
The softer U.S. dollar is also supporting the recovery in platinum as it makes the metal less expensive to buyers outside the U.S. But the risk of interest rates is still high. The market now expects a 60% chance of a rate hike in September. The 10-year Treasury yield is also high at around 4.80%.
The yields can gain further momentum if CPI and PPI data are hot. This data puts pressure on platinum. Softer inflation would reduce the expectation of a rate hike and support another price advance. The chart below shows that consumer and producer inflation has eased slightly, but still remains high.
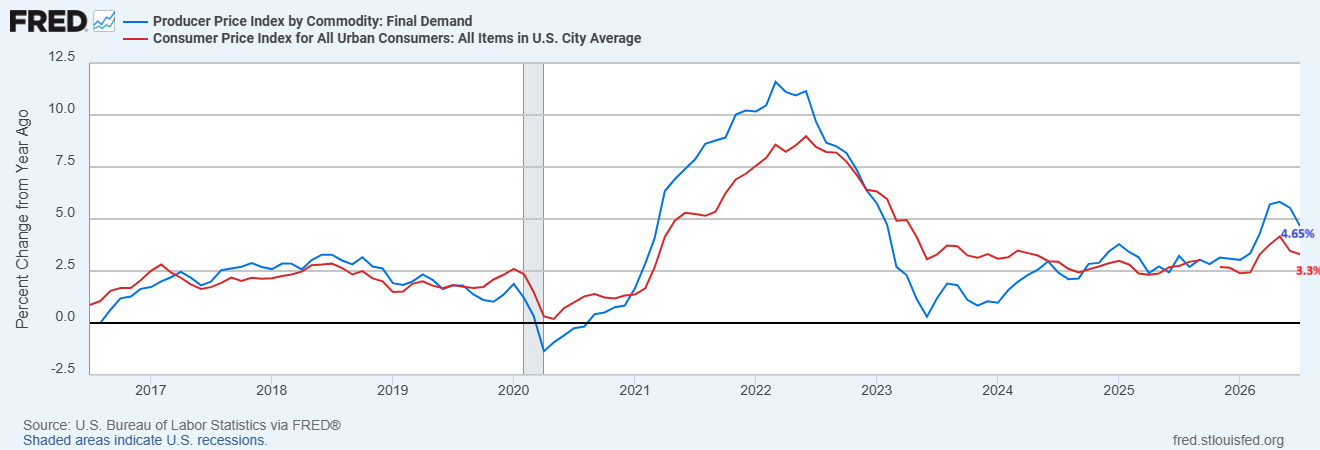
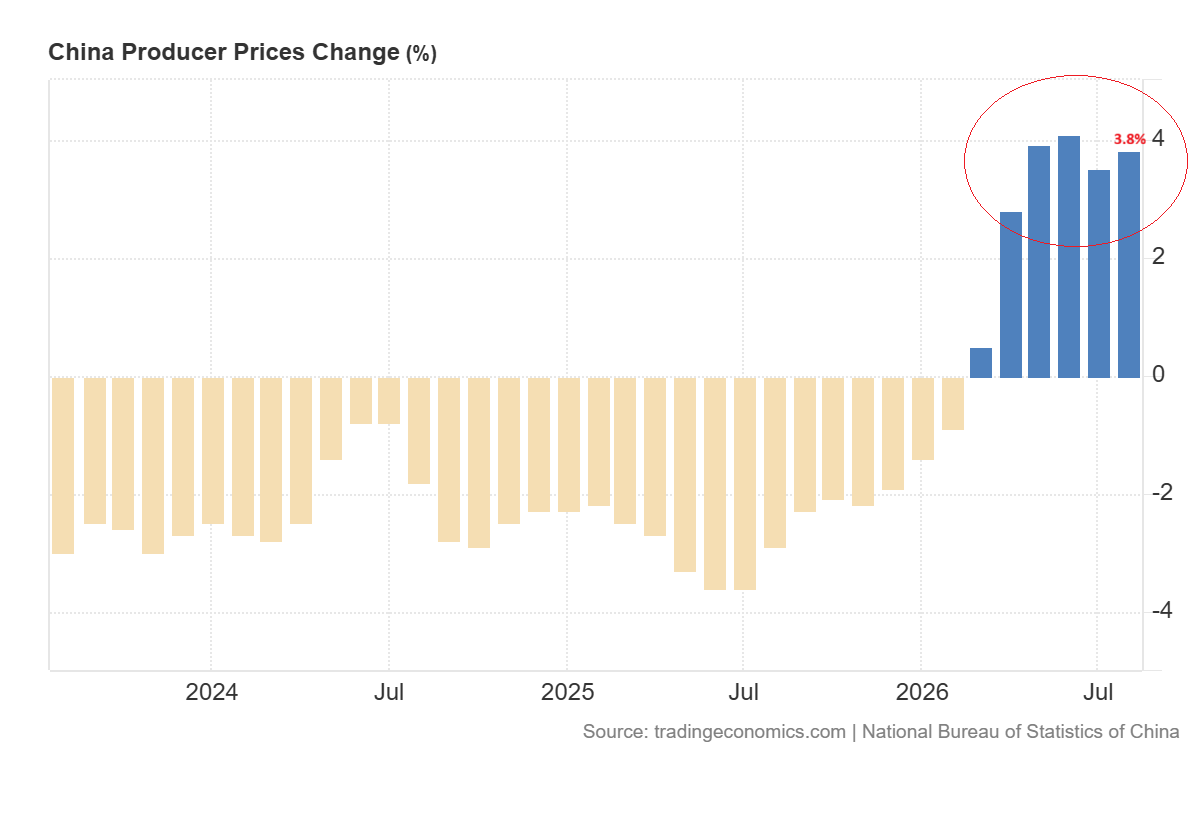
The producer inflation rate in China rose to 3.8% in August compared with 3.5% in July.
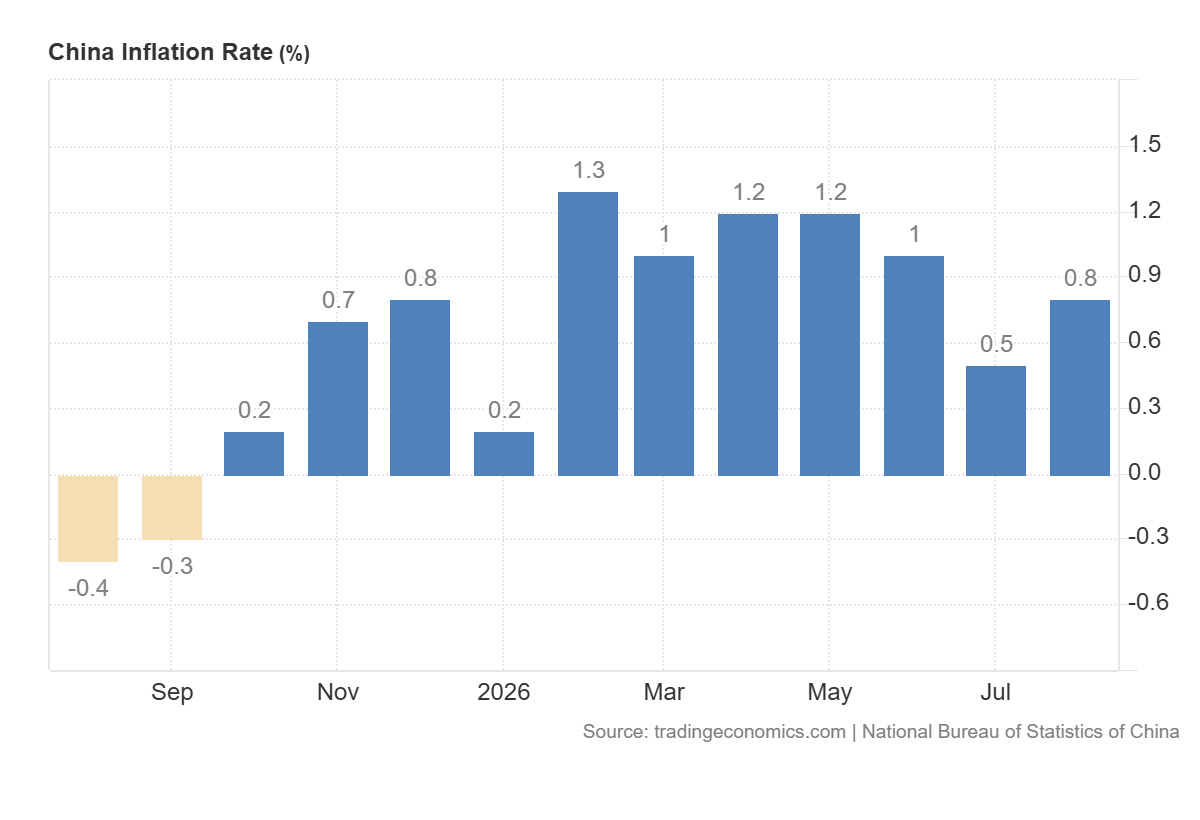
The consumer inflation rate has also risen to 0.8%. But core inflation was still low at 1%, which indicates that domestic demand is still weak.
Meanwhile, Brent crude climbed over $100 as tensions in the Middle East escalate. Oil prices may increase the demand for hard assets, but they raise production costs and threaten industrial growth. In my view, the macro outlook for platinum remains mixed. A weaker dollar and low inventories provide support, while the new surplus forecast, weak Chinese demand and the risk of Fed rate hike may limit the upside.
Platinum Technical Analysis: $1,900 Breakout in Focus
Platinum prices formed bottoming price action in June and July and broke the $1,700 area, pushing prices towards the $1,900 resistance in August 2026. After hitting the $1,900 resistance, the price briefly moved back toward the $1,700 support area and produced a bullish hammer candle on 2 September 2026.
After producing this bullish hammer candle, the price again pushed toward the $1,900 area before the inflation data release. Now the price looks for the next move.
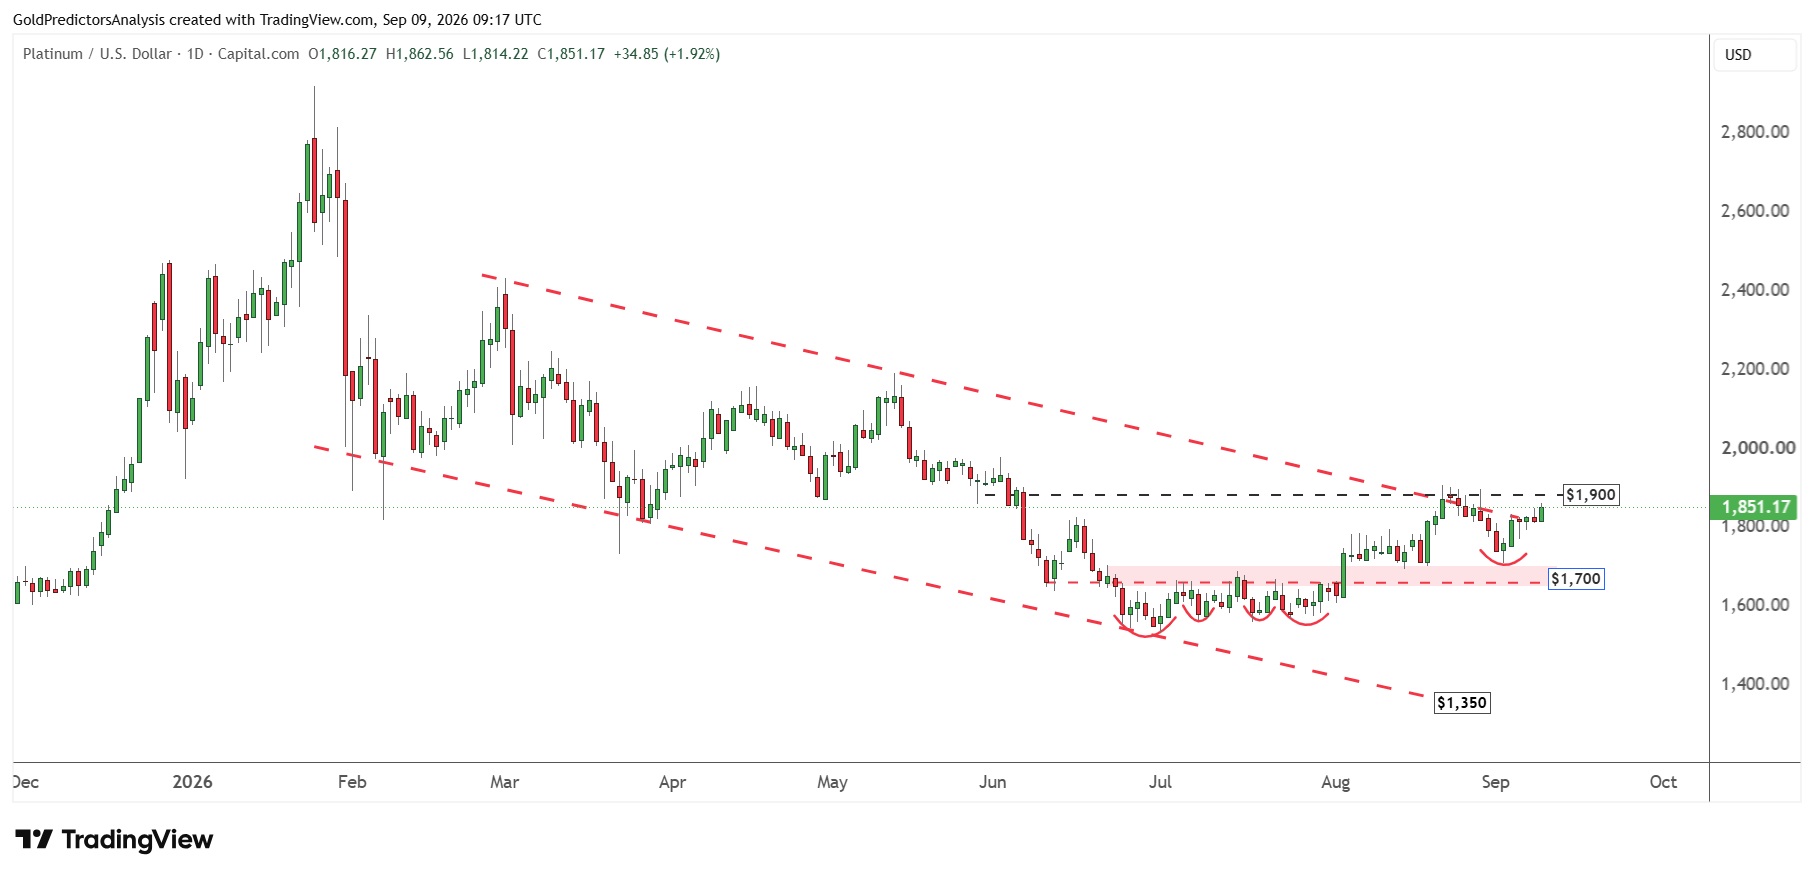
A break above $1,900 this time will likely break the descending channel pattern that stretches from the March 2026 highs. This breakout will likely open the door for a strong move towards the $2,200 area in the next few weeks.
On the other hand, if platinum fails to break above $1,900 and breaks below the $1,700 area, this will likely push prices further down toward the $1,350 region. The bullish price action in platinum is further observed on the chart below. The chart shows the formation of rounding bottom patterns since 2025.
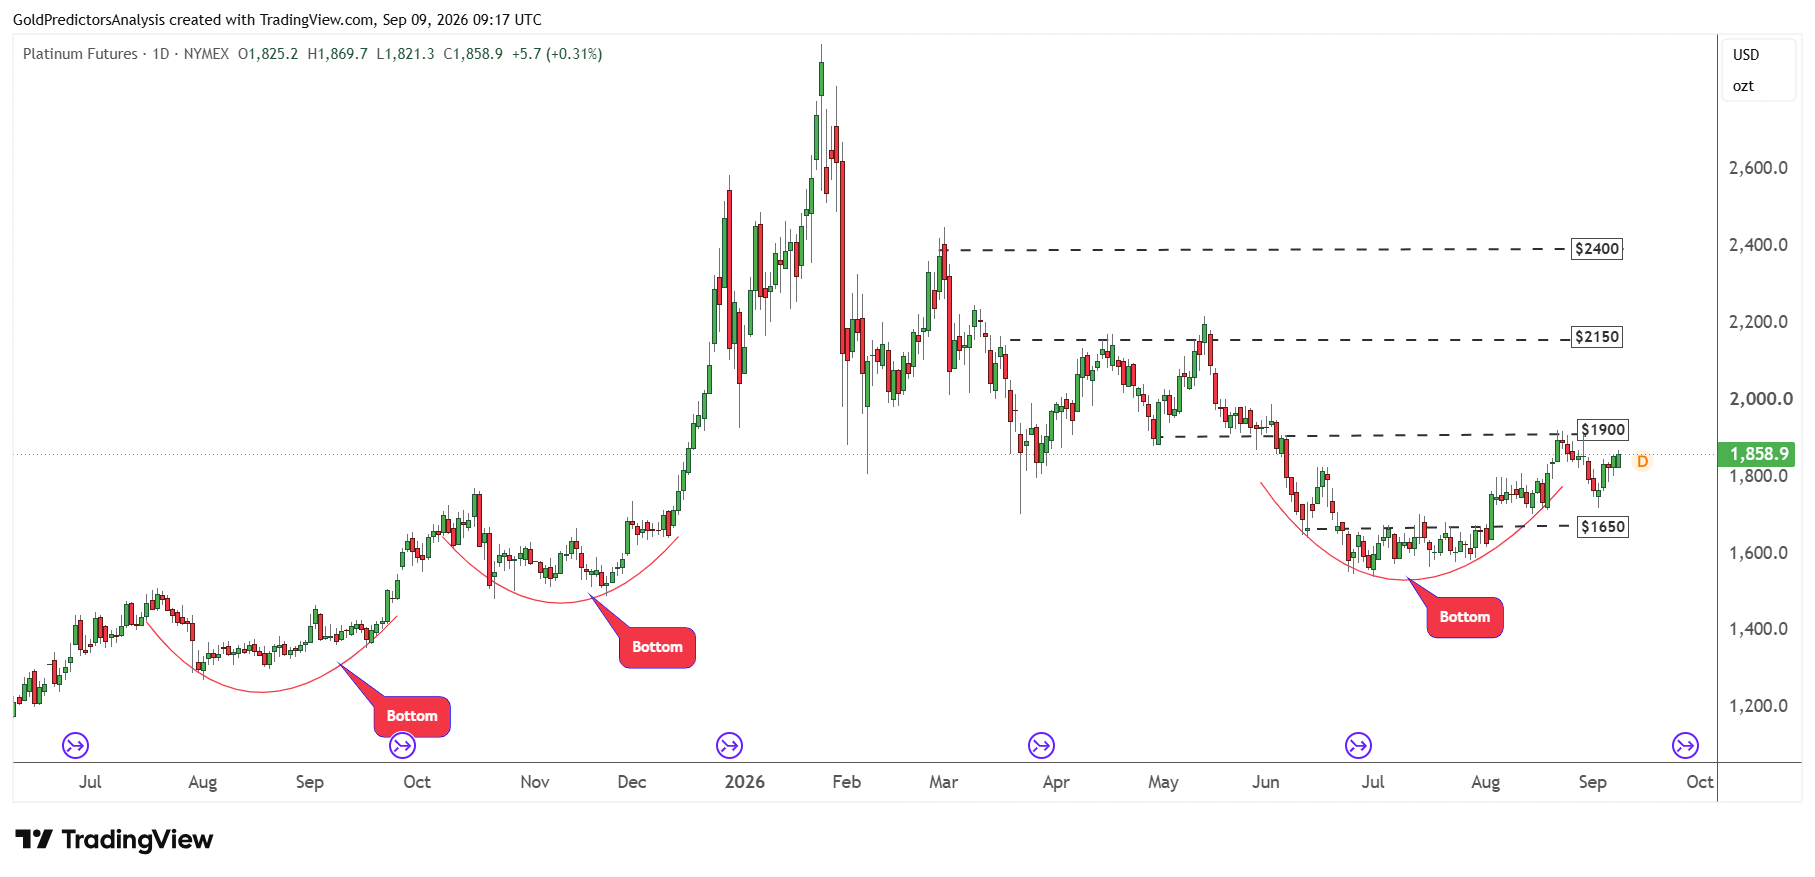
The chart shows that the price formed a bottoming action from July to August 2025 and initiated a strong surge in October 2025. Then, price formed another rounding bottom pattern from October to December 2025 and surged to a record high in January 2026.
Now, platinum is again forming a rounding bottom pattern during the consolidation in June and July and is looking to break higher above the $1,900 area. However, to confirm this bottom, the price must break above $1,900, which will open the door for a strong rally towards the $2,200 to $2,300 resistance area.
Long-Term Platinum Forecast: Can Prices Reach $2,300?
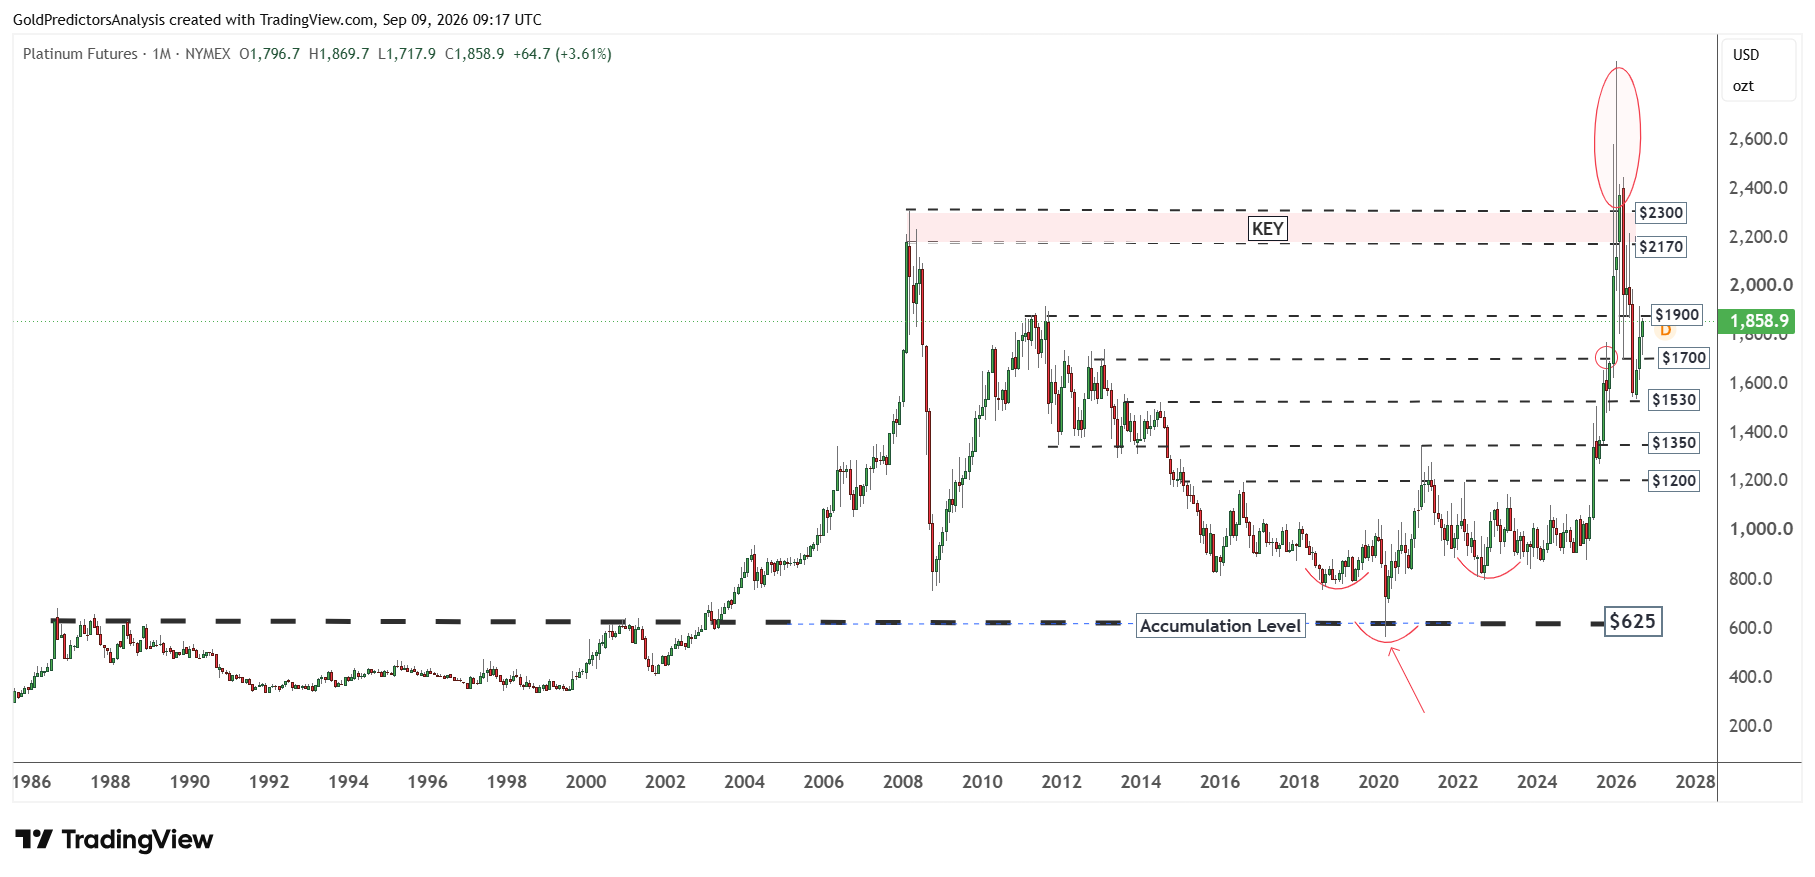
The $1,900 resistance is evident on the monthly chart. This resistance is marked by the 2011 highs. A break above the 2011 highs around the $1,900 area will likely open the way for strong rally toward the $2,200 to $2,300 resistance, which remains the key resistance level in the long term.
The formation of an inverted head and shoulders pattern above the long-term accumulation zone of $625 and the positive momentum over the past few months suggests positive price action in the platinum market.
Platinum Downside Risks: Why $1,700 Support Matters
The primary downside risk is related to the decline in demand and tighter monetary policy. In 2026, WPIC is projecting a surplus and investment outflows. Jewelry and automotive demand may also decline. Weak Chinese consumption could exacerbate this pressure.
If the U.S. inflation data is hot, it will create another risk. The hot inflation data may push Treasury yields and US dollar higher. Higher oil prices may slow industrial activity by raising production and transport costs. From a technical perspective, a break below $1,700 will increase the risk of a drop to the $1,350 zone.
What to Watch Next
Platinum remains caught between weak investment demand and tight available inventories. The projected surplus may limit gains in the near term. But this surplus mainly reflects investment outflows rather than major increase in supply. The above-ground stocks may cover only 3.4 months of global demand. This limited buffer should provide some support to the price.
The next move will depend heavily on U.S. inflation data. Hot CPI and PPI readings could raise expectations of a rate hike in September. This may push Treasury yields and the U.S. dollar higher, which would pressure platinum. Softer inflation could produce the opposite result. Chinese demand and oil prices also remain important. Weak consumption and rising production costs could slow industrial and jewelry demand.
The $1,900 area remains the key technical level for platinum. A confirmed break above this resistance could complete the rounding bottom pattern and open the way towards $2,200-$2,300. But another rejection could return the price to $1,700. A break below that support would increase the risk of a decline towards $1,350. In my view, the long term structure remains positive but platinum must break above $1,900 to confirm the next bullish phase.