


Platinum (XPL) dropped toward $1,700 on Tuesday as higher oil prices raised concerns about inflation and another rate hike by the Fed. Treasury yields above 5% and a strong US dollar further increased the pressure on the platinum market. Traders now await US inflation data, the jobs report and factory survey from China for clues about the next move. In my view, platinum needs to break above $1,900 to continue the positive trend. This article presents the main market drivers, key price levels and ratio signals that could shape the next move in platinum.
Platinum Fundamentals: Oil Above $100 and 5% Yields Pressure Prices
Spot platinum dropped over 1% to $1,697 an ounce on Tuesday, extending Monday’s decline. Brent crude oil trades near $103 as concerns about supply in the Middle East continue, even as US and Iranian officials spoke separately with mediators.
The positive trend in oil prices raises inflation concerns. That keeps the prospect of another rate hike by the Fed in focus.
The US 10-year Treasury yield climbed above 5.27% on Monday. The US dollar index also held near a two-month high on Tuesday. The expectations of another Fed rate hike in October have increased to 72.5%, up from 57.6% a week ago. The higher yields make platinum less attractive because it pays no interest. A stronger US dollar can also make the metal more expensive for buyers outside the US.
China brought a separate development. The qualified foreign investors could trade platinum and palladium futures and options on the Guangzhou Futures Exchange. This wider access may improve trading liquidity and give Chinese prices more influence.
The market expects the September factory survey in China to edge into growth. This data will be released on Wednesday. A stronger reading could improve sentiment toward industrial demand for platinum.
The market now waits for the PCE inflation data on Wednesday and the September jobs report on Friday. The softer inflation could ease pressure on yields and give platinum room to recover. But the strong inflation and employment would keep another rate hike by the Fed in focus and make a lasting rebound harder.
Platinum Technical Analysis: $1,700 Support Faces a Monthly Close Test
Platinum prices remain under bearish pressure after a rejection at the key level of $1,900. The resistance of $1,900 comes from the descending trendline that extends from the highs of March 2026.
The immediate support after this rejection is $1,700. A break below $1,700 will likely lead to a sharp drop toward the next support at $1,350 to $1,400. As long as the price remains below $1,900, the possibility of a downside breakout is higher.
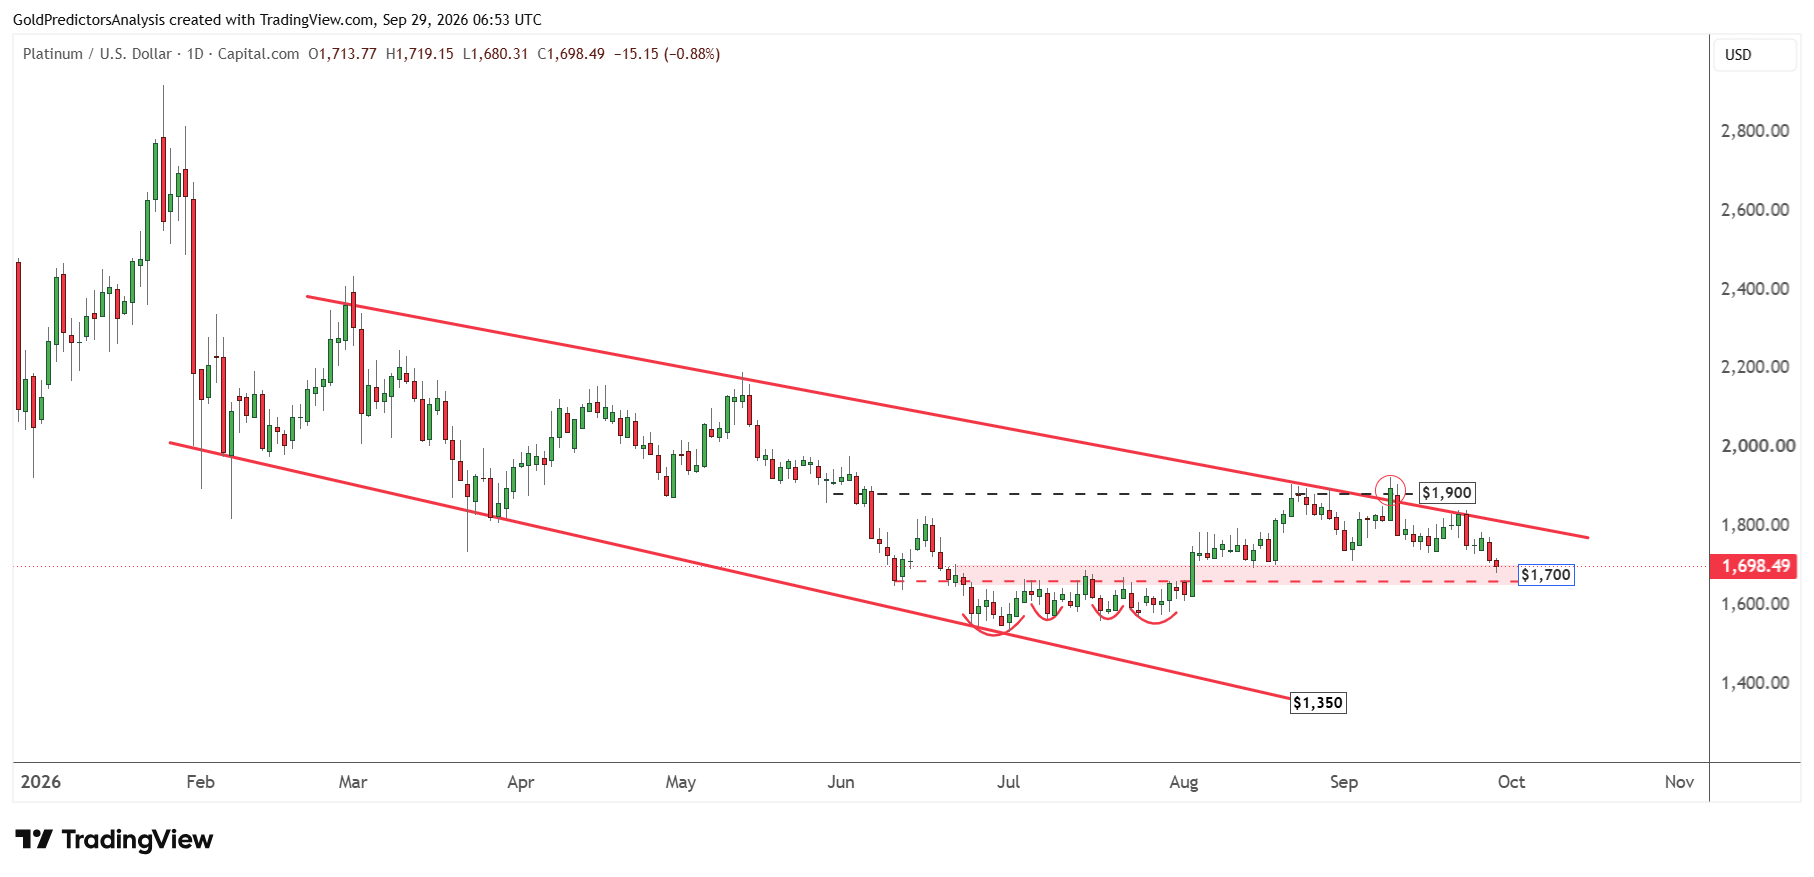
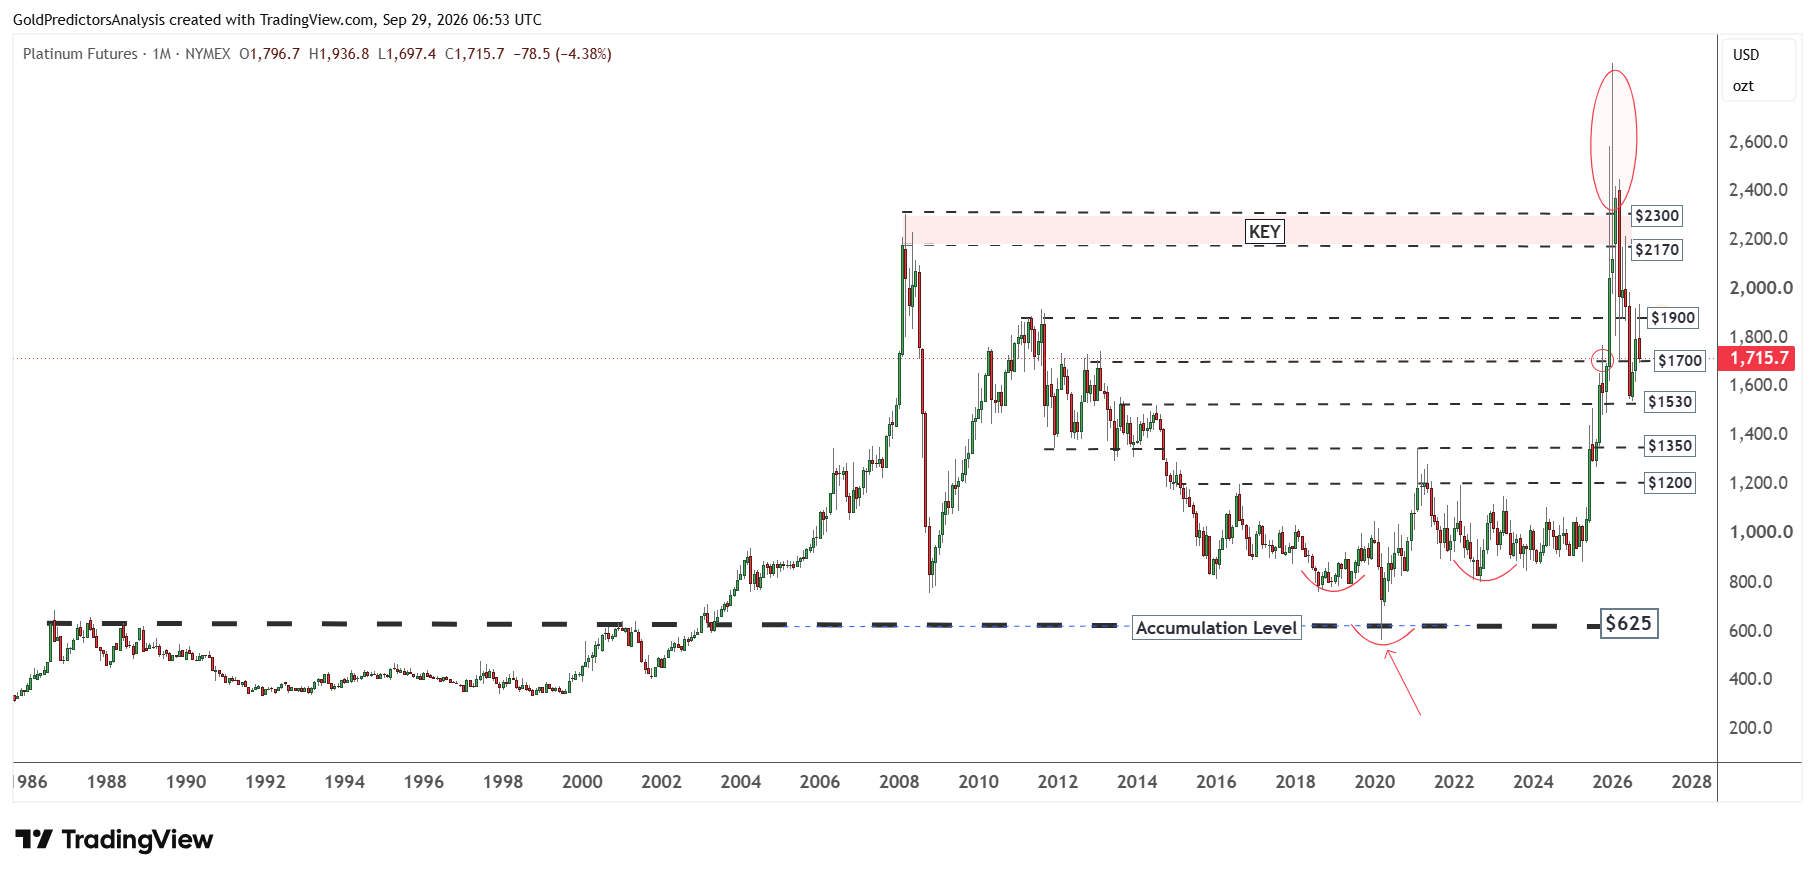
The negative price action in the short term is also visible on the monthly chart, which shows sharp shadows on the August and September candles. The price has hovered around $1,700 during the last few days of September and is looking for the next direction.
A monthly close below $1,700 will indicate that prices will likely drop toward $1,530 in October as the initial support. A break below $1,530 will likely lead to another drop in platinum prices toward the $1,350 and $1,200 region.
As long as platinum remains above $1,200, the possibility of another rebound toward $1,700 is high. On the other hand, a break above $1,700 or $1,900 will likely lead to another rally toward $2,170.
Platinum vs. Gold and Silver: Relative Strength Still Needs Confirmation
Gold-to-Platinum Ratio: A Break Below 2.20 Would Favor Platinum
The gold to platinum ratio rose within an ascending broadening wedge from 2014 and reached about 3.59 in 2025. The ratio then dropped toward support near 1.80 as platinum gained ground against gold. The ratio has since rebounded to 2.45. It has eased slightly in September, but the long shadows on the monthly candle support a bullish view for the ratio.
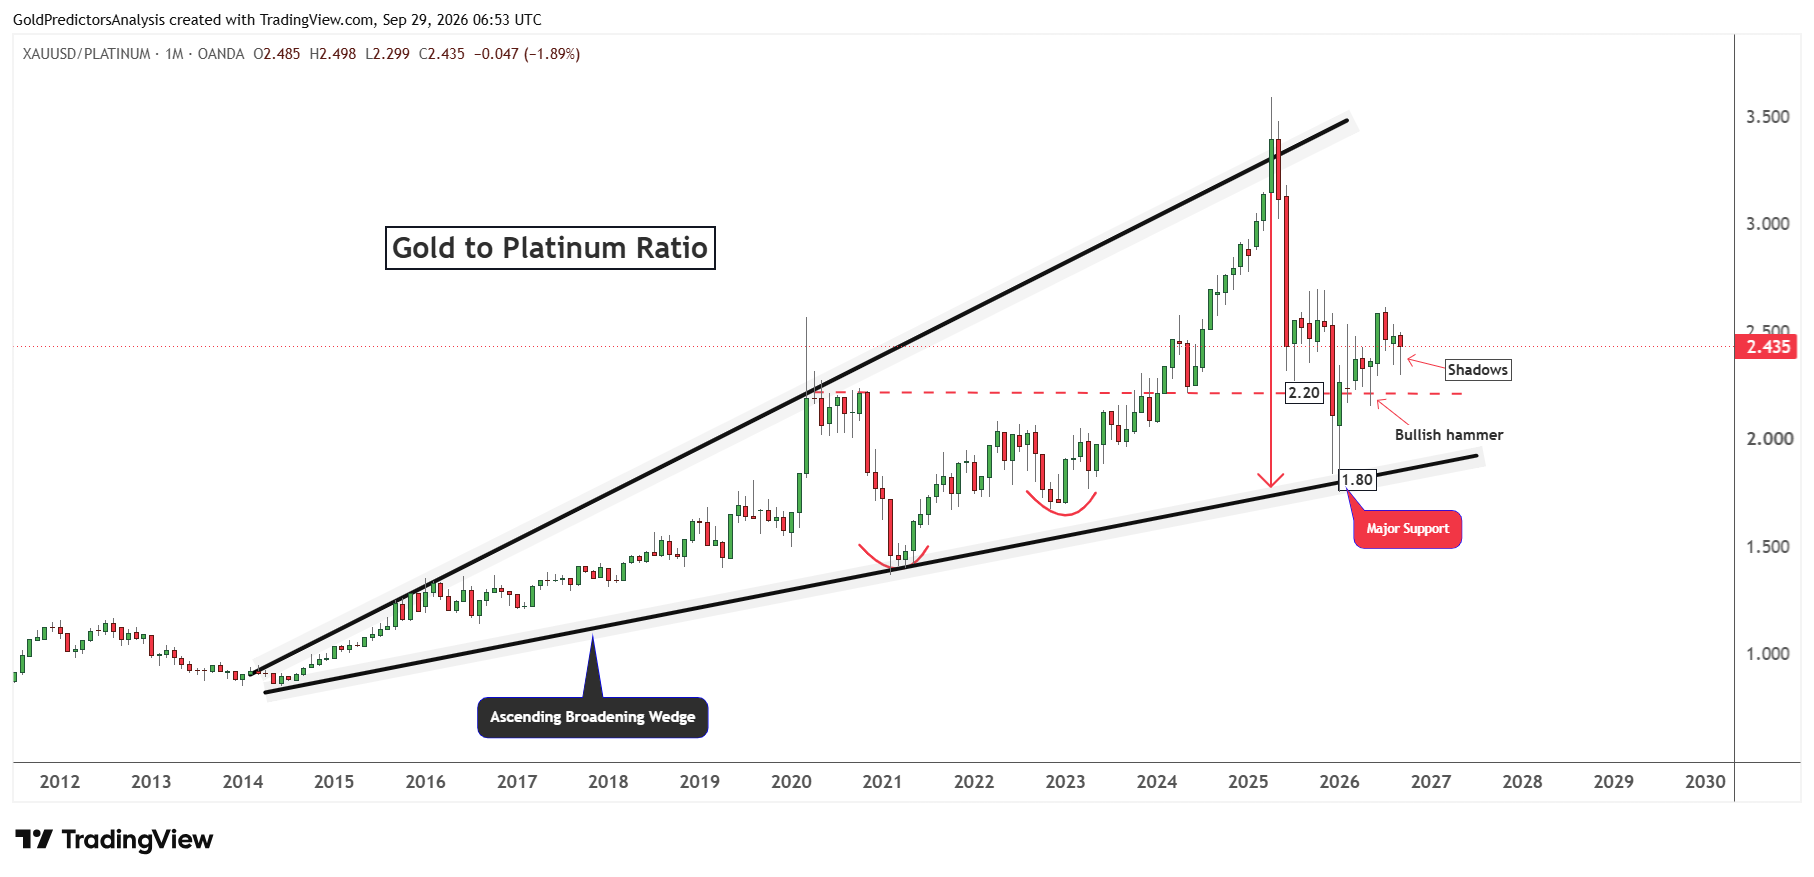
The 2.20 level is the key level. A bullish hammer has formed near this key level on the chart and the ratio remains above it. If the ratio falls below 2.20 and stays below that level, platinum would shift higher against gold again.
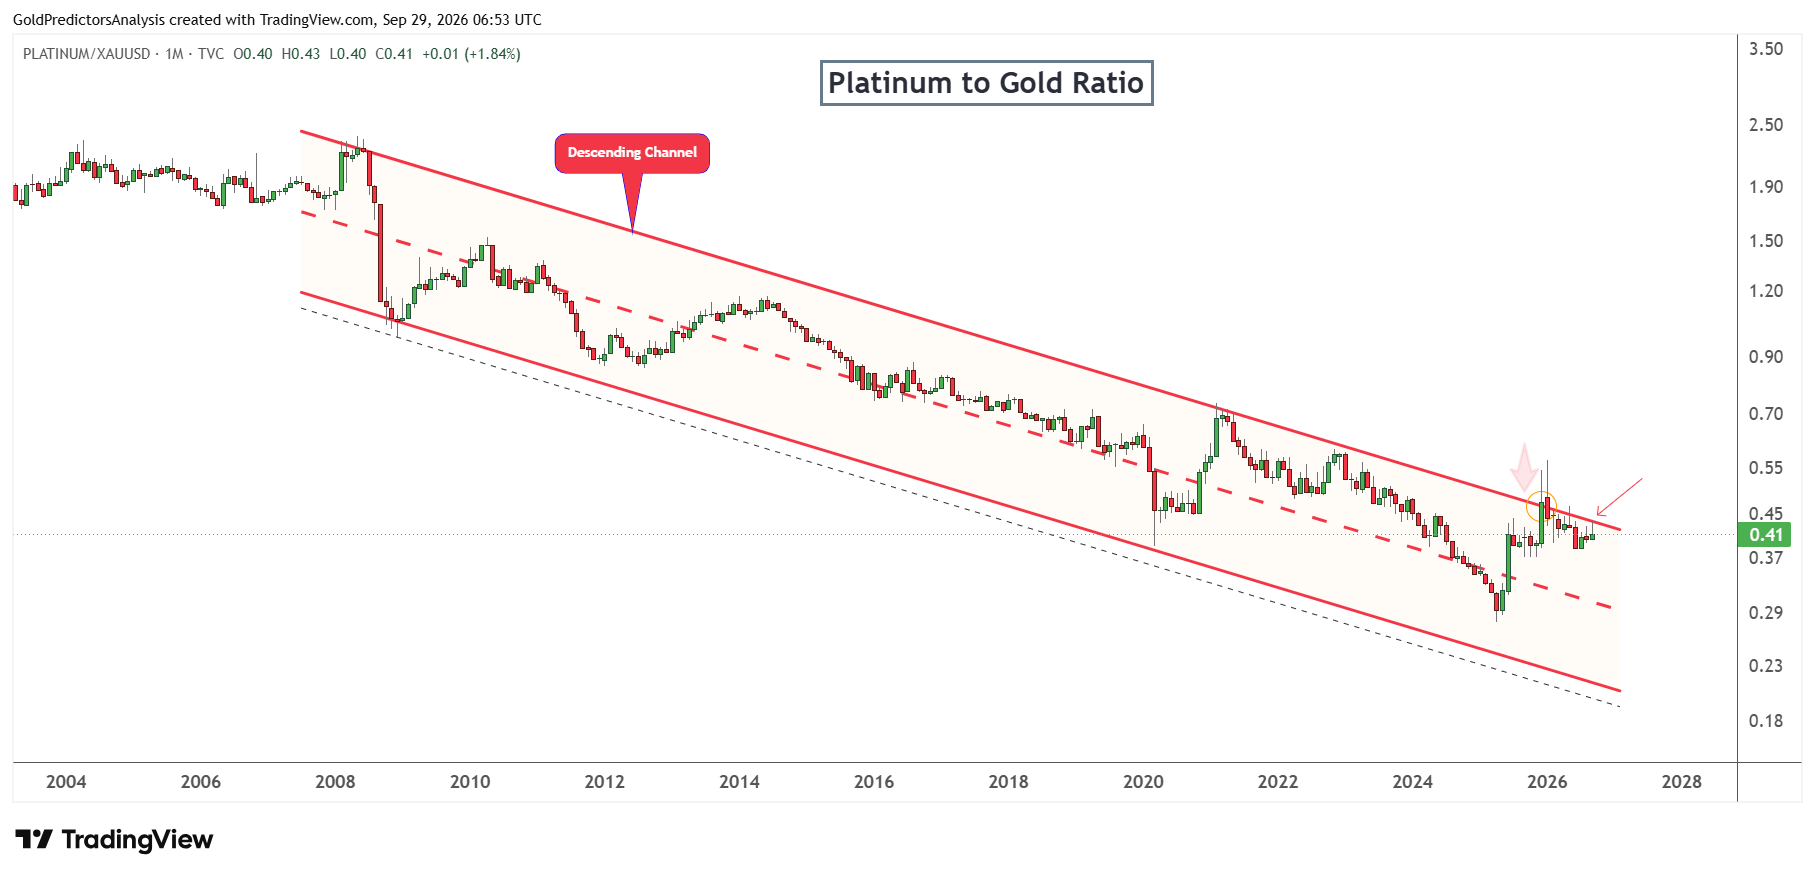
The platinum to gold chart shows the same relationship in reverse. The ratio sits near 0.41 after a rise toward 0.57 at the upper edge of descending channel that dates back to 2008. A monthly close above 0.47 would provide stronger evidence of a change in the performance of platinum against gold in the long term. These two charts show one relationship from opposite directions so they need the same breakout to confirm the move.
Platinum-to-Silver Ratio: A Break Above 29 Could Signal Strength
The platinum to silver ratio provides a different test. The ratio has been trading within a wedge for many years. Each rally in the ratio repeatedly stopped at the descending trend line of the wedge. The ratio broke below the lower line and later dropped toward 22.21. The rebound from this level back to 28.50 has brought it back to that former support.
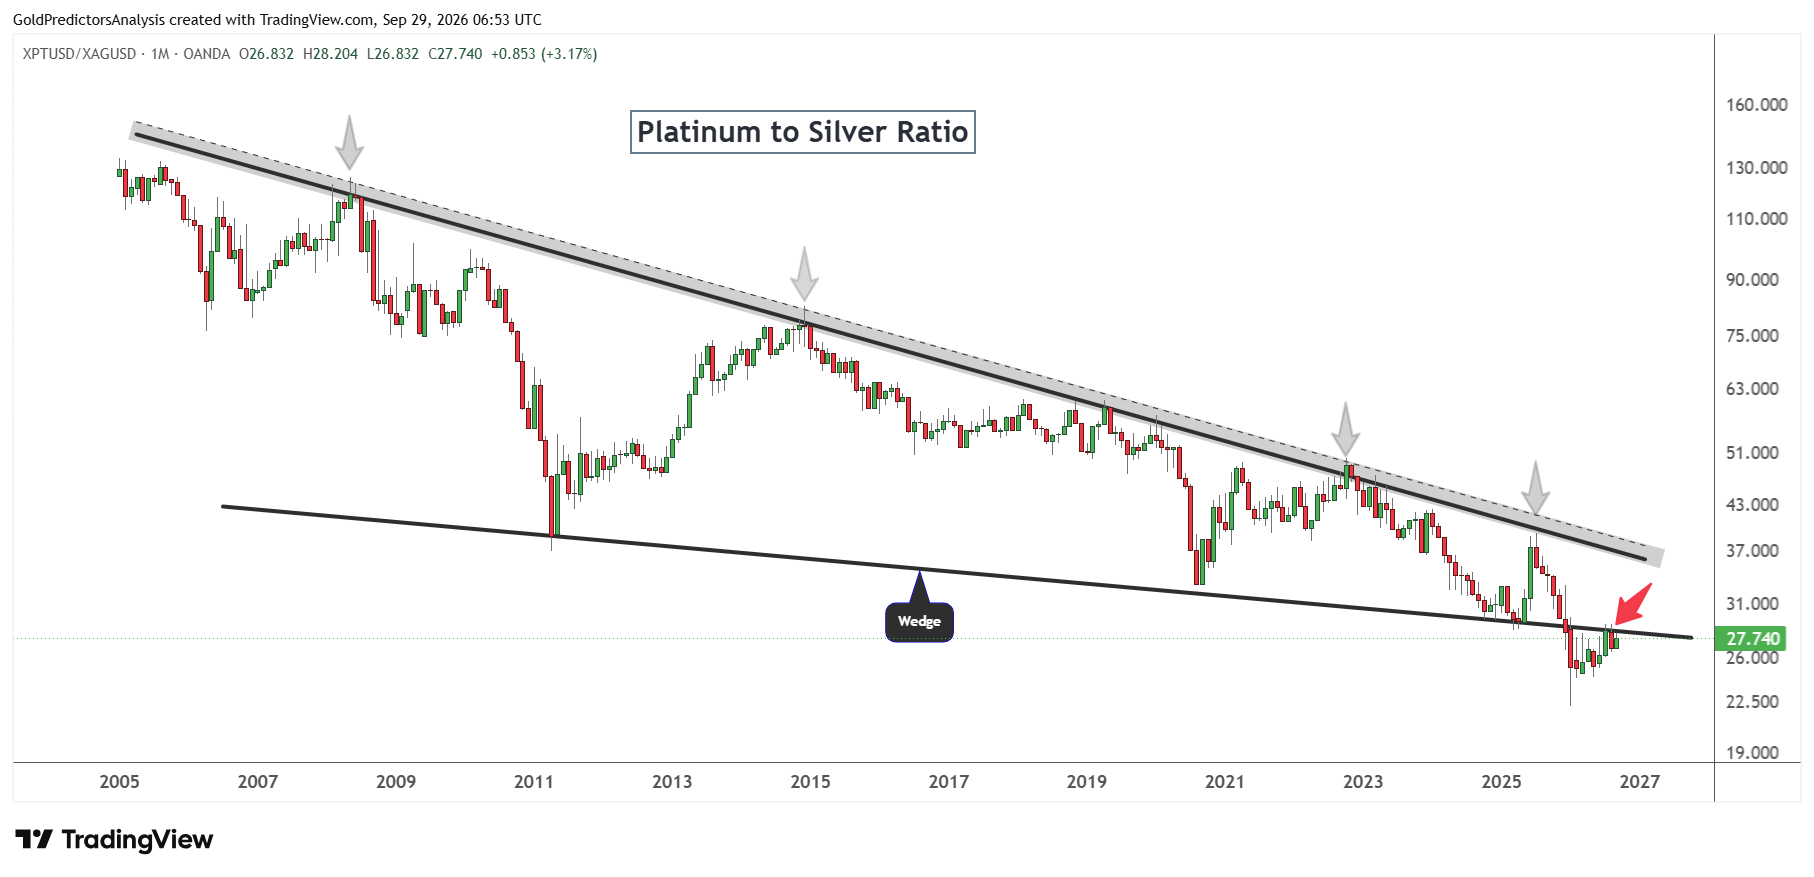
The monthly candle for September briefly reached 28.20 but the ratio remains below the line. A monthly close above 29 would suggest that platinum is starting to regain ground against silver. But another rejection at the 29 level would suggest that the recent rally is a bounce within the broader decline.
If the price of gold remained unchanged, a fall in the gold-to-platinum ratio from 2.44 to 2.20 would push the platinum to the resistance of $1,900.
In my view, the rebound in platinum would carry more weight if the gold-to-platinum ratio broke below 2.20 and the platinum-to-silver ratio reclaimed the 29 level. For now, platinum has shown some relative improvement but the monthly closing level for September is required to understand a clearer view.
Platinum Risk Analysis
The main downside risk in platinum comes from the oil market and interest rates. If oil prices remain high, inflation concerns may keep Treasury yields and US dollar elevated. This scenario would make it harder for platinum to recover from the support. If platinum prices consolidate around $1,700, it will increase the risk of downside move.
A weak China factory report would add concern about the demand from industries. A monthly close in platinum below $1,700 could open the way for a drop to $1,530. A drop in the platinum-to-silver ratio below 25 would further increase pressure on the platinum market.
If oil prices continue to drop below $100, it may ease pressure on yields and US dollar and support a recovery in the platinum market. A strong factory reading from China could also improve confidence in demand for platinum. If the price breaks above $1,900, the recovery would look more convincing. A break above 0.47 in the platinum-to-gold ratio would suggest that platinum is gaining ground against gold.
What to Watch Next in Platinum
Platinum faces a test near $1,700 as high oil prices keep inflation and another rate hike by the Fed in focus. The surge in yields and a strong US dollar add further pressure to the platinum market. A monthly close below $1,700 would bring $1,530 into view. If that support fails, the decline could extend toward $1,350-$1,400.
A stronger recovery in the platinum market needs relief from Treasury yields and the US dollar. Softer US inflation could provide that relief while the strong factory reading from China could improve confidence in industrial demand. If platinum recovers from current levels and breaks above $1,900, it could move toward $2,170. A gold-to-platinum ratio below 2.20 and a platinum-to-silver ratio above 29 would make that recovery more convincing.
Read more: Hawkish Fed Caps Rebound in Platinum as Dollar Rises