


Silver (XAG) remains under pressure as high energy prices and a strong US dollar limit the recovery. The strength in the activity for US factories supports the industrial outlook, while slower hiring and growth in wages could give the Fed more room to pause. But inflation risks keep traders cautious ahead of the October 27-28 meeting. Silver is now moving towards the $55-$56 support zone as the price structure remains weak in the short term. In my view, the broader $50-$55 area remains critical, while a break above $72 would strengthen the recovery. This article presents the main economic drivers, the technical outlook for silver and the key technical levels that may change the outlook.
Silver Fundamentals: Inflation Risks and Fed Rate Expectations
Oil Prices and High Treasury Yields Limit Silver’s Recovery
High energy prices keep inflation risk in focus. The 10-year Treasury yield reached 5.35% in October, which is the highest level since 2002. The chart below shows that the oil prices and 10-year breakeven inflation have also shown a strong correlation after the US-Iran war.
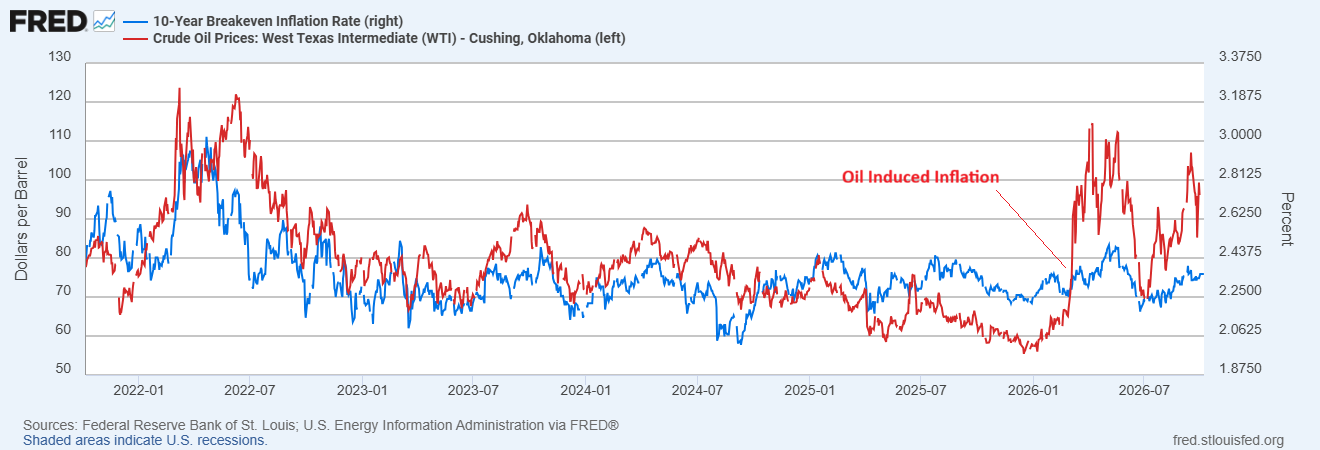
This indicates the sensitivity of the market to the cost of energy. The high inflation can encourage buying in precious metals, but expectations for tighter monetary policy could limit the recovery in silver.
Slower US Hiring and Wage Growth Ease Fed Hike Pressure
The jobs data for September give the Fed more room to wait at the October 27-28 meeting. The chart below shows that the nonfarm payrolls increased by 29,000, down from a revised 133,000 in August.
Brent Oil Price Forecast
Every new Brent Oil analysis as it publishes, today's technical signal and key levels, live price — on one page.
See all Brent Oil forecasts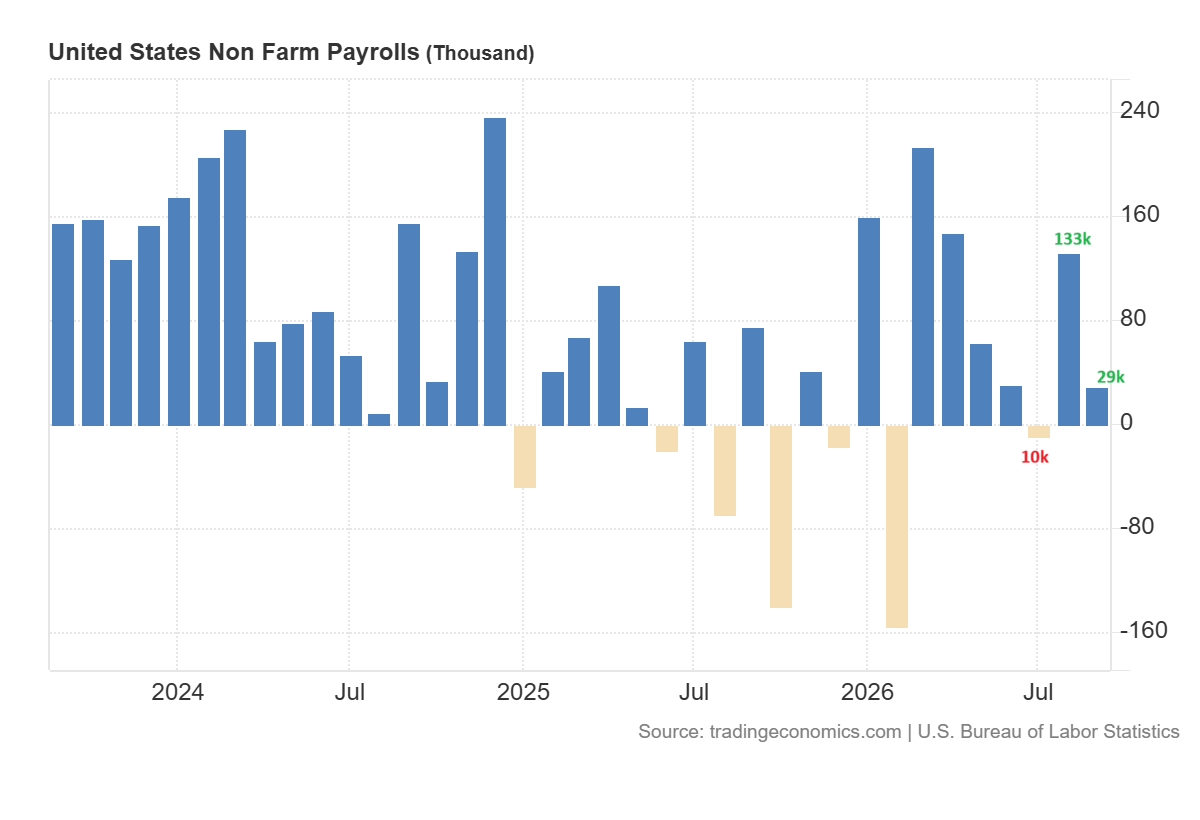
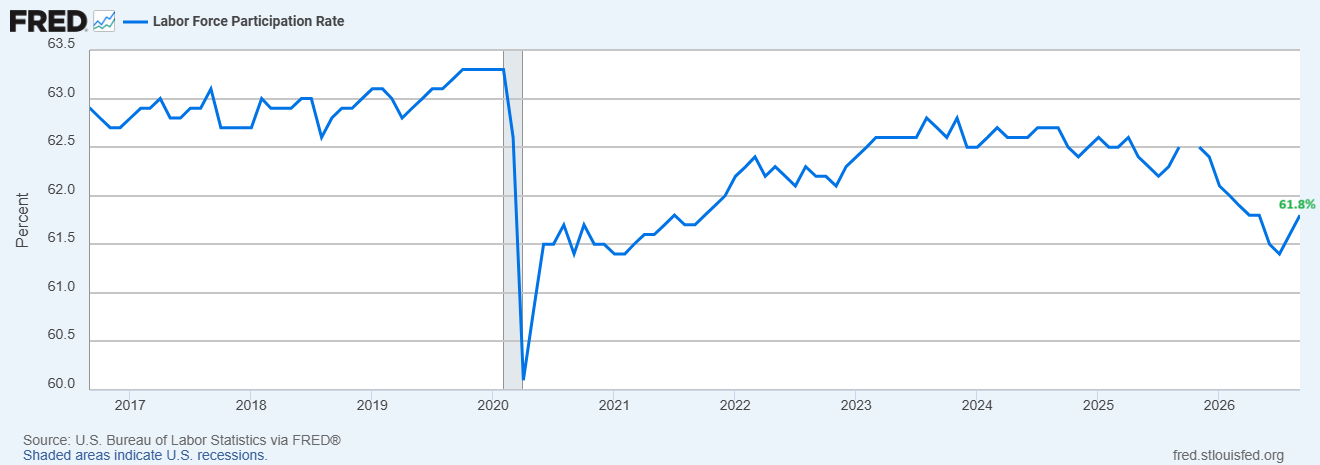
The unemployment rate edged up to 4.2% from 4.1%. But the labour force participation also increased to 61.8% from 61.6%. This means that more people entered the workforce than found employment, which helps explain the increase in unemployment.
The employment in cyclical sectors presents a strong picture. The chart below shows that the combined payrolls in manufacturing, construction, and transportation and warehousing have recovered most of their losses from 2025.
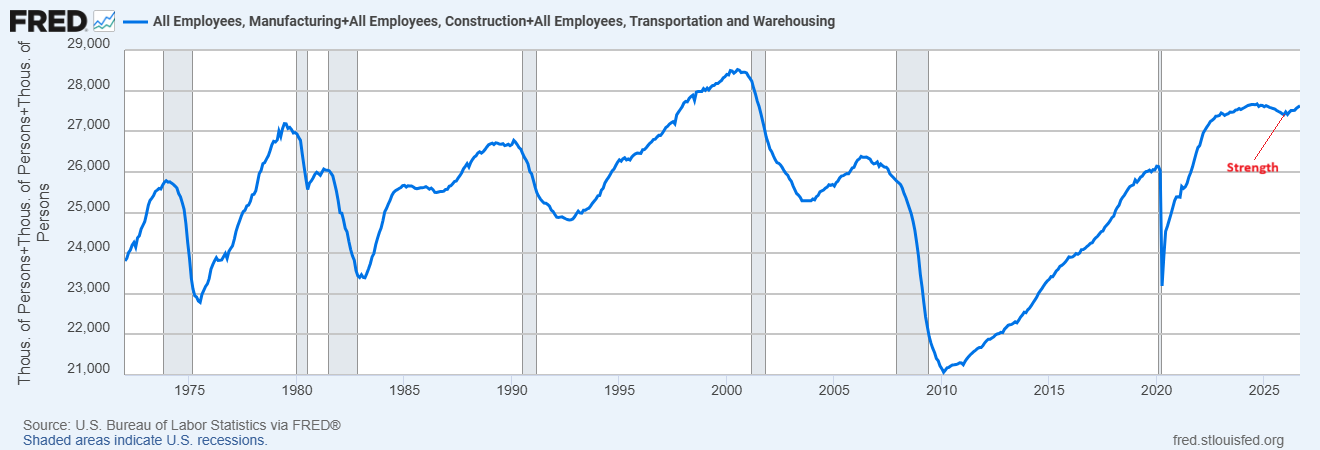
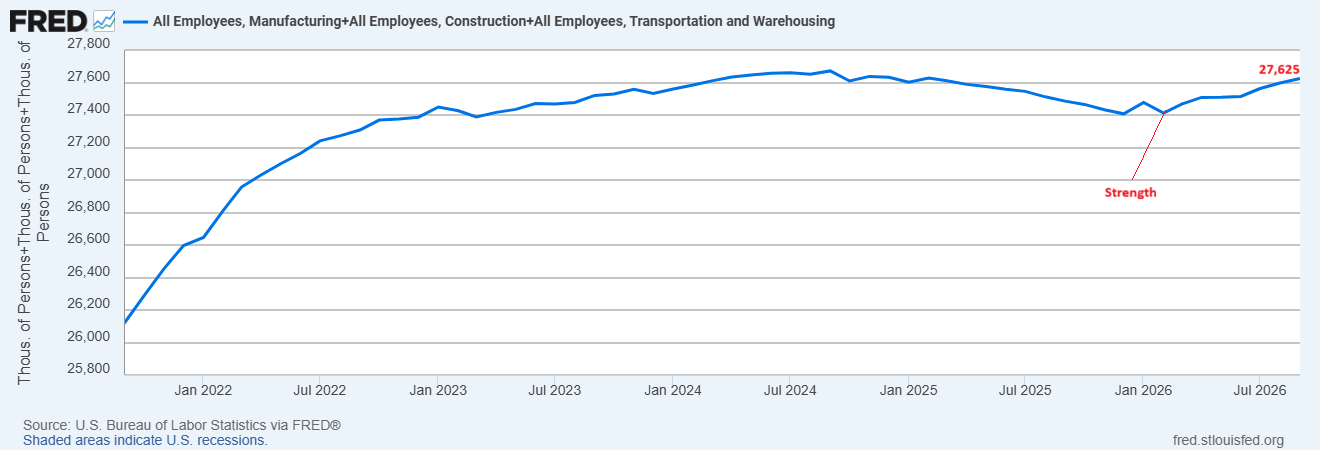
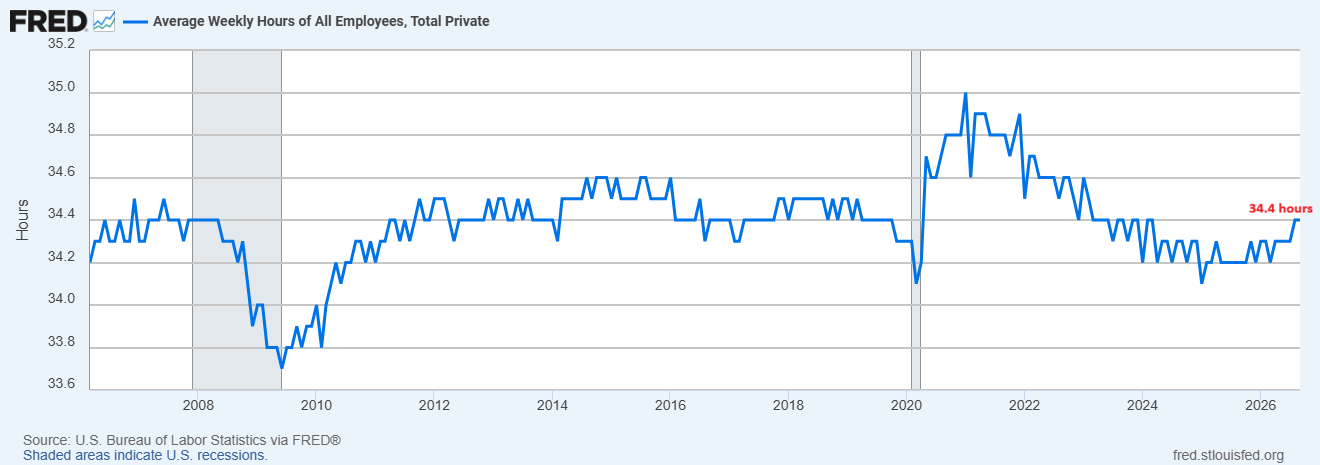
Meanwhile, the average private sector workweek remained at 34.4 hours in September, which is unchanged from August. These figures support a steady industrial outlook in the US. Silver is used in industries such as electronics, automotive components and power infrastructure.
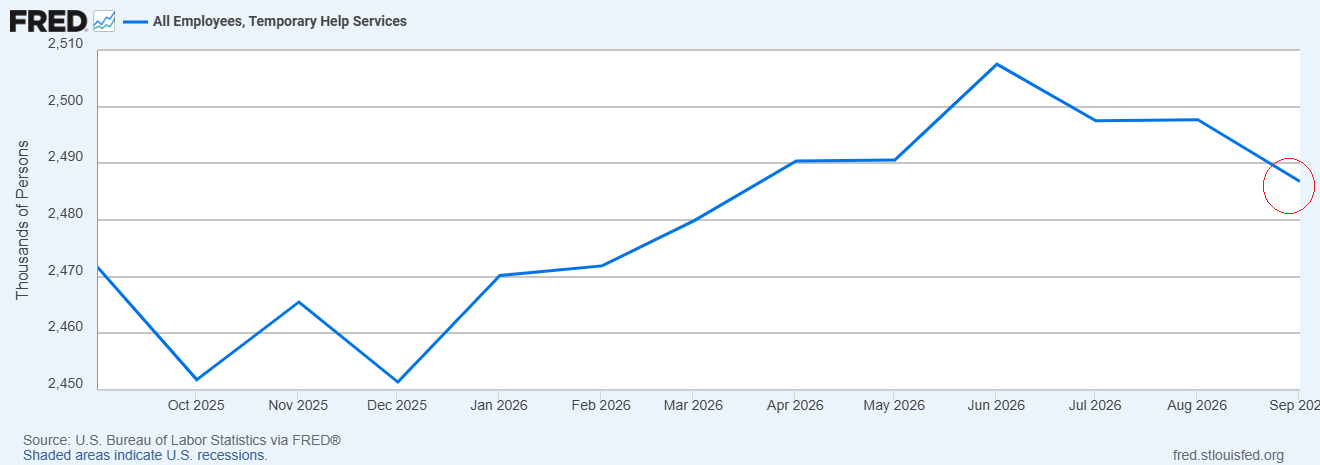
Other labour indicators still suggest caution. The chart below shows that the temporary help employment dropped by 10,900 in September, reversing part of its earlier recovery.
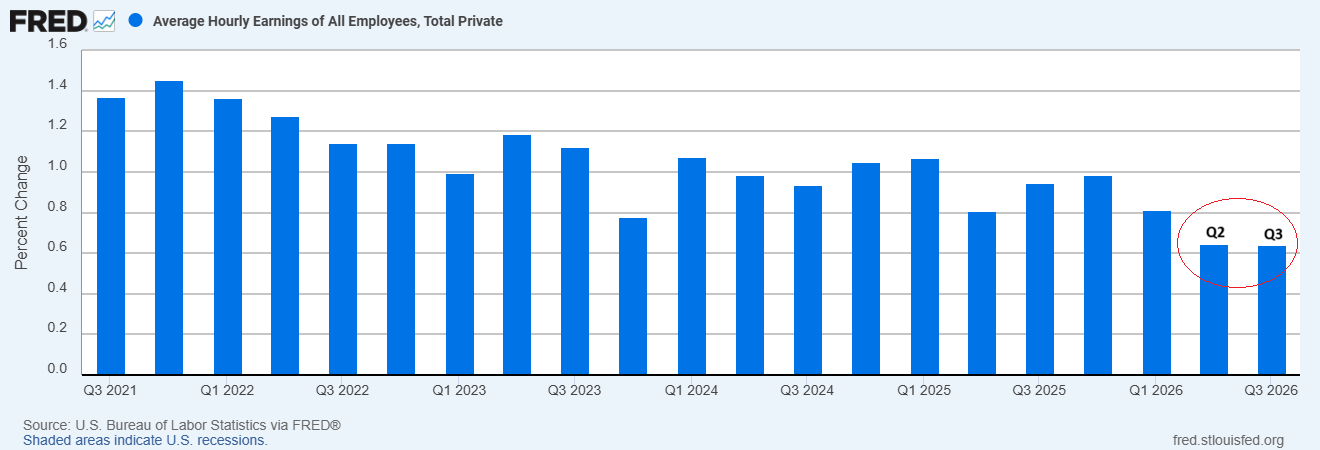
The average hourly earnings increased just 0.1% during the month and 3.0% over the year. The quarterly data shows a lower growth rate as seen in the chart below. This suggests less pressure from wages even as energy and other costs in businesses remain a concern.
US Factory Growth Supports Silver’s Industrial Outlook
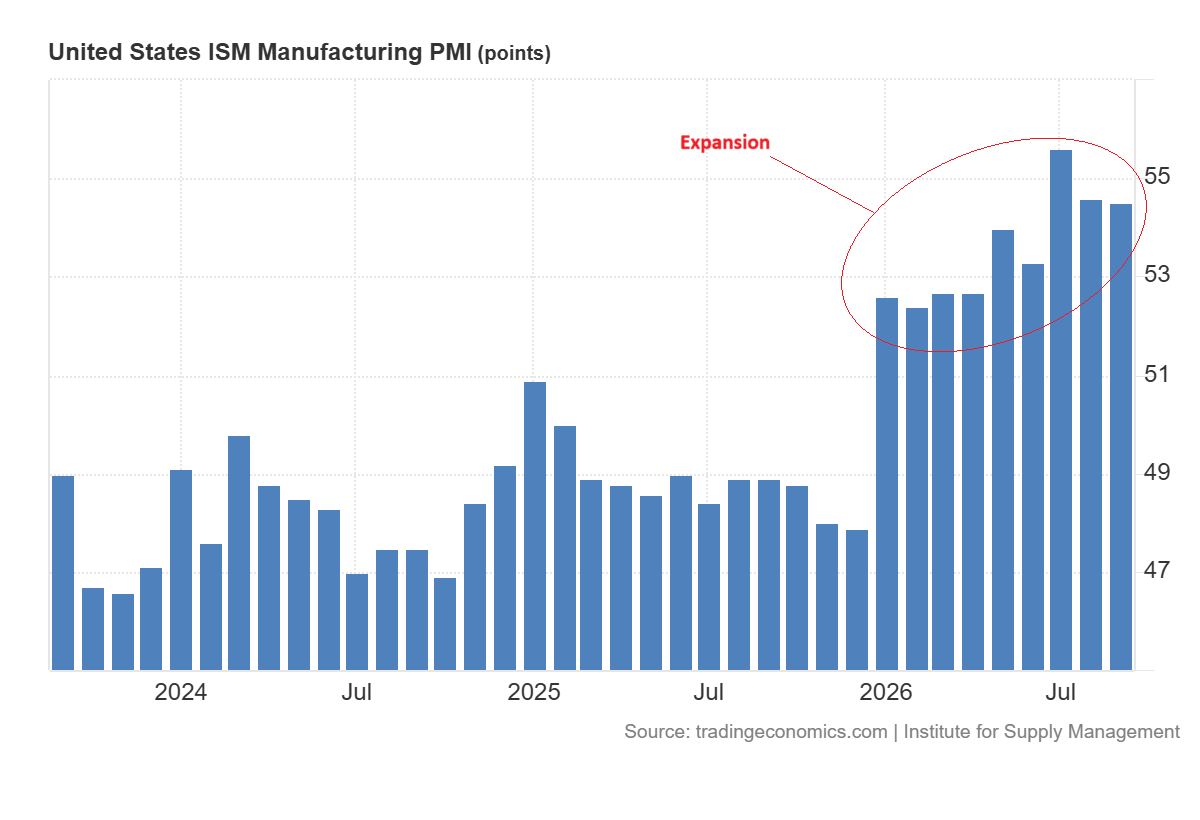
The business surveys further support the mixed outlook. The ISM Manufacturing PMI registered 54.5 in September and marked the ninth consecutive month of expansion. Its employment index increased to 52.7.
The services PMI reached 54.9, but hiring barely expanded at 50.1. The cost pressures strengthened in both sectors. The manufacturing prices index rose to 77.9 from 71.1, while the services prices index increased to 74.0 from 72.6.
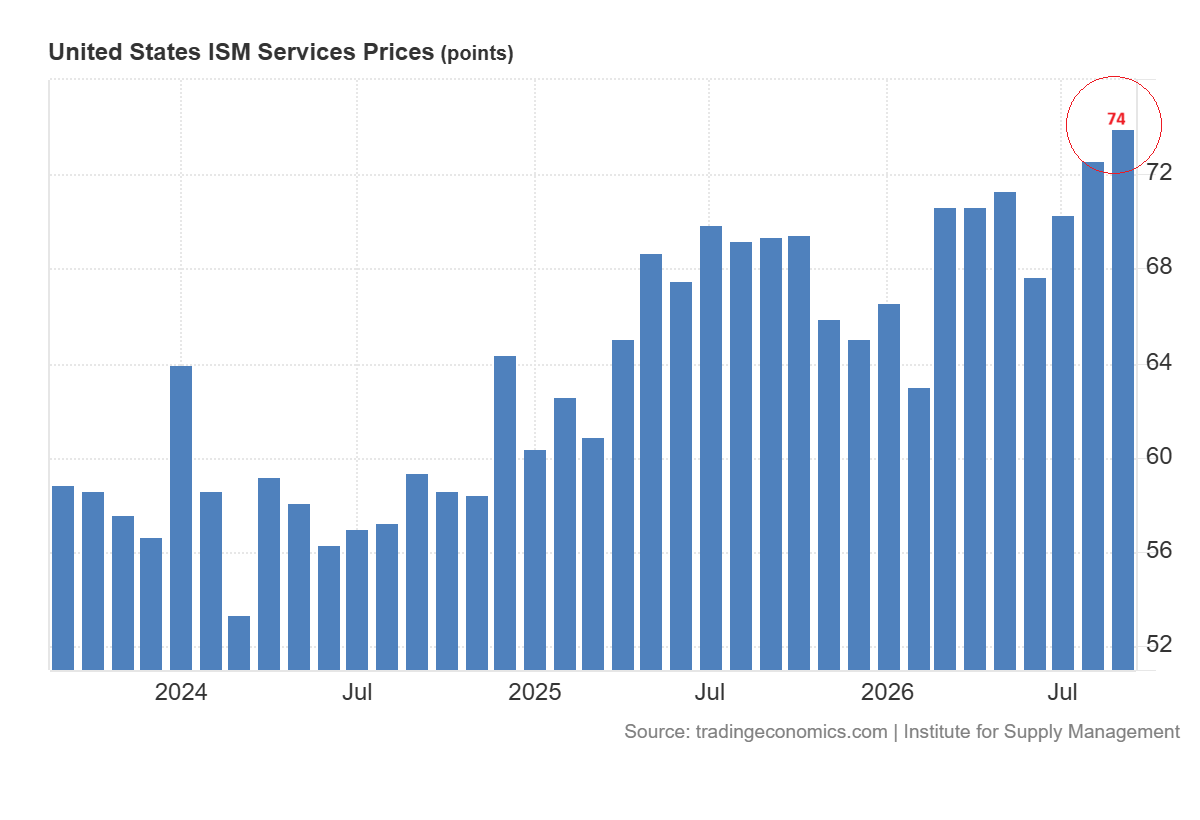
Diesel appeared among the inputs rising in price. These readings show that price increases remain widespread despite slower wage growth.
The Atlanta Fed’s GDPNow model estimated third-quarter real GDP growth at the annualized rate of 3.7% on October 6.
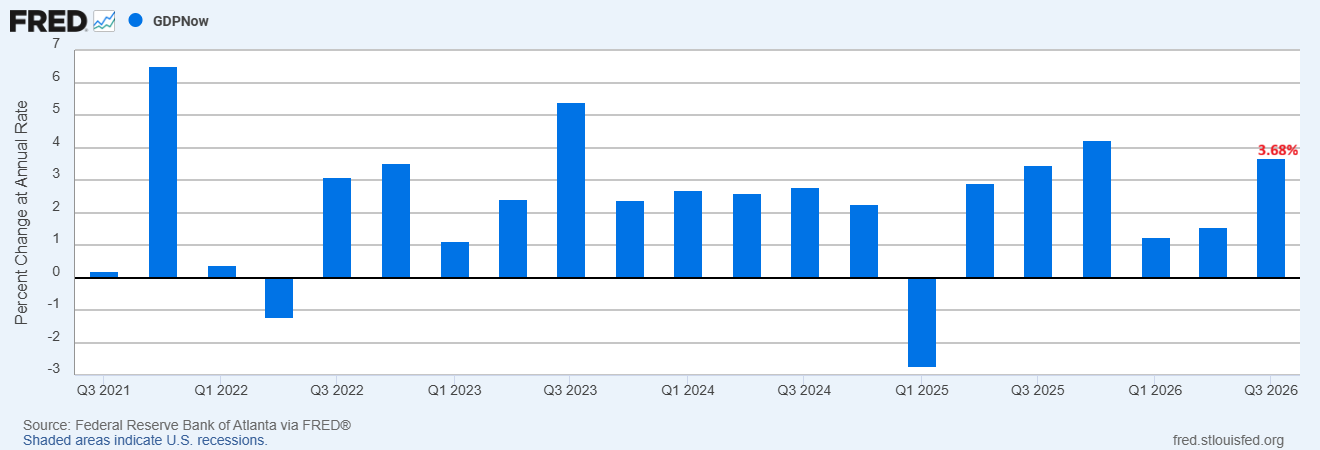
In my view, this gives silver some support through its uses in industrial applications. But persistent inflation and high cost of borrowing could restrain investment buying and leave the recovery uneven.
Silver Price Forecast: $55 Support and $72 Resistance in Focus
Silver’s Long-Term Outlook: $50–$55 Support Remains Key
The outlook for silver remains strongly bullish in the long term despite the nearly 50% correction from the 2026 peak. This bullish structure is seen in the ascending channel pattern that stretches from the 2004 lows. The bottom was formed in March 2020, which triggered a strong surge in the silver market.
The formation of an inverted head and shoulders pattern from May 2021 to May 2024 also supported the strong surge. The correction from the January 2026 highs is now pushing prices towards the midline of the ascending channel pattern, around the $50-$55 area.
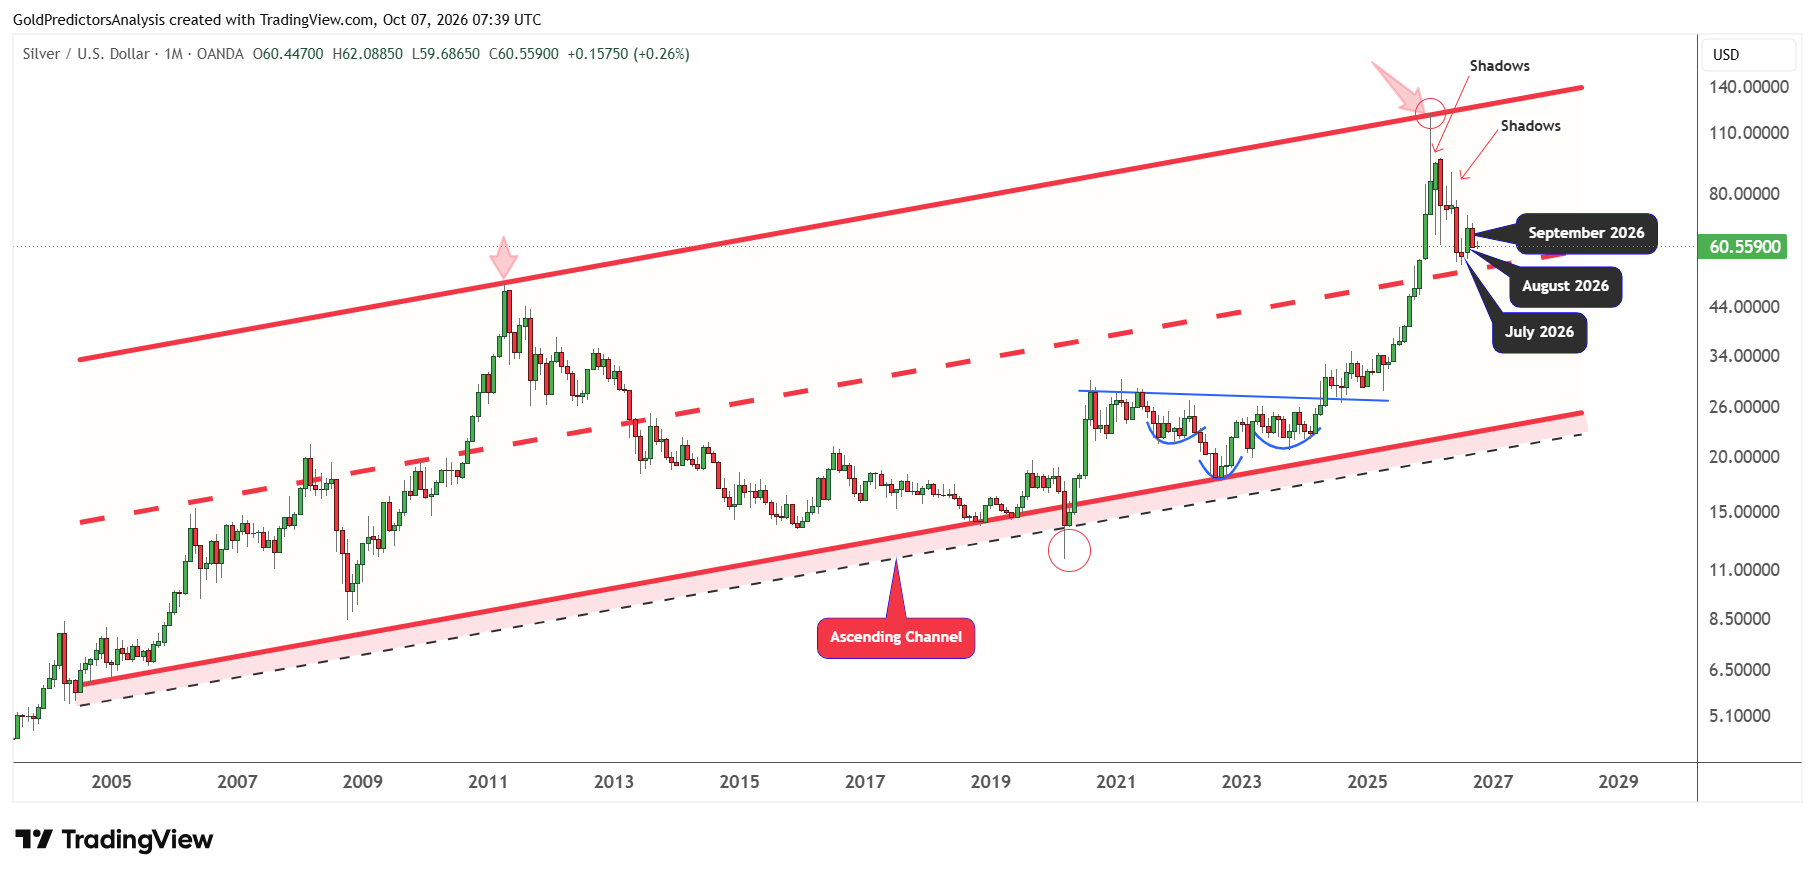
If this support level holds, the silver market will likely produce a bottom and surge again towards the $120-$150 region. But a break below the $50 zone will open the way for further drop towards the $35 region before the next strong surge.
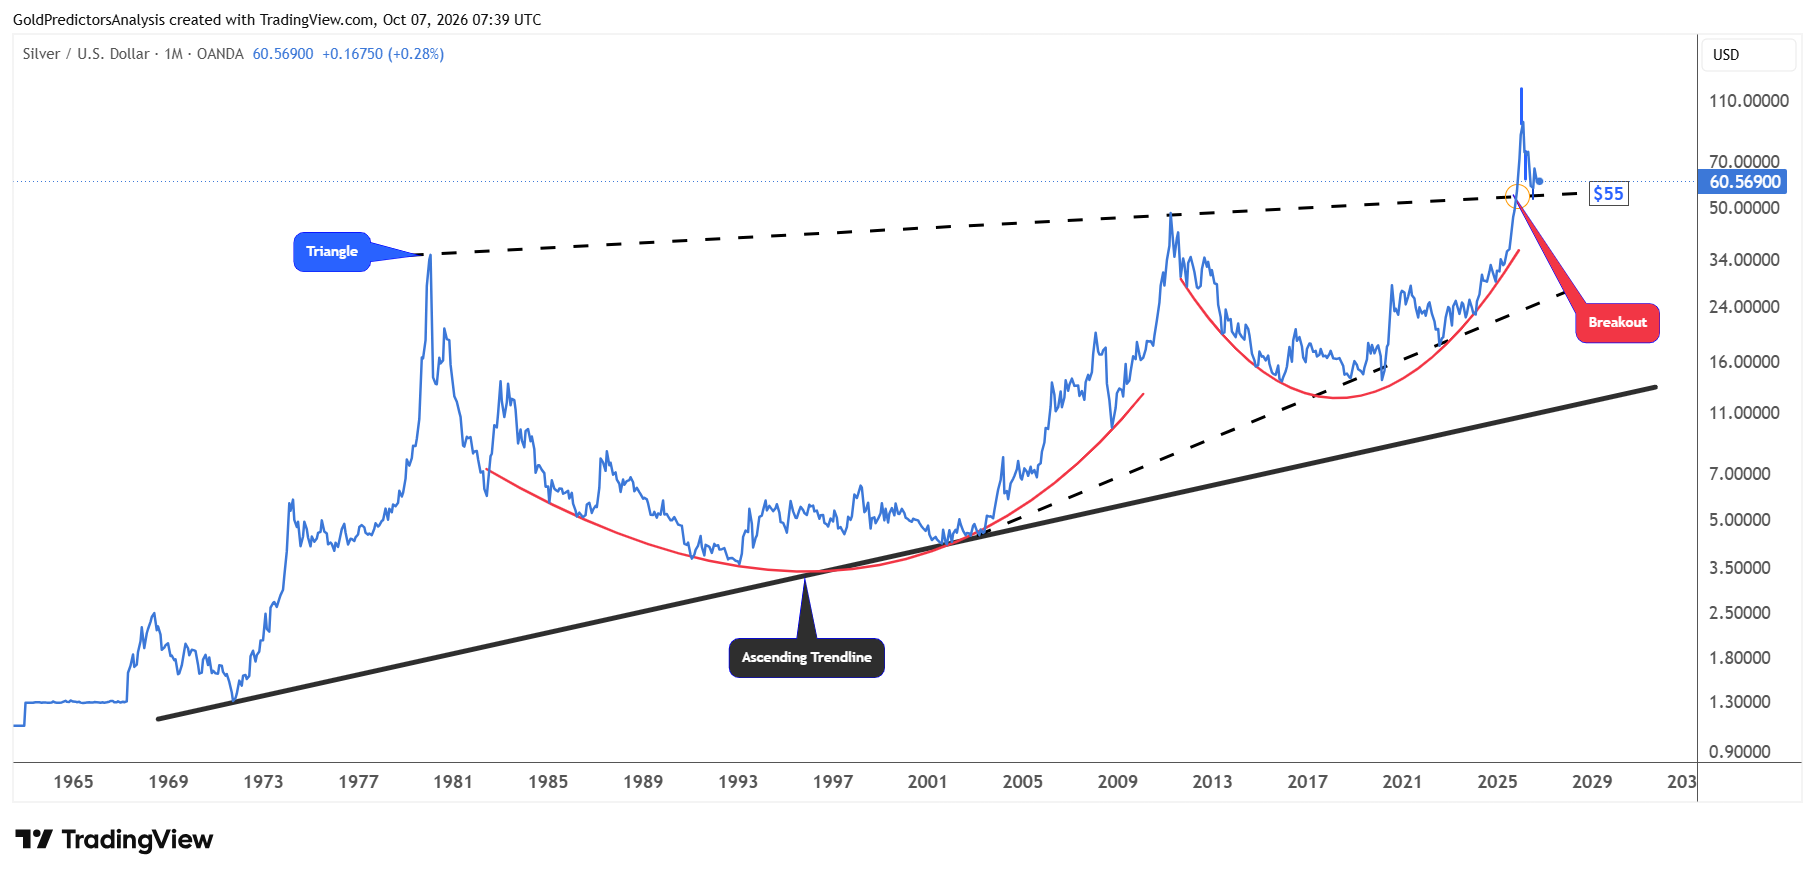
The importance of the $50-$55 support zone is also observed on the monthly chart below, which shows that the price has formed a cup and handle pattern from the 1980s high to the 2025 breakout. This cup and handle pattern supports a strong bullish outlook.
The price is now testing the breakout level of this cup and handle pattern, which is a constructive support zone in the silver market. If prices hold the $50 level during this correction, they will likely produce a bottom and trigger a strong surge in the silver market.
Silver’s Short-Term Outlook: Triangle Pattern Tests $55–$56 Support
Despite the strong long-term bullish structure in the silver market, the short-term price structure remains negative. The daily chart below shows the formation of a triangle pattern from the 2026 peak. The descending trend line of the triangle pattern has been hit multiple times. The price is now moving towards the support of this triangle and the $55-$56 support zone.
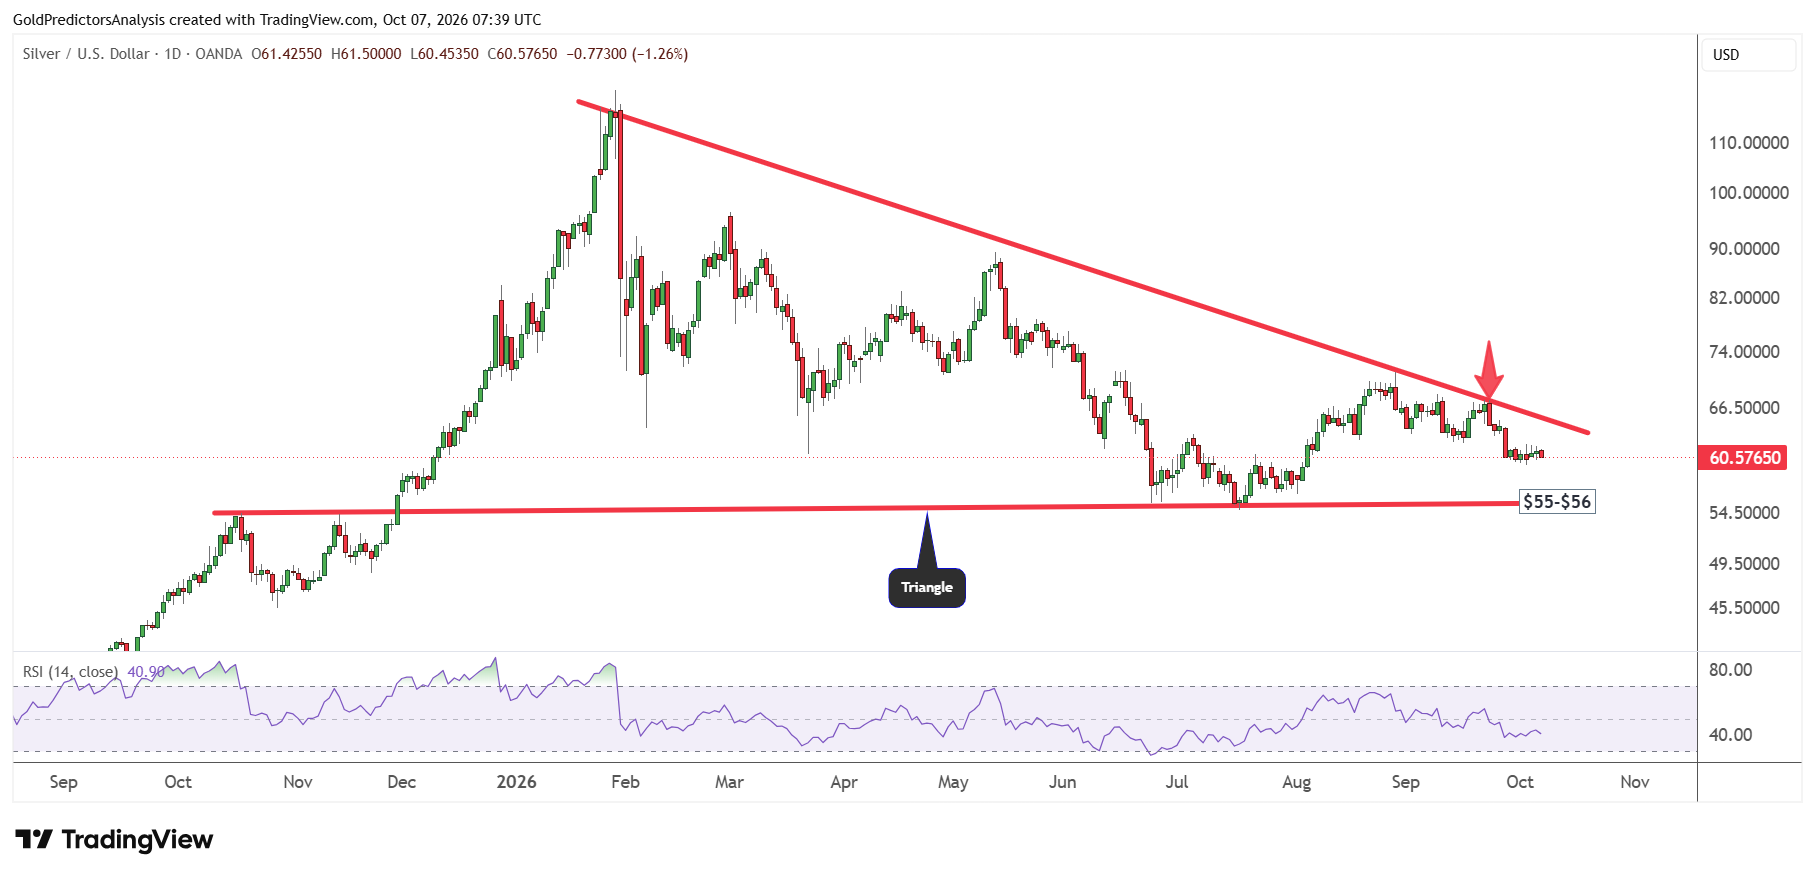
The strength of the US dollar is further pushing the silver price lower. But a break below the $55-$56 support zone will likely open the way for another drop towards the $50 zone. However, a recovery above $65 will indicate a strong move towards the $72 area.
A break above $72 will likely trigger a strong surge in the silver market towards the $100 region. The key pivot in the silver market remains $72 in the short term. A break above this level is required to keep the silver market in a healthy bullish trend.
What to Watch Next for Silver
The strong factory activity in the US supports the industrial outlook for silver. The slow hiring and wage growth also give the Fed more room to pause. But high energy prices keep the risk of inflation alive. These pressures could keep the cost of borrowing elevated and limit the buying in investment. The recovery in silver remains vulnerable despite the broader bullish structure.
Traders will watch oil prices, the US dollar and upcoming inflation data ahead of the Fed meeting on October 27-28. The lower cost of energy and softer inflation would strengthen the case for a pause and could support silver. But a renewed increase in oil prices would increase concerns about further tightening. The strength of the US dollar also keeps the silver prices under pressure. The US dollar index must break below the 100 level to suggest strength in the silver prices.
The first level to watch for support is the $55-$56 zone. A break below it would bring the broader $50 area into focus. A break below $50 would weaken the bullish structure and raise the risk of a decline towards $35. On the upside, a recovery above $65 would bring $72 into view. A break above $72 would strengthen the case for a move towards $100.
Read more: Strong Dollar and High Yields Put $50 Silver in Focus