


Silver (XAG) remains under pressure after losing over 6% last week. High Treasury yields and a strong US dollar continue to limit the recovery in silver. The soft US hiring supports the case for the Fed pause in October, but the inflation outlook keeps further rate increases in view. The improvement in factory activity in the US and China may support industrial demand, but investors have reduced their bullish silver positions. In my view, silver needs lower real yields and a weaker dollar to sustain a recovery. This article presents the latest fundamental drivers, the US dollar outlook and the key technical levels that could shape the next move in silver.
Silver Fundamentals: High Yields and Inflation Limit Recovery
Fed Pause Bets Face Persistent Inflation and High Yields
The case for the Fed pause in October strengthened on Friday after September payrolls rose by just 29,000. But markets still expect further tightening by the Fed later this year. An October pause could give silver some relief, but the inflation problem remains.
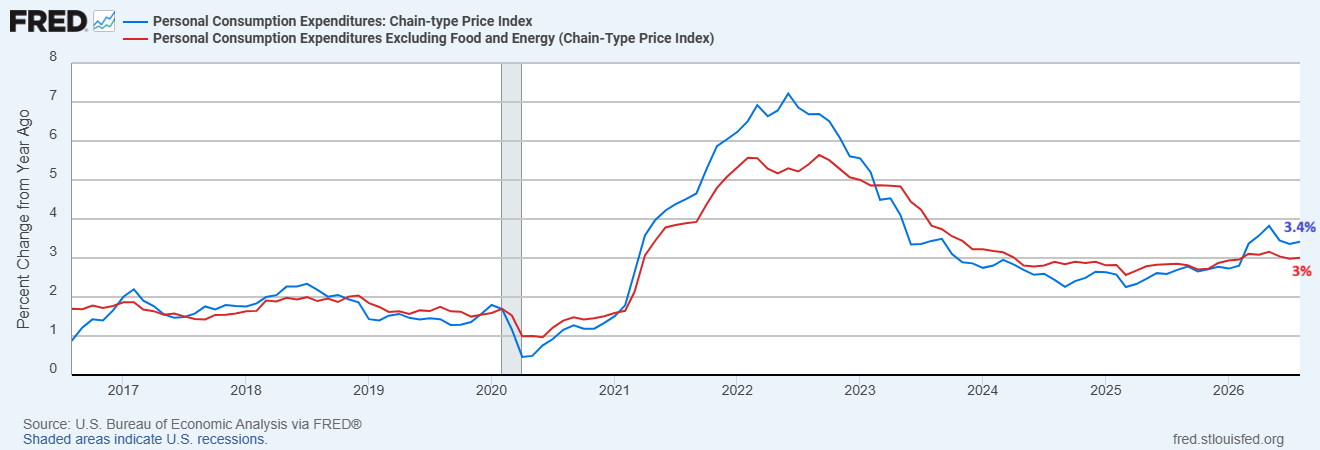
The latest PCE report showed that the annual headline inflation is at 3.4% while the core inflation is at 3.0%. Dallas Fed President Lorie Logan also said that rates may need to rise by another 50 basis points or more. Her comments show that some policymakers still favor a further increase in the interest rates.
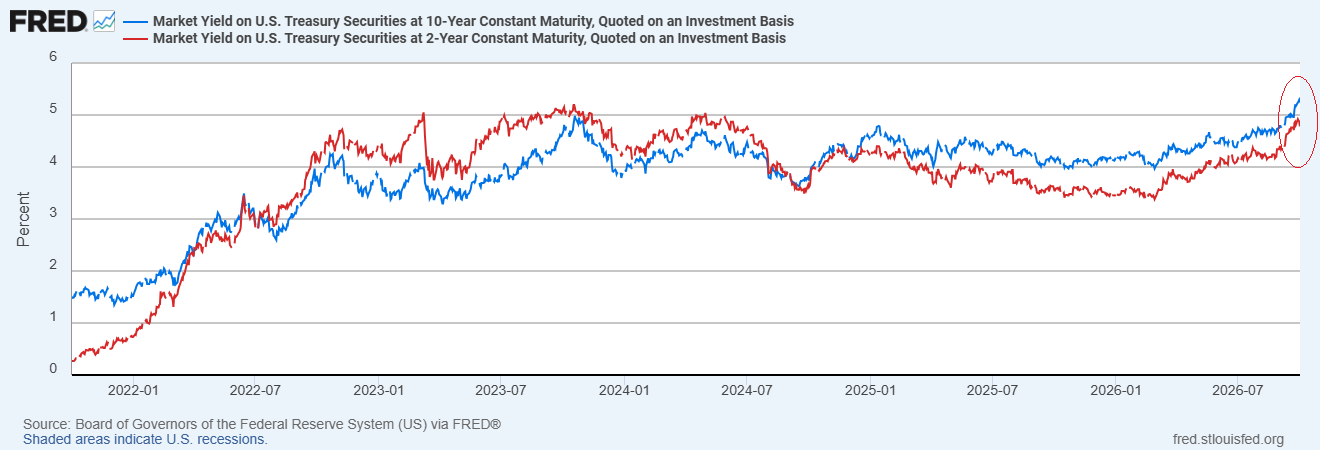
The Treasury market remains a major challenge for silver. The Treasury yields reversed their initial decline after the jobs report on Friday. The 10-year yield returned to about 5.28% and closed positive for the week. Meanwhile, the 10-year real yield remains at 2.88%. This data suggests that weak hiring alone has not removed the pressure from the bond market.
Silver Price Forecast
Every new Silver analysis as it publishes, today's technical signal and key levels, live price — on one page.
See all Silver forecastsG7 Oil Reserve Releases Could Ease Inflation Pressure
The latest energy decision offers possible source of relief. The G7 set a four-month deadline to deliver around 100 million barrels under earlier emergency reserve commitments with diesel releases concentrated in the first 20 days.
These deliveries could ease costs for fuel and reduce inflation pressure. But Brent oil still settled near $106.50 a barrel. The IEA also warned that refined fuel supplies remain severely constrained despite the recovery in crude exports in the Middle East.
Silver may need sustained decline in energy prices before inflation concerns ease more clearly.
US and China Factory Growth Improves Silver’s Demand Outlook
The latest US manufacturing report shows that silver faces mixed signals. The September ISM manufacturing PMI stood at 54.5 while new orders improved to 55.3 from 53.7. The continued factory expansion offers support for the demand for industrial silver.
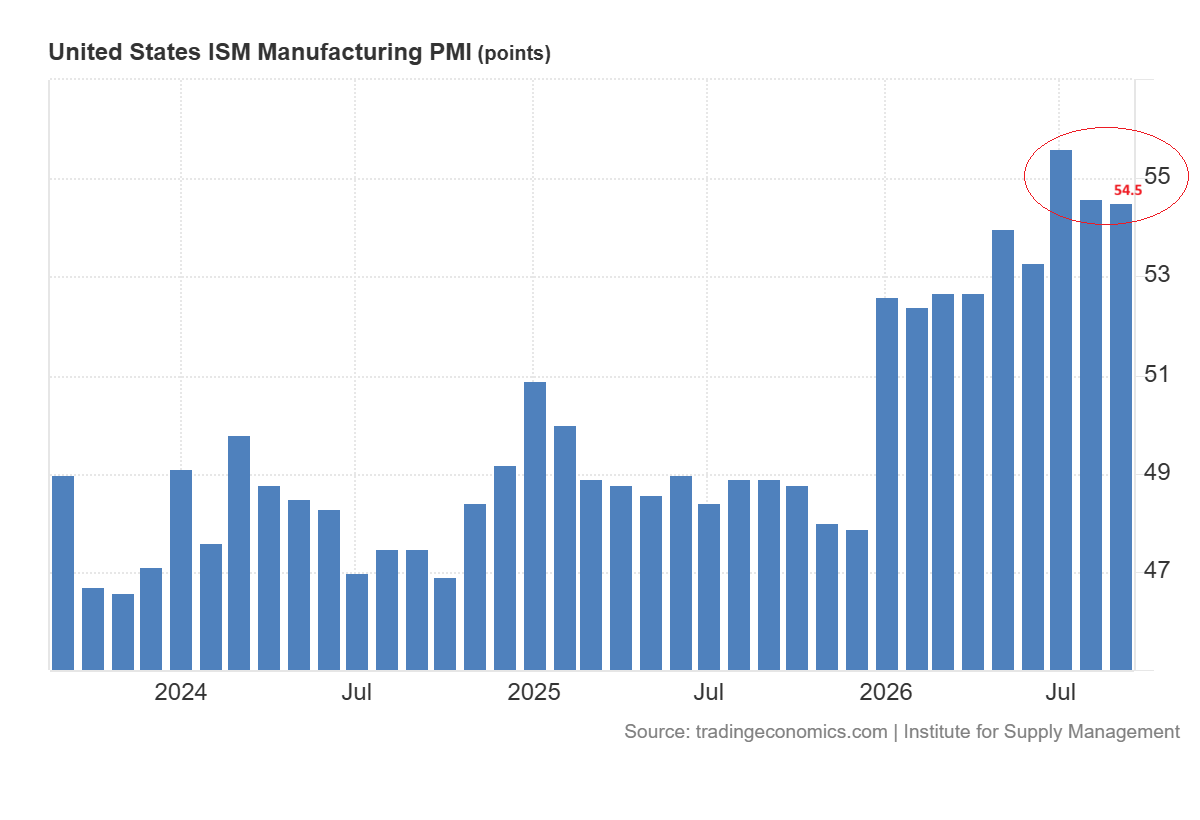
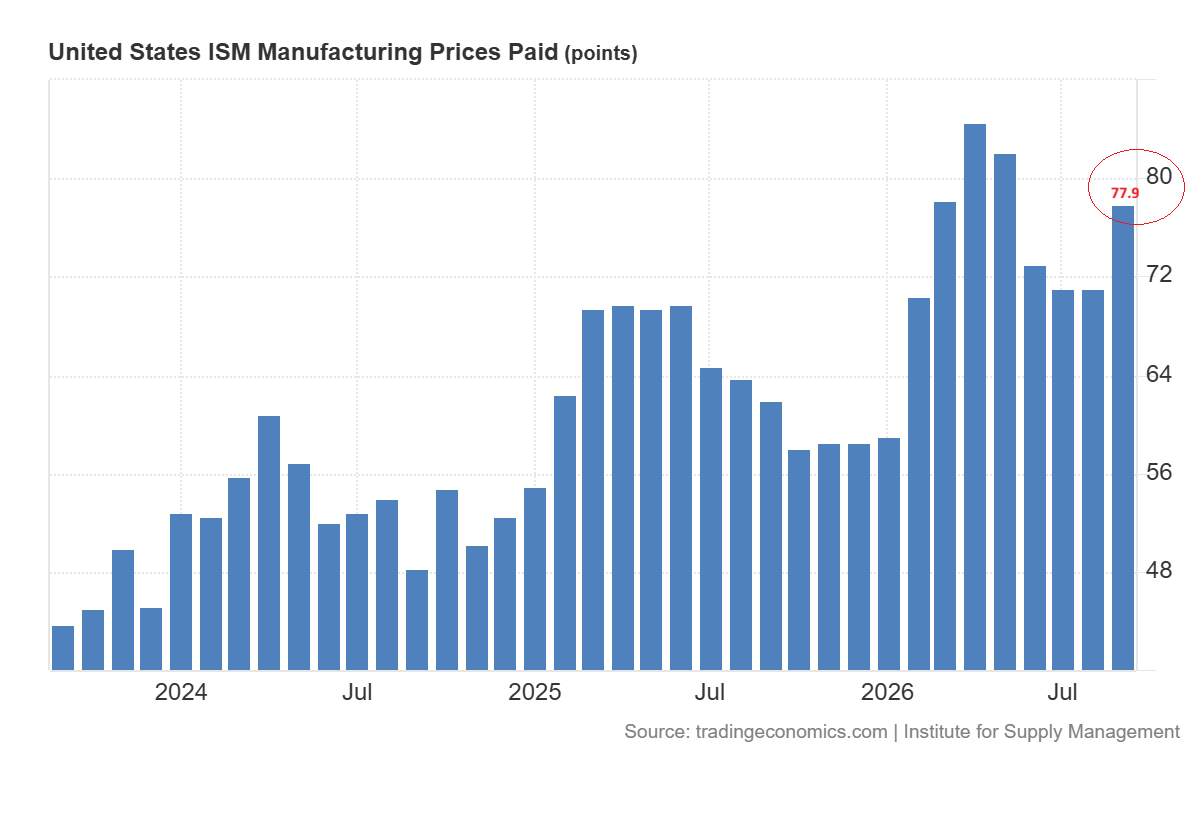
But the prices paid index jumped to 77.9 from 71.1. The manufacturers still face increases in costs for input. This combination may support demand for silver even if the Fed is cautious about inflation.
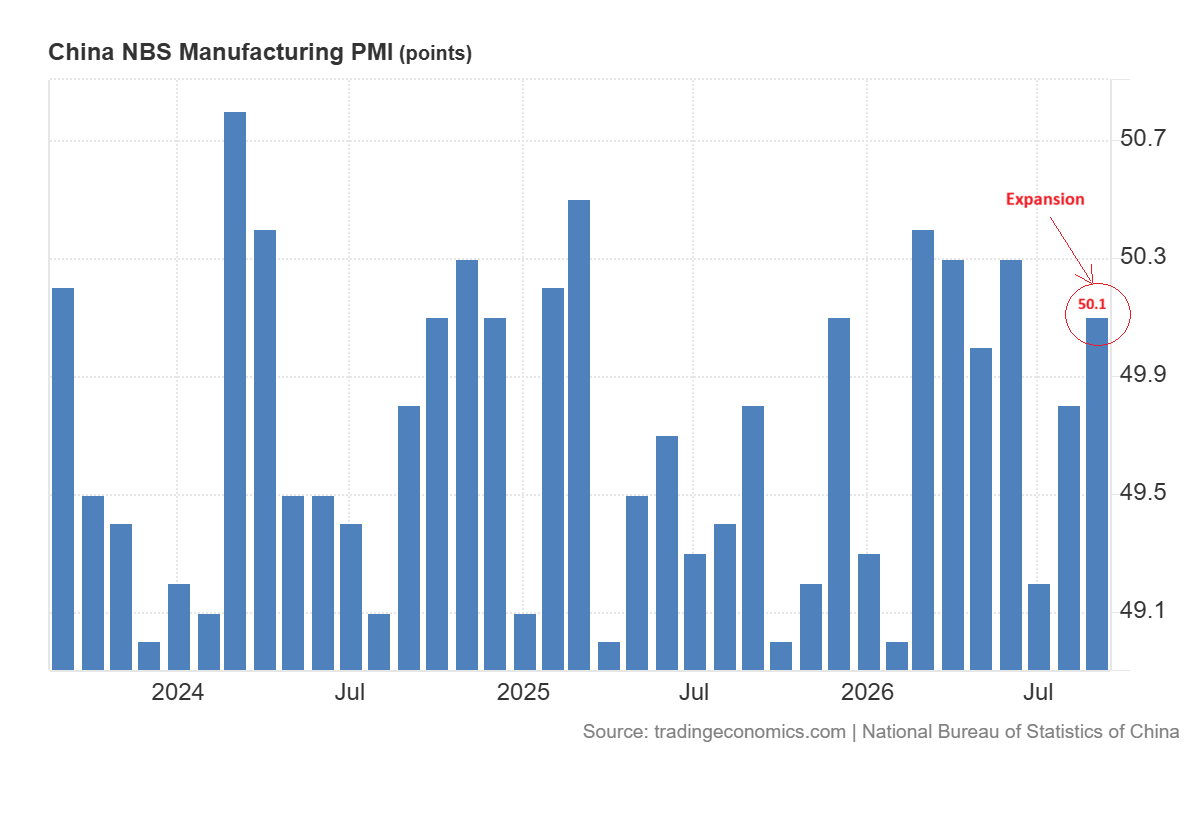
China offers another positive signal for industrial demand. The official manufacturing PMI for China rose to 50.1 in September from 49.8. The reading above the 50 level suggests expansion.
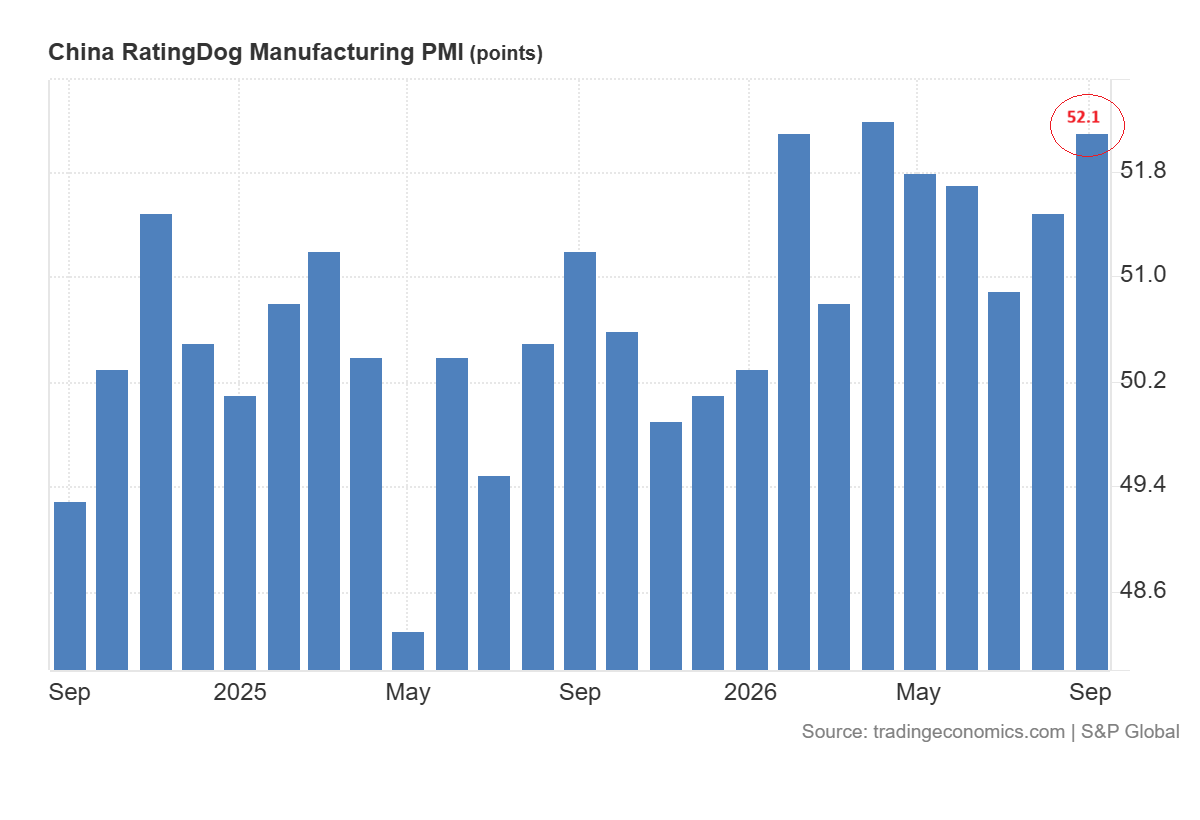
The private RatingDog PMI also increased to 52.1 from 51.5. These surveys improve outlook for factory activity and may support industrial demand for silver.
But the official new orders index eased slightly to 50.5 from 50.6. The improvement remains uneven and needs further confirmation.
Silver Funds Cut Net Bullish Positions by 43%
Investor positioning adds another reason for caution. The latest CFTC report showed that money managers reduced long positions in silver and increased short positions during the week ended September 29. Their net long position dropped to 7,614 contracts from 13,309 which is a decline of about 43%. This points to weaker speculative support before jobs data on Friday.
In my view, the improvement in the factory activity may cushion the decline in silver, but a strong recovery needs lower real yields and sustained weakness in the US dollar. Therefore, the next move in silver may depend on developments in the US dollar.
US Dollar Index Forecast: Strong Momentum Pressures Silver
DXY Breakout Above 101.80 Supports a Bullish Outlook
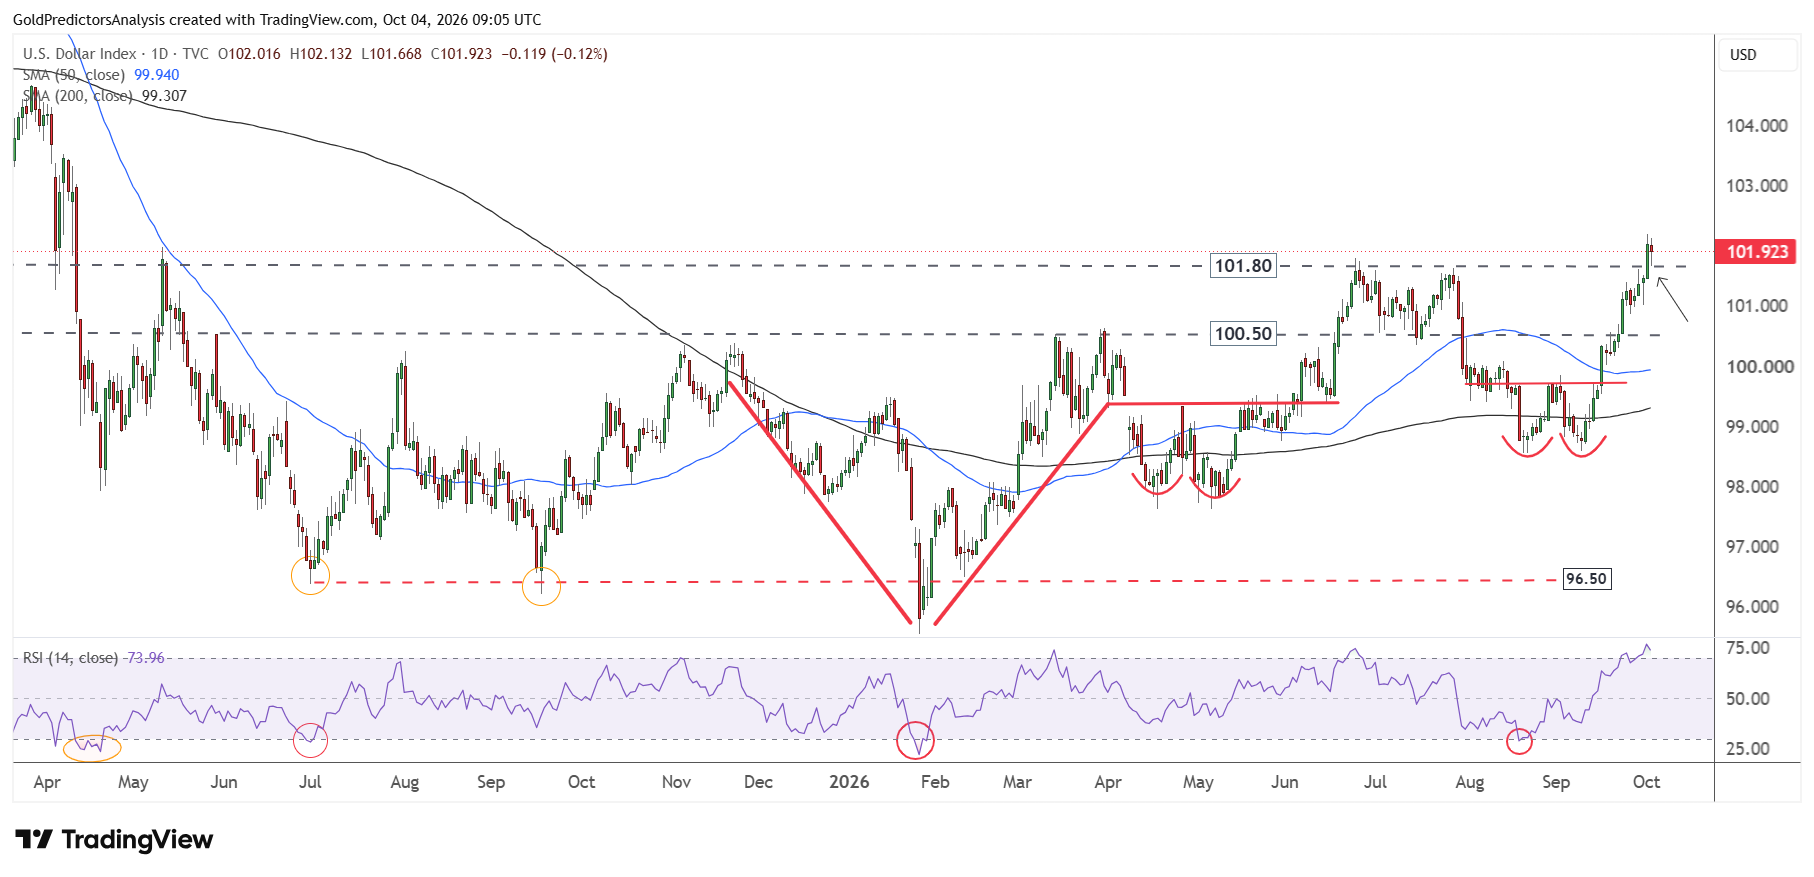
The daily chart for the US dollar index shows that the index broke above 101.80 last week and triggered a strong rally. This breakout developed after the formation of strong bullish price action. This bullish price action is seen by the V-shaped recovery after the January 2026 bottom and the double bottom formation in May and September.
The index now remains above the 50- and 200-day SMAs. But the RSI has reached extremely overbought conditions in the short term. This bullish configuration suggests that any correction in the short term may trigger another rally in the US dollar index as inflation remains strong.
DXY Faces 102.20 Resistance With 106–107 in View
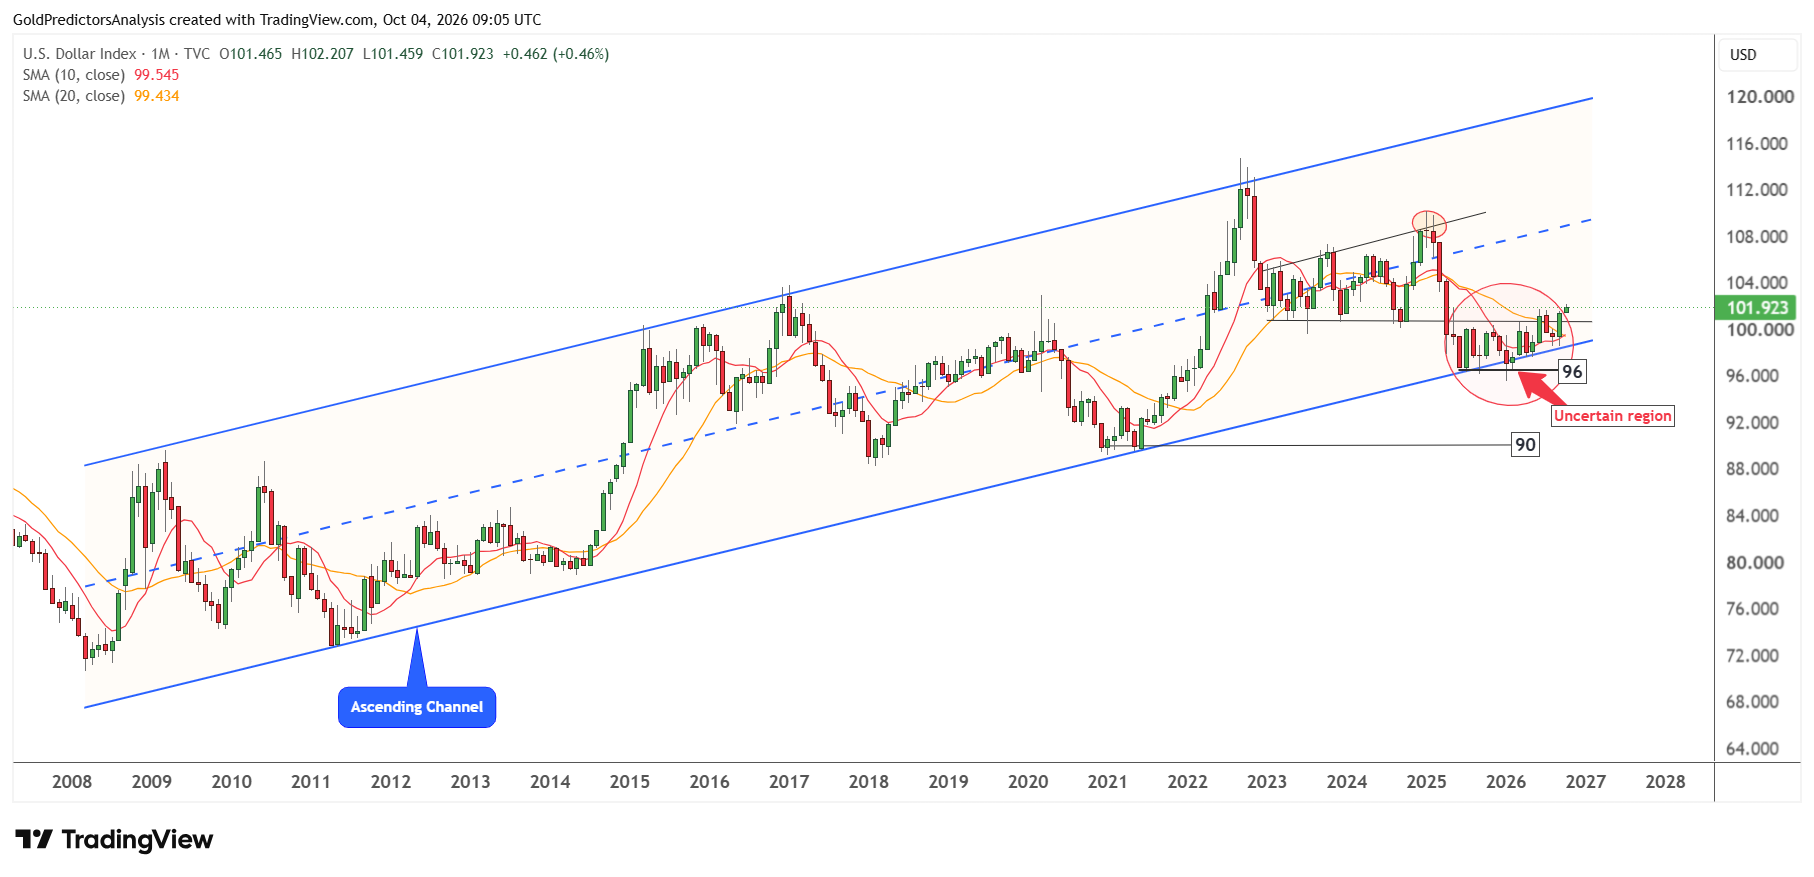
Despite the strong rally in the US dollar index over the past few weeks, the index still remains within the uncertain region as seen on the monthly chart below. However, the consolidation in 2025 and 2026 has produced a strong bottom formation around the support of the ascending channel pattern.
The monthly gain of 2.06% in September 2026 suggests that the index is preparing for a rally to higher levels. The 10-month SMA is now crossing above the 20-month SMA. Therefore, if the month of October is positive and the index trades around 103-104, it will likely increase the chances of a rally toward 106-107 in 2026.
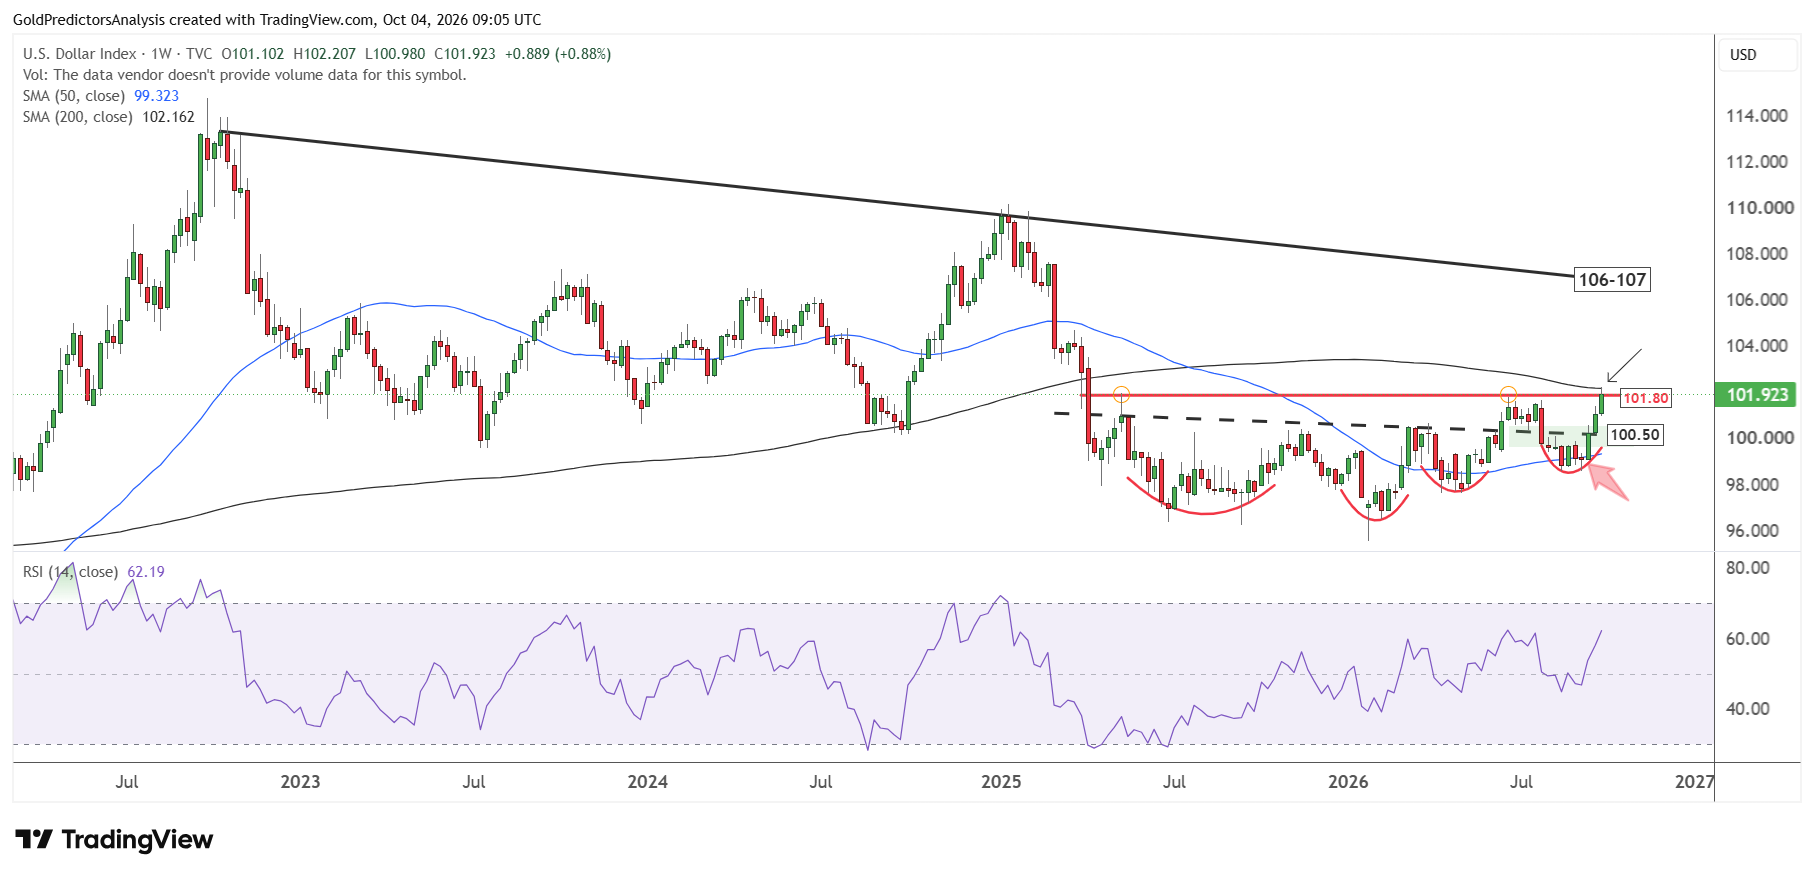
The strong bottom formation process in the US dollar index in 2025 and 2026 is clearly observed on the weekly chart. The chart shows a rounding bottom formation below 100.50. A break above 100.50 has pushed the index to 101.80.
However, the index is still challenging the resistance at the 200-week SMA at 102.20. Therefore, another positive weekly candle above 101.80 is required to continue the strong rally in the US dollar index toward the 106-107 level.
However, the bullish weekly candles for the past three weeks suggest a positive outlook in the short term. The strong resistance at 106-107 is evident in the descending trend line that stretches from the October 2022 highs.
If the US dollar index continues to rally, then silver prices may continue to correct or consolidate around the long-term support region of $50.
Silver Price Forecast: $57–$58 Support Faces a Test
Silver’s Rejection at $72 Keeps Recovery Under Pressure
The weekly chart for spot silver shows that the price has been consolidating around the resistance zone since August 2026. This resistance line is seen by the descending trend line that stretches from the January 2026 highs. This resistance line forms a bull flag pattern, whereby the flag stretches from the April 2025 lows.
A break above $72 was expected to trigger a strong surge in silver prices towards $90. However, the silver price formed a bearish hammer candle in the last week of August, right at $72. This suggests that silver is not yet ready to break higher and continues to drop before the next move.
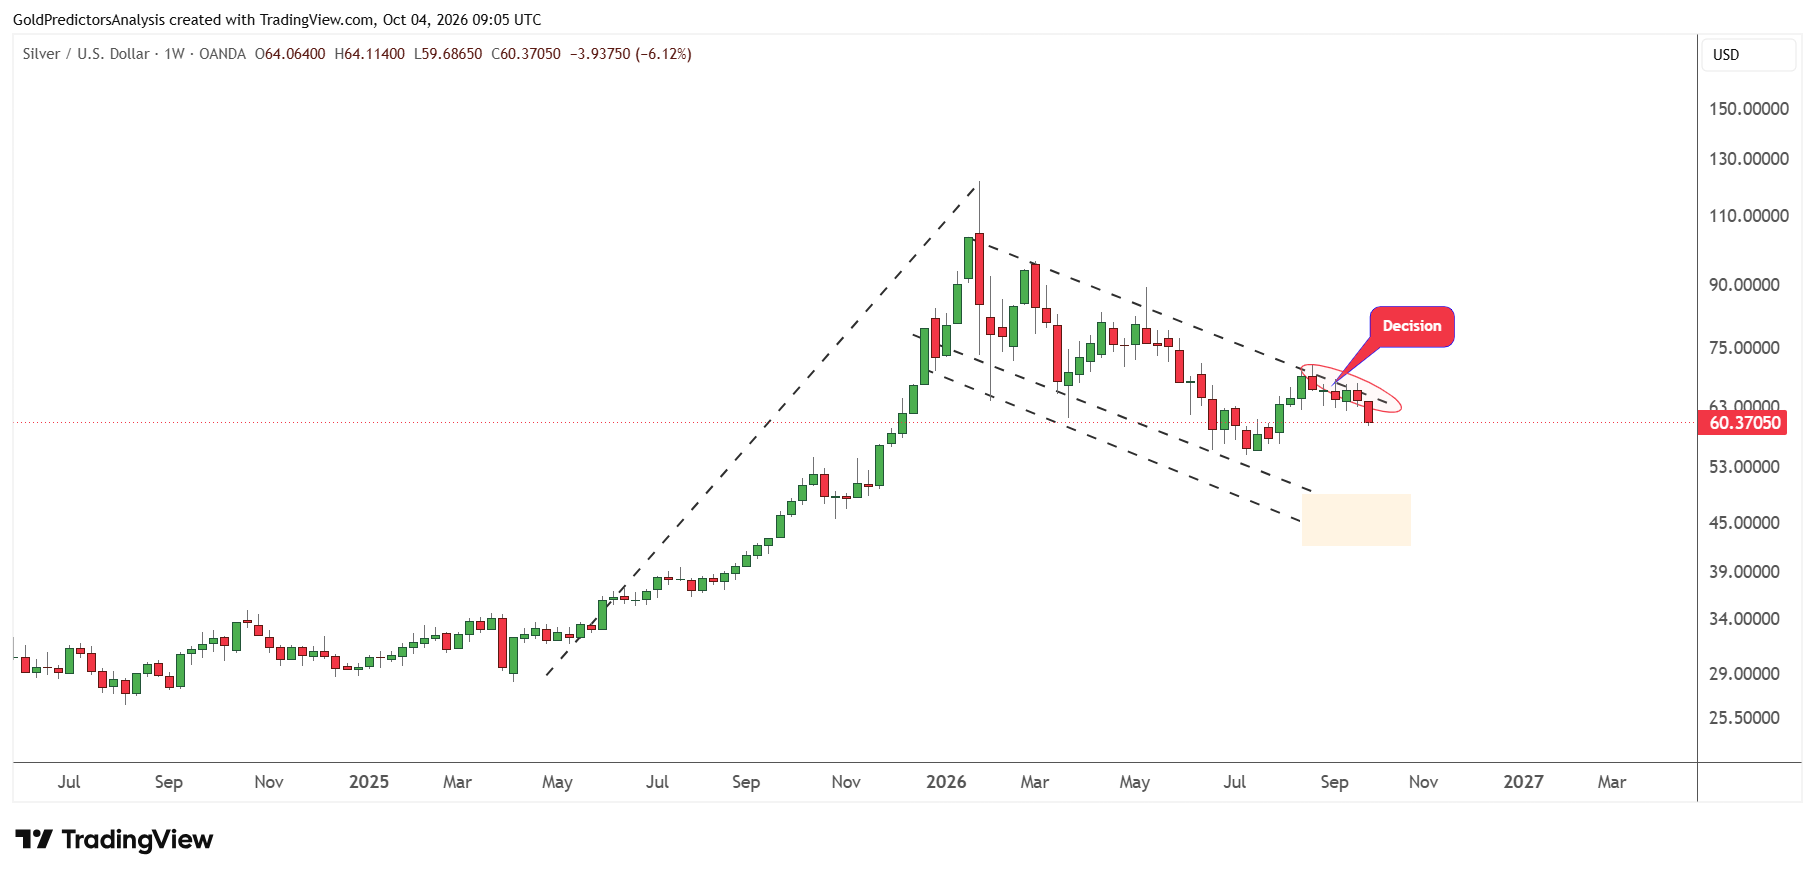
The price dropped by over 6% last week, which suggests negative price action in the short term. This negative price action is developed due to the positive development in the US dollar index and US Treasury yields. If the silver price trades below $60 next week, it will likely continue to drop towards the $45-$50 support. This is the long-term support zone in the silver market.
A Break Below $57-$58 Could Expose $45-$50
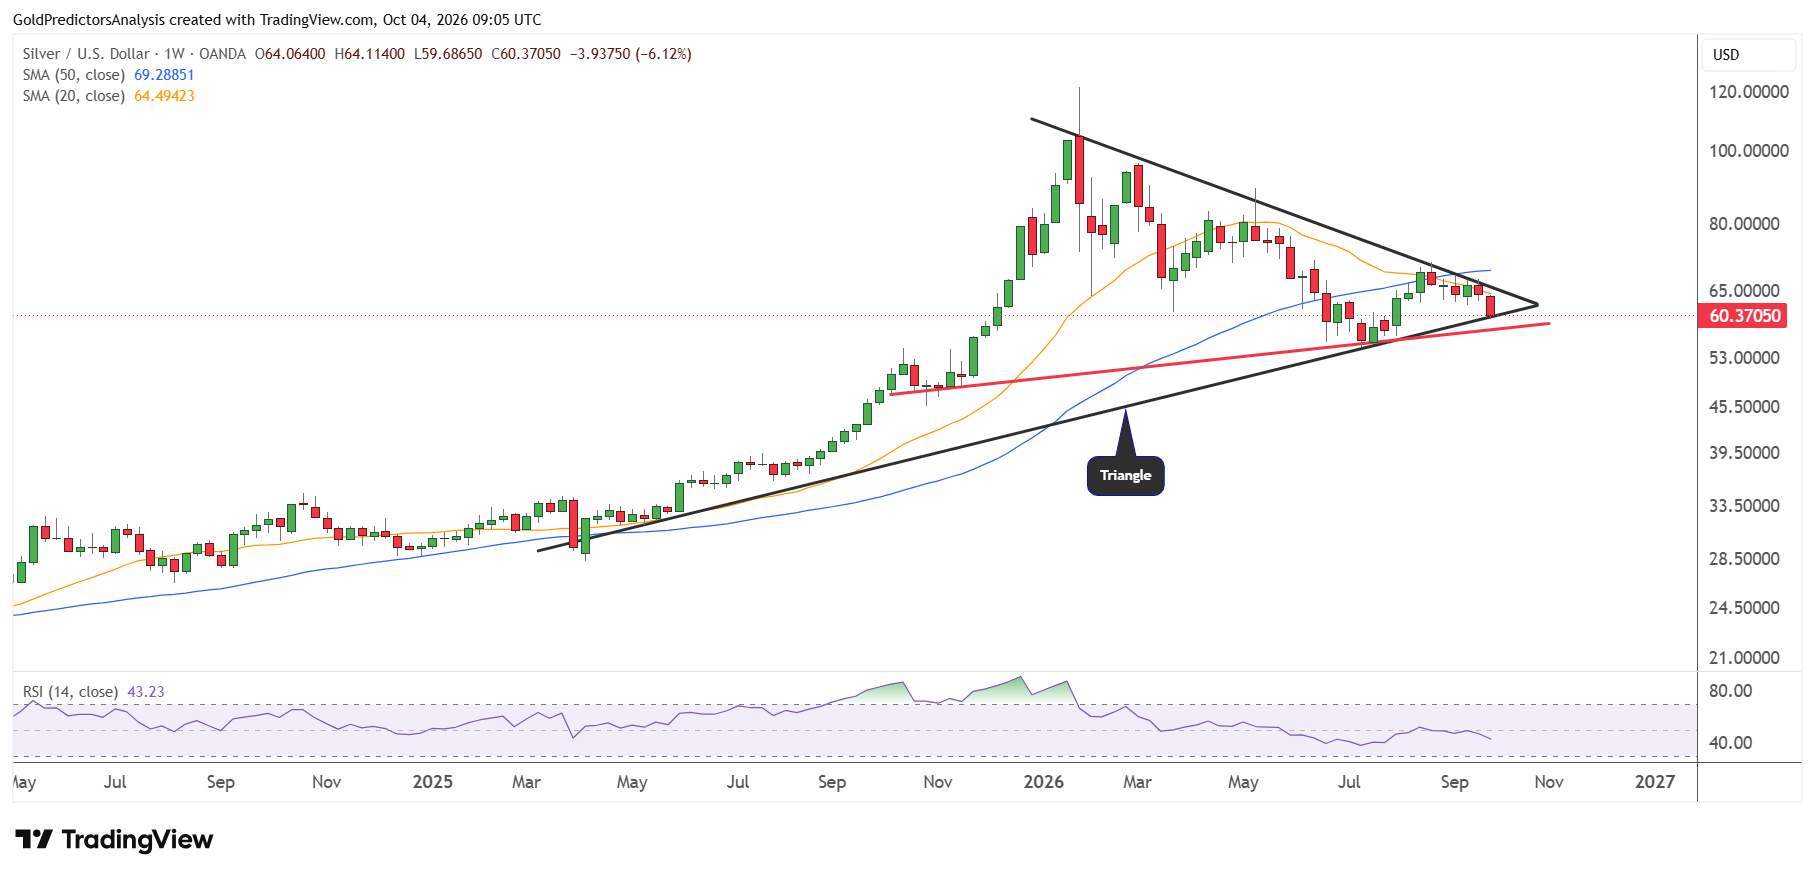
Another weekly chart for spot silver shows that the silver price is testing support before dropping towards the $50 area. This support is seen by the rising trend line that stretches from the October 2025 lows. This trend line lies around the $57-$58 region. A break below this support line will likely trigger a drop in silver toward $45-$50.
The RSI remains below the midline and the price remains below the 20- and 50-week SMAs. This further highlights negative price action and increases the likelihood of a breakdown in the silver market.
Final Thoughts
Silver faces a cautious outlook as high Treasury yields and strong US dollar limit relief from a possible Fed pause in October. The soft hiring gives the Fed room to wait but inflation keeps further rate increases in view. The improvement in factory activity in the US and China may support industrial demand. But the sharp reduction in bullish positions shows that investors remain cautious. Silver needs lower real yields and weak US dollar to support a strong recovery.
The support zone between $57 and $58 now forms an important test for silver. A break below this support zone could deepen the decline towards the major support zone of $45-$50. A recovery above $65 would ease the immediate pressure. But buyers need to break above $72 to strengthen the case for a move towards $90. Until the US dollar and yields ease, silver may struggle to sustain a rebound. The US ISM services report on October 5 and Fed minutes on October 7 could shape the next move in silver by shifting rate expectations, Treasury yields and the US dollar.
Read more: High Yields Raise the Risk of a Deeper Correction in Gold