


Silver (XAG) has dropped to $64 as strong US business data and comments by the Fed lift Treasury yields and the US dollar. The surge in US Treasury yields has increased pressure on silver, but the outlook for silver remains constructive in the long term. In my view, silver needs to hold the $60 level to avoid a deeper correction toward the support zone of $50-$55. The gold to silver ratio and upcoming inflation data may help show whether the price can recover. This article presents the economic pressures, technical levels and the signals from the ratio that could shape the next move in silver.
Silver Fundamentals: Strong US PMI and Fed Comments Lift Treasury Yields
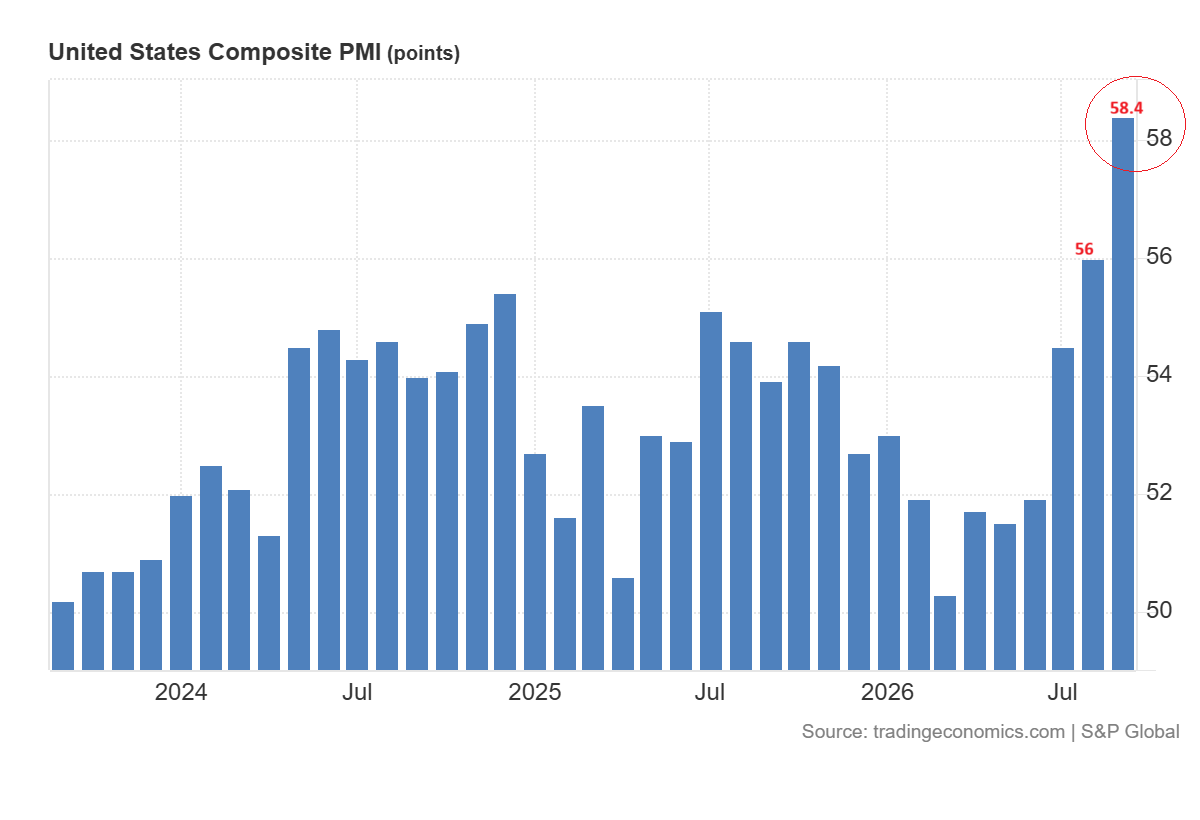
Silver dropped to $64 an ounce on Thursday as the US dollar and Treasury yields increased. The flash US composite PMI increased to 58.4 in September from 56.0 in August.
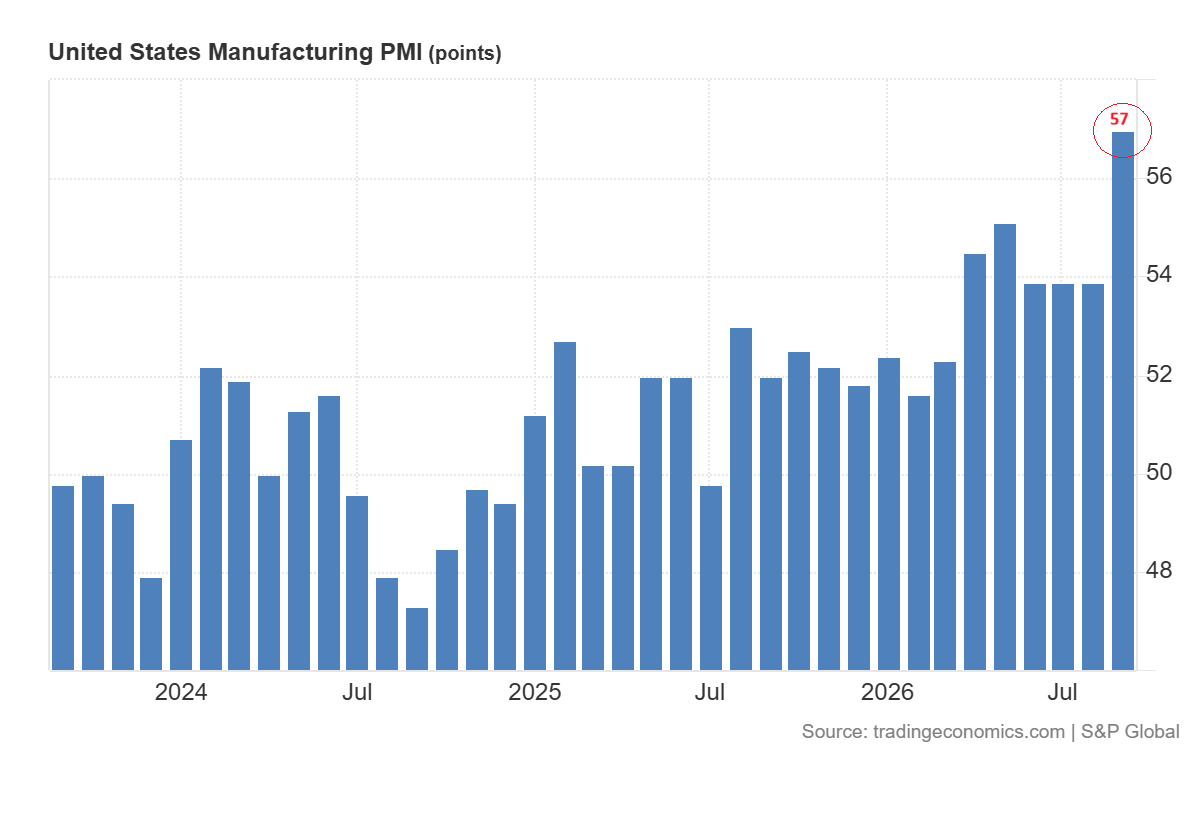
The manufacturing PMI increased to 57.0 from 53.9 while services PMI reached 58.7. Stronger factory activity may support the industrial demand for silver, but higher yields have put more immediate pressure on the price.
The details of the PMI report add to the inflation concerns for the Fed. The survey showed that hiring growth is fastest in more than four years. The costs for inputs increased at the fastest pace in nearly four years as fuel and transport became more expensive. The firms also raised selling prices faster than in August. This strong demand gives businesses more room to pass on costs which could keep inflation elevated.
Fed Governor Michael Barr said on Wednesday that inflation remains above 2% target and that further policy adjustments are likely in his base case. Richmond Fed President Tom Barkin pointed to July PCE inflation of 3.7% and said more than 60% of the PCE basket was rising faster than 3% a year.
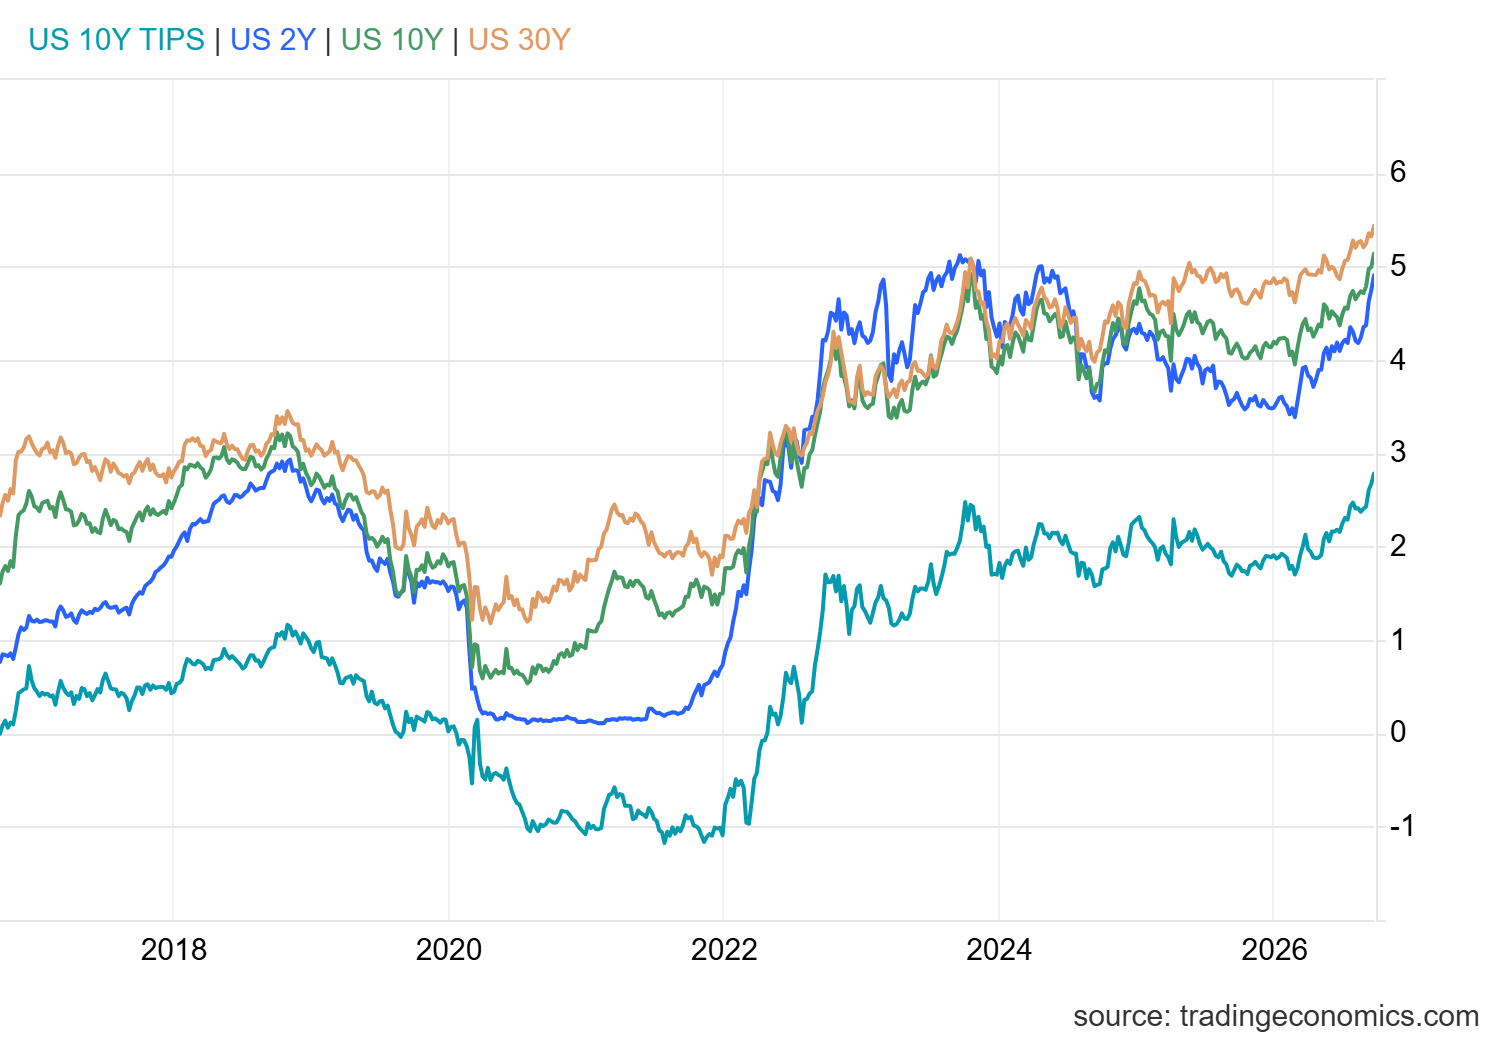
The pressure is visible in bond yields. The chart below shows that the 10-year Treasury yield has increased to 5.11%, while the 2-year yield has increased to 4.90%. The 10-year real yield climbed to 2.76%. The surge in real yields raises the cost of holding silver because it pays no interest. In my view, silver remains under pressure in the short term as the US dollar and Treasury yields continue to rally.
Brent Oil Price Forecast
Every new Brent Oil analysis as it publishes, today's technical signal and key levels, live price — on one page.
See all Brent Oil forecastsSilver Technical Analysis: $60 Support and the $50-$55 Zone
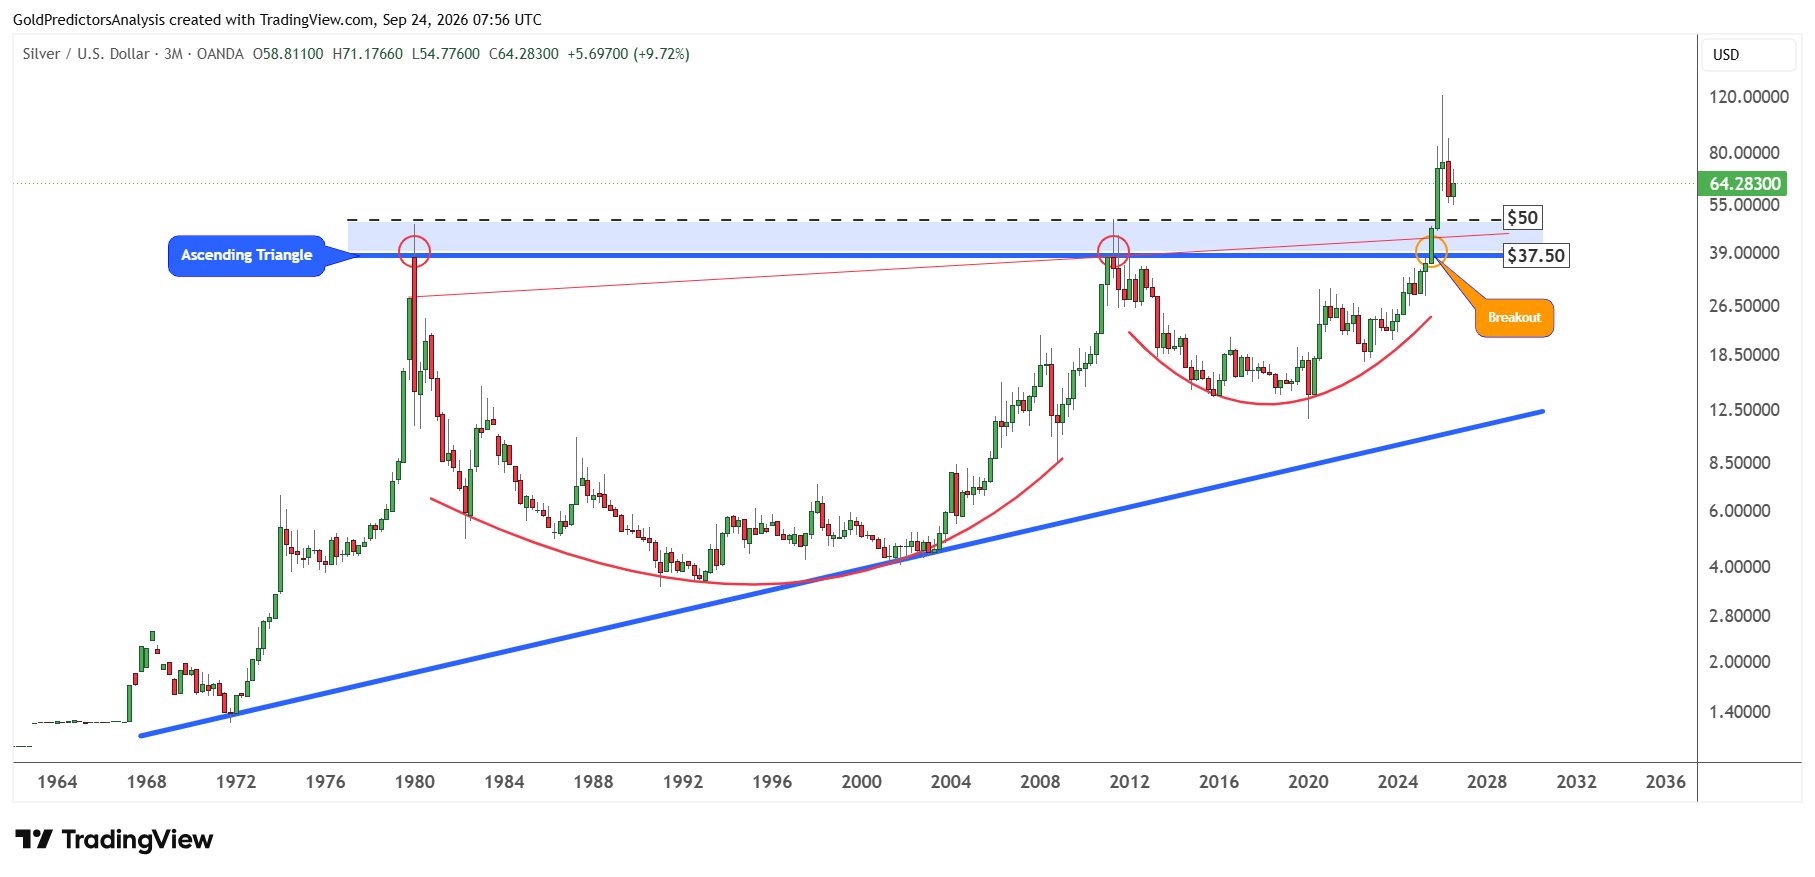
Silver prices are consolidating in Q3 2026 above the long term support zone around $50. The chart shows that silver prices recorded a 22.03% loss in Q2 2026, which pushed prices to $55.60 before the initial recovery. This was the first negative quarterly close after five consecutive quarterly gains. It indicates that silver entered correction before the next strong rally.
The formation of ascending triangle since the 1980s shows constructive bullish price action. The cup and handle pattern from 1980 to 2025 suggests that the next correction will likely offer strong support for long term investors. The support zone in the long term remains between $50 and $37.50. As long as this support zone holds, the next move in silver will likely be much higher toward the $200 area.
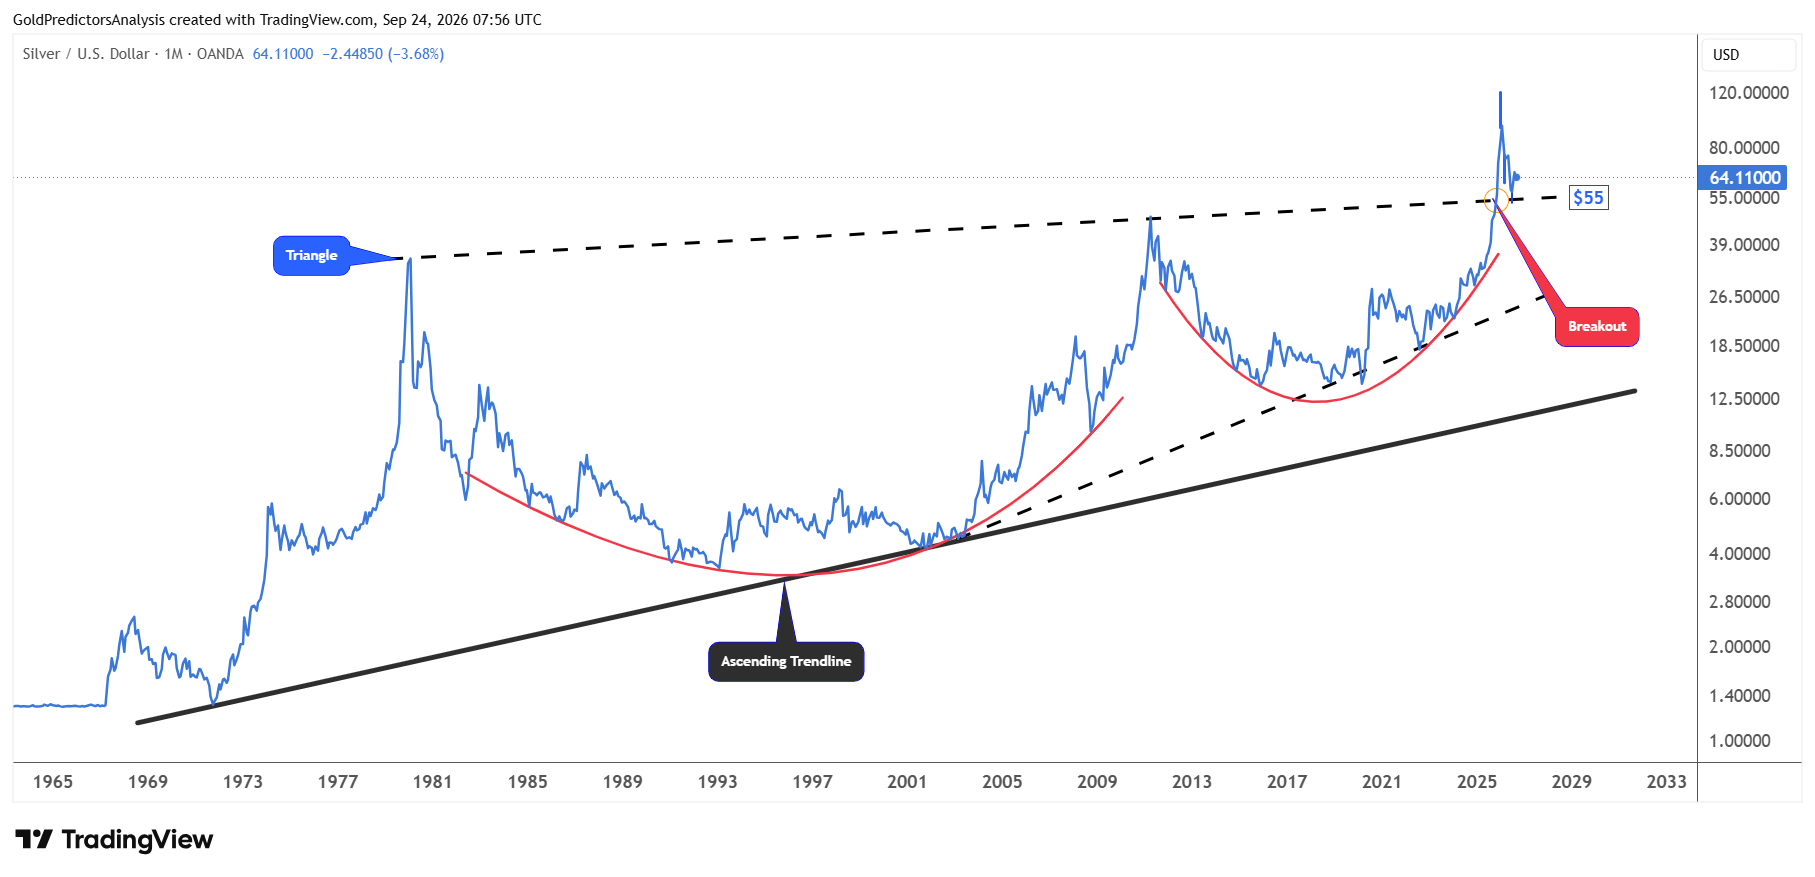
The constructive price action in silver is also visible on the monthly chart, which shows the formation of triangle pattern. The chart shows that the upper boundary of the first support is at $55. A break below $55 will likely push prices toward $50.
The chart shows that the price is approaching this support after hitting the $120 area. If the price continues to drop to $50, it will be the first touch of this support after the peak, which increases the likelihood of a strong rebound.
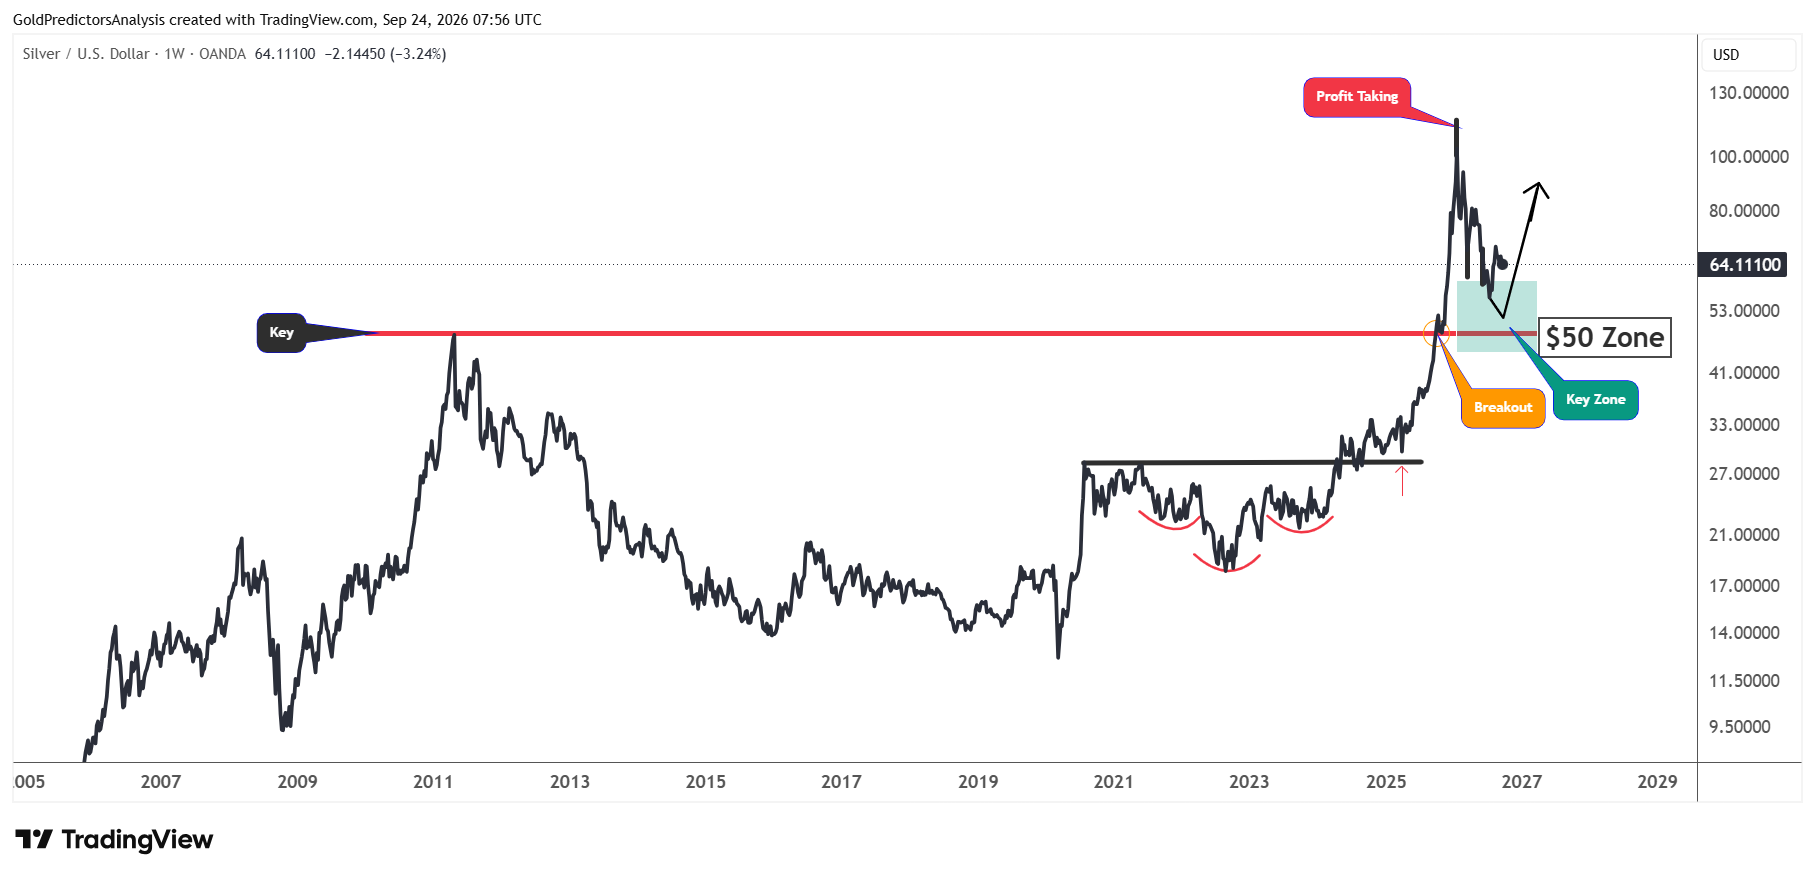
The weekly chart also shows the constructive bullish price action in the long term. Silver consolidated from August 2020 to August 2024 to form an inverted head and shoulders pattern before surging toward the $120 area. The recent correction from $120 is due to profit-taking.
The silver price has now reached the green zone between $45 and $55, which is considered a key zone for investors. Once this correction is over, prices will likely continue to rally.
Gold-to-Silver Ratio: 64 and 73 Levels to Watch
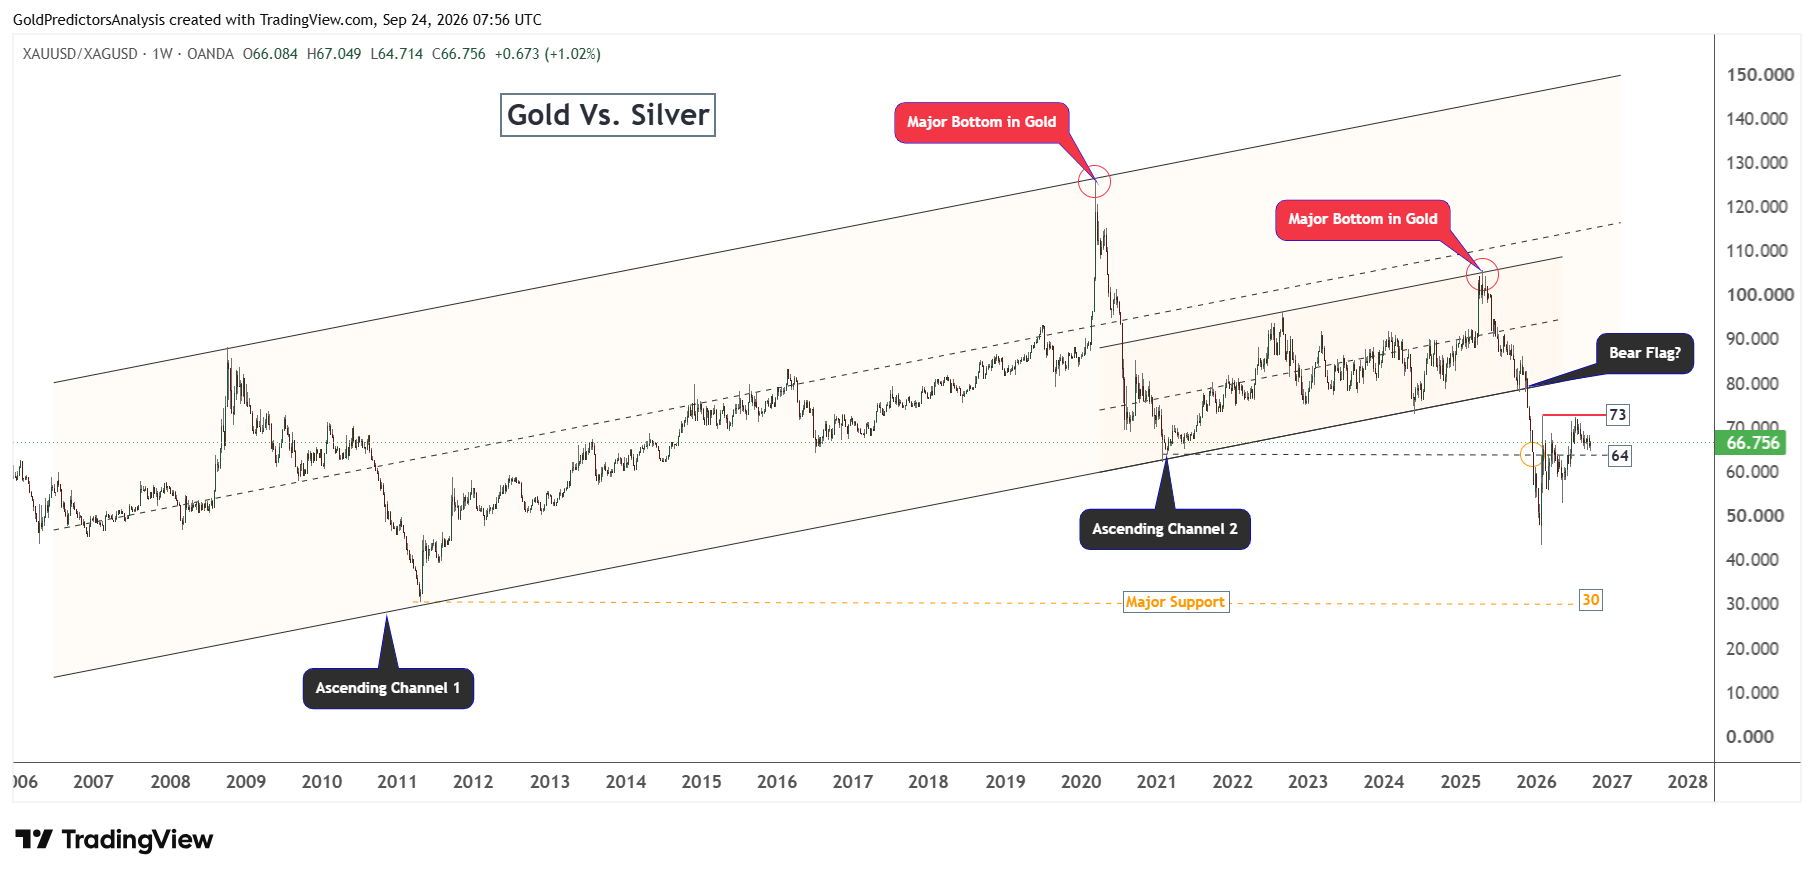
The gold to silver ratio adds another perspective to the correction in silver. The chart below shows that the ratio has rebounded to about 67 after falling to 43.40 when gold reached $5,600 and silver reached $120.
A rising ratio means gold (XAU) is outperforming silver. The chart shows that major peaks in the ratio mark important turns in the metals market. The current rise in the ratio has yet to form a clear peak that would confirm a bottom in silver. Therefore, until a major peak forms in the ratio, silver prices may continue to consolidate or drop.
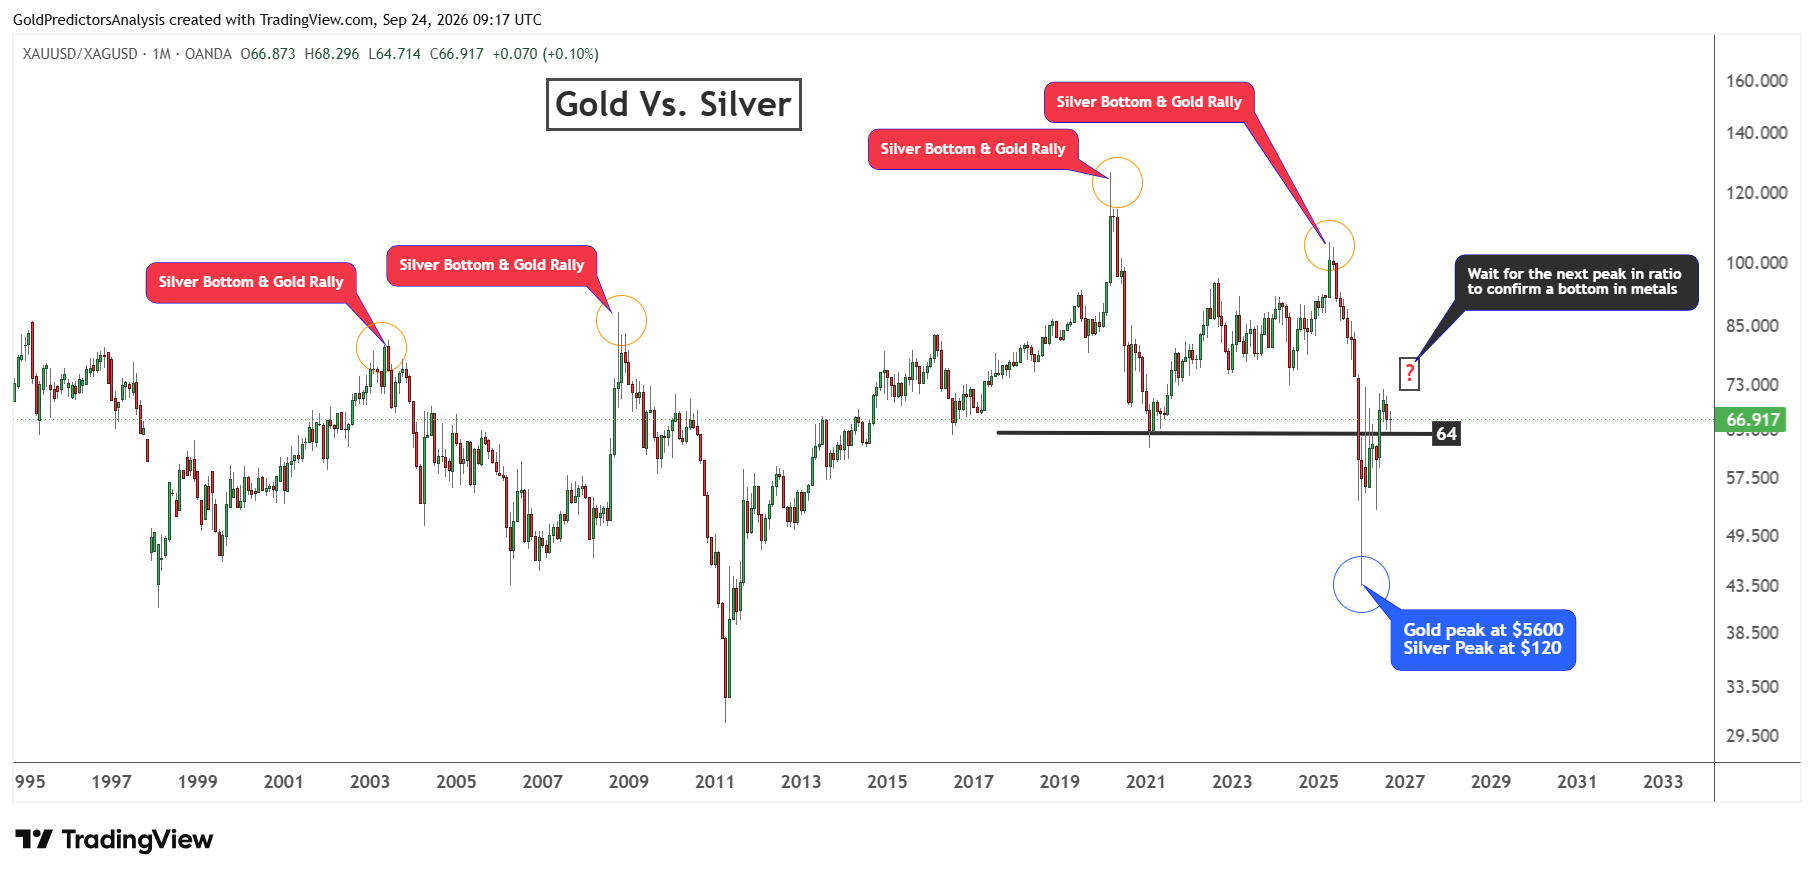
The weekly chart shows that the ratio has fallen below the rising channel. The ratio now trades between support at 64 and resistance at 73. The recent bounce in the ratio could form another bear flag pattern. A break below 64 would suggest that silver is starting to regain strength against gold. But a move above 73 would weaken that view and point to further underperformance in silver.
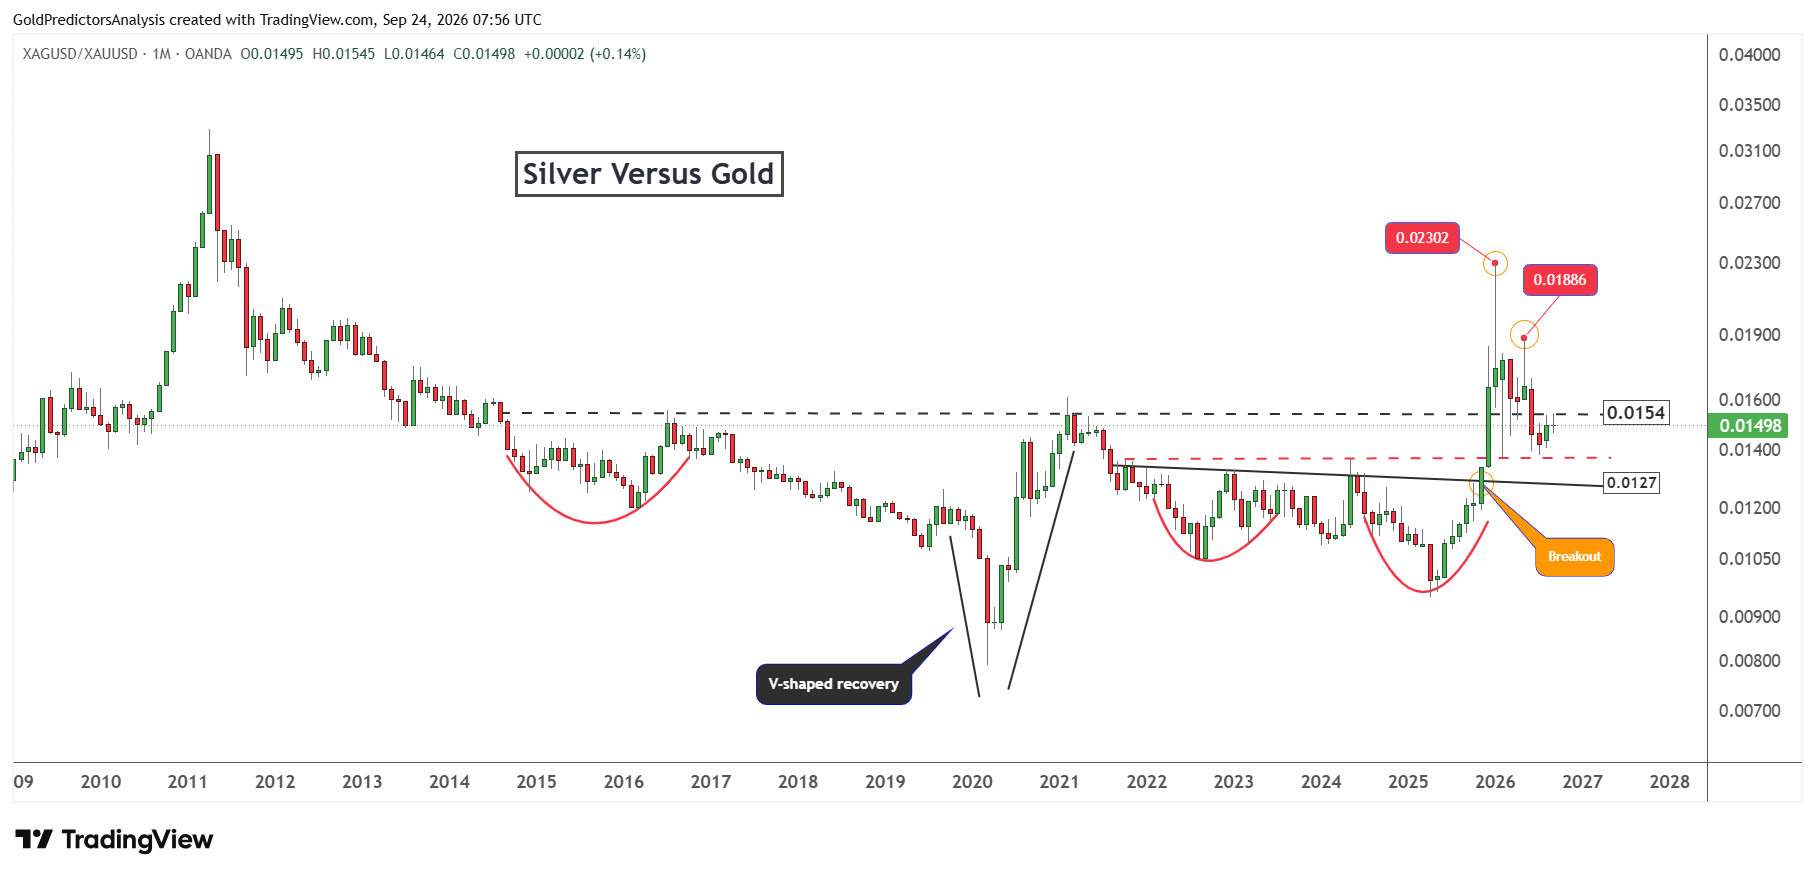
The silver to gold ratio shows the same test in reverse. The ratio is near 0.0150, below resistance at 0.0154, after breaking above the long-term level at 0.0127. The 0.0154 level corresponds closely to 64 on the gold to silver chart. A sustained break above it would strengthen relative performance of silver and bring the earlier peaks at 0.01886 and 0.02302 back into view. Until then, high yields and the stronger dollar may continue to limit the recovery in silver.
What to Watch Next in Silver
The silver outlook remains constructive in the long term, but high yields and a stronger dollar are putting pressure on the price now. The strong PMI report also gives the Fed reason to remain cautious about inflation. If yields continue to rise, silver may continue to consolidate or fall. A pullback in yields and the dollar would give the price more room to recover.
The first support level for spot silver is $60. A break below this level would bring $55 and then $50 into focus. As long as the silver price holds the $50-$55 support zone, the recovery is possible. Silver would need to regain $72 to show stronger momentum. The gold to silver ratio adds another test. A break below 64 would favour silver while a break above 73 would show that gold is still leading.
The US durable goods report and final September consumer sentiment survey on Friday could affect expectations for growth and inflation. The PCE inflation report for August follows on September 30. Softer inflation could ease pressure on yields and support the silver price. But strong data, further hawkish Fed comments or another rise in oil prices could keep silver under pressure.
Read more: Gold Lags S&P 500 as Real Yields Stay High