



The 10-year Treasury yield ended July at 4.75% its highest close of the quarter, two sessions after the Fed held rates for the fifth meeting in a row. The easy read that evening was a hawkish committee. The curve then spent the rest of the week moving the wrong way for that story. Buyers, in my read were charging more to hold long federal debt and I expect a 5.00% print before the September meeting.
The Fed Held Rates, and the Long End Sold Off Anyway
On July 29 the FOMC left its target range at 3.50%-3.75% on a 9-3 vote, with Hammack, Kashkari and Logan dissenting in favour of a hike. A selloff driven by that vote should have landed hardest on the 2-year, which instead eased over the session from 4.26% to 4.22% on Treasury’s par yield curve while the 30-year rose from 5.09% to 5.20% and the 10-year from 4.61% to 4.67%. By July 31 the gap had held, the 10-year had reached 4.75% and the 30-year sat at 5.27%.
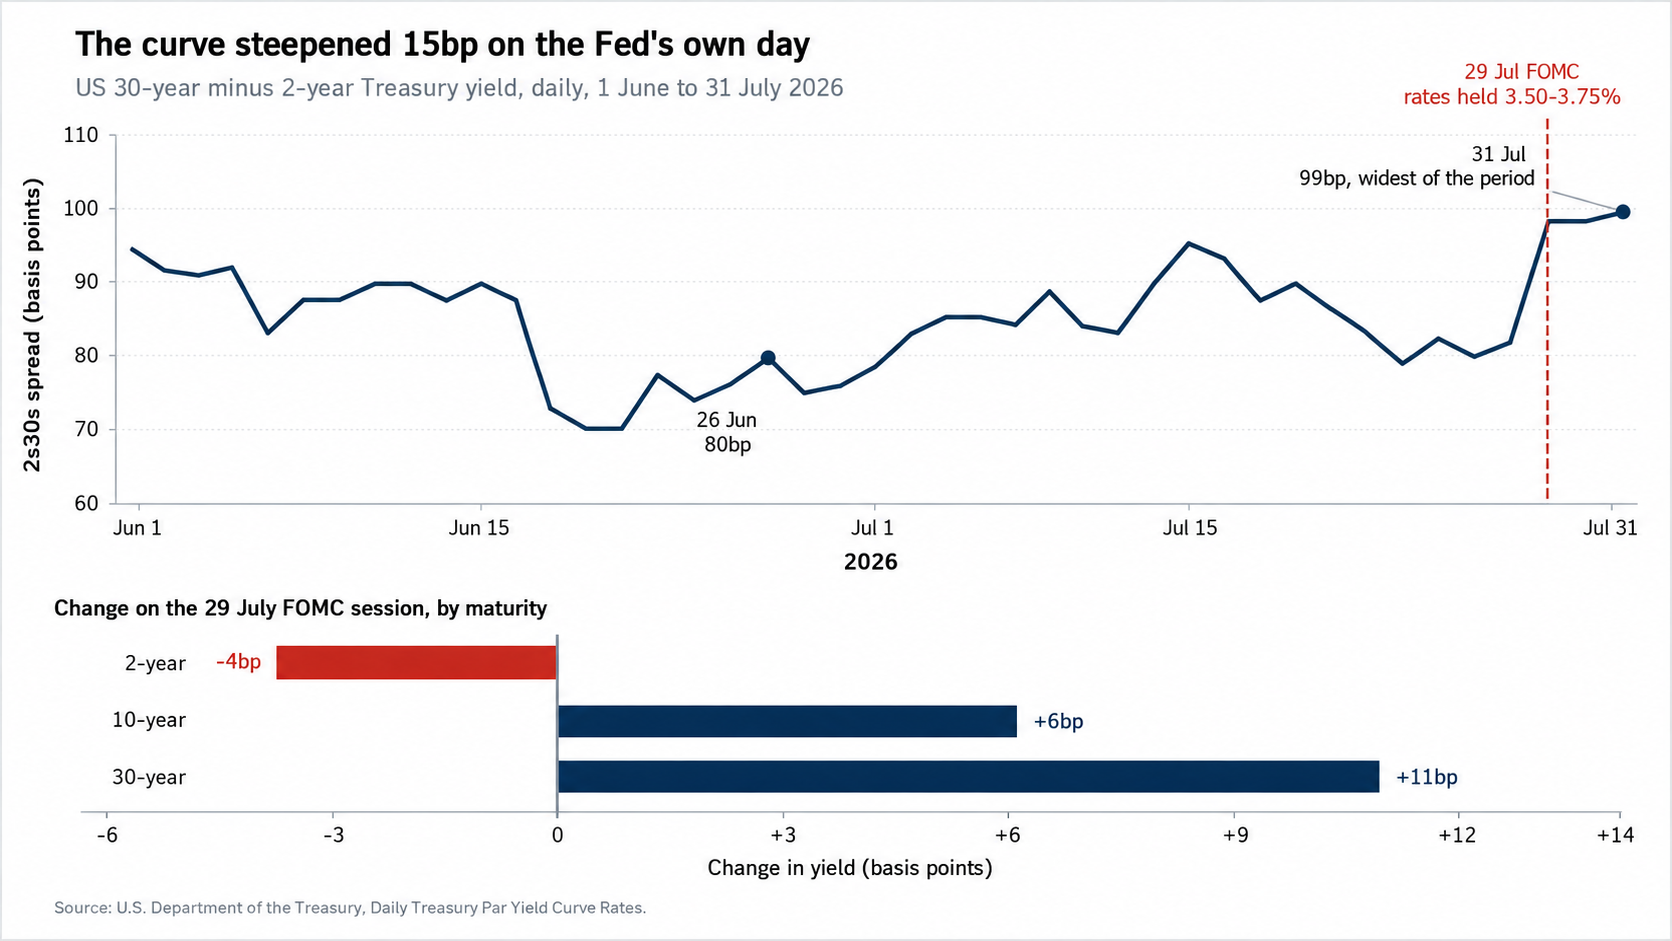
A change in the expected policy path shows up mostly in the short end. This move showed up mostly in the long end, so I think the market was repricing something other than the Fed.
Real Yields Did the Work, Inflation Didn’t
At the June 26 trough the 10-year stood at 4.38%, so the rise into July 31 comes to 37bp, with the 30-year adding 40bp over the same stretch and the 2-year only 21bp.
Gold Price Forecast
Every new Gold analysis as it publishes, today's technical signal and key levels, live price — on one page.
See all Gold forecastsBefore reading anything into that, I split the rise into its real and inflation parts. Through July 30 the 10-year real yield went from 2.18% to 2.41%, a 23bp rise, while the breakeven implied by the gap to the nominal went from 2.20% to 2.27%. That put about 77% of the move on the real side. Inflation compensation stayed inside the same 8bp range it has held since the June 26 trough, which for that series is unusually quiet.
Financial Analysis
Quantitative: Term Premium Did Half of It
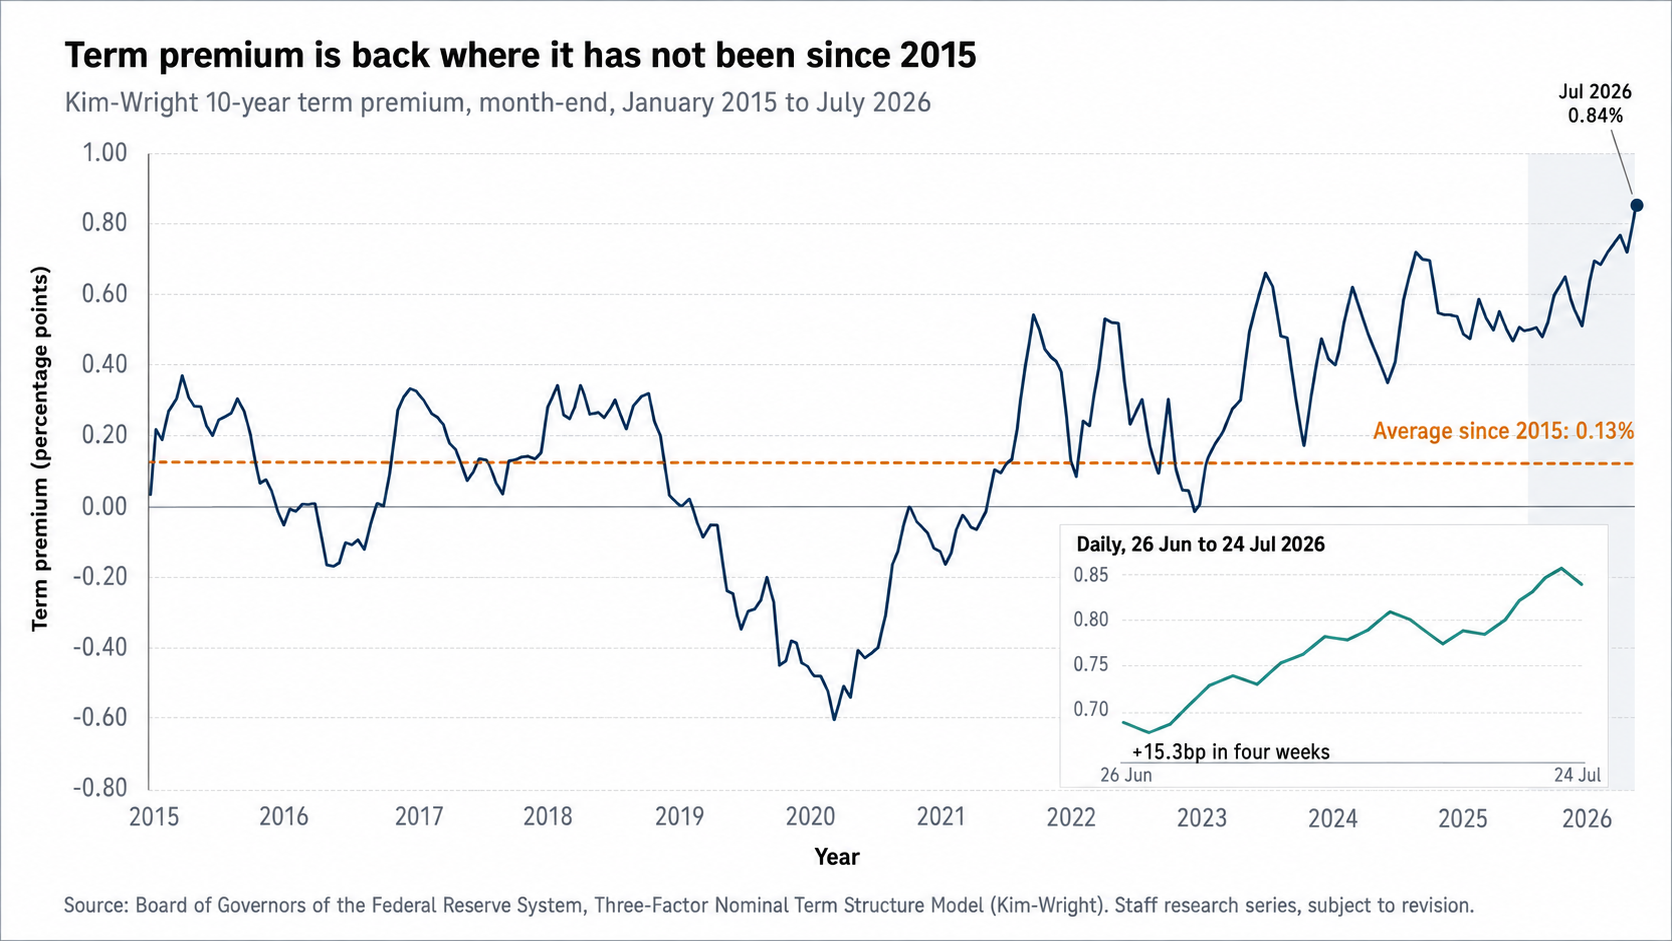
To see what was moving the real side I took the 10-year apart: the average short rate the market expects over the next decade, plus a premium for carrying duration risk. For that second piece the Federal Reserve Board publishes a model estimate, the Kim-Wright 10-year term premium defined as the yield minus the expected average short rate, and it flags the series as staff research that gets revised. so I leaned on the change more than the level.
Between June 26 and July 24, the last date in the series, the premium rose from 0.68% to 0.84%, call it 15.3bp, while the 10-year rose 31bp over the same window. So just under half of the move came from compensation for holding duration, and the expected path supplied the rest.
Its level stood out too. Since 2015 it is averaged 0.13% its highest reading in those eleven years was 0.8621% on 19 May 2026, and the July 24 print sat about two and a half basis points below that high while still climbing.
Fundamental: Demand Is Fine, at a Price
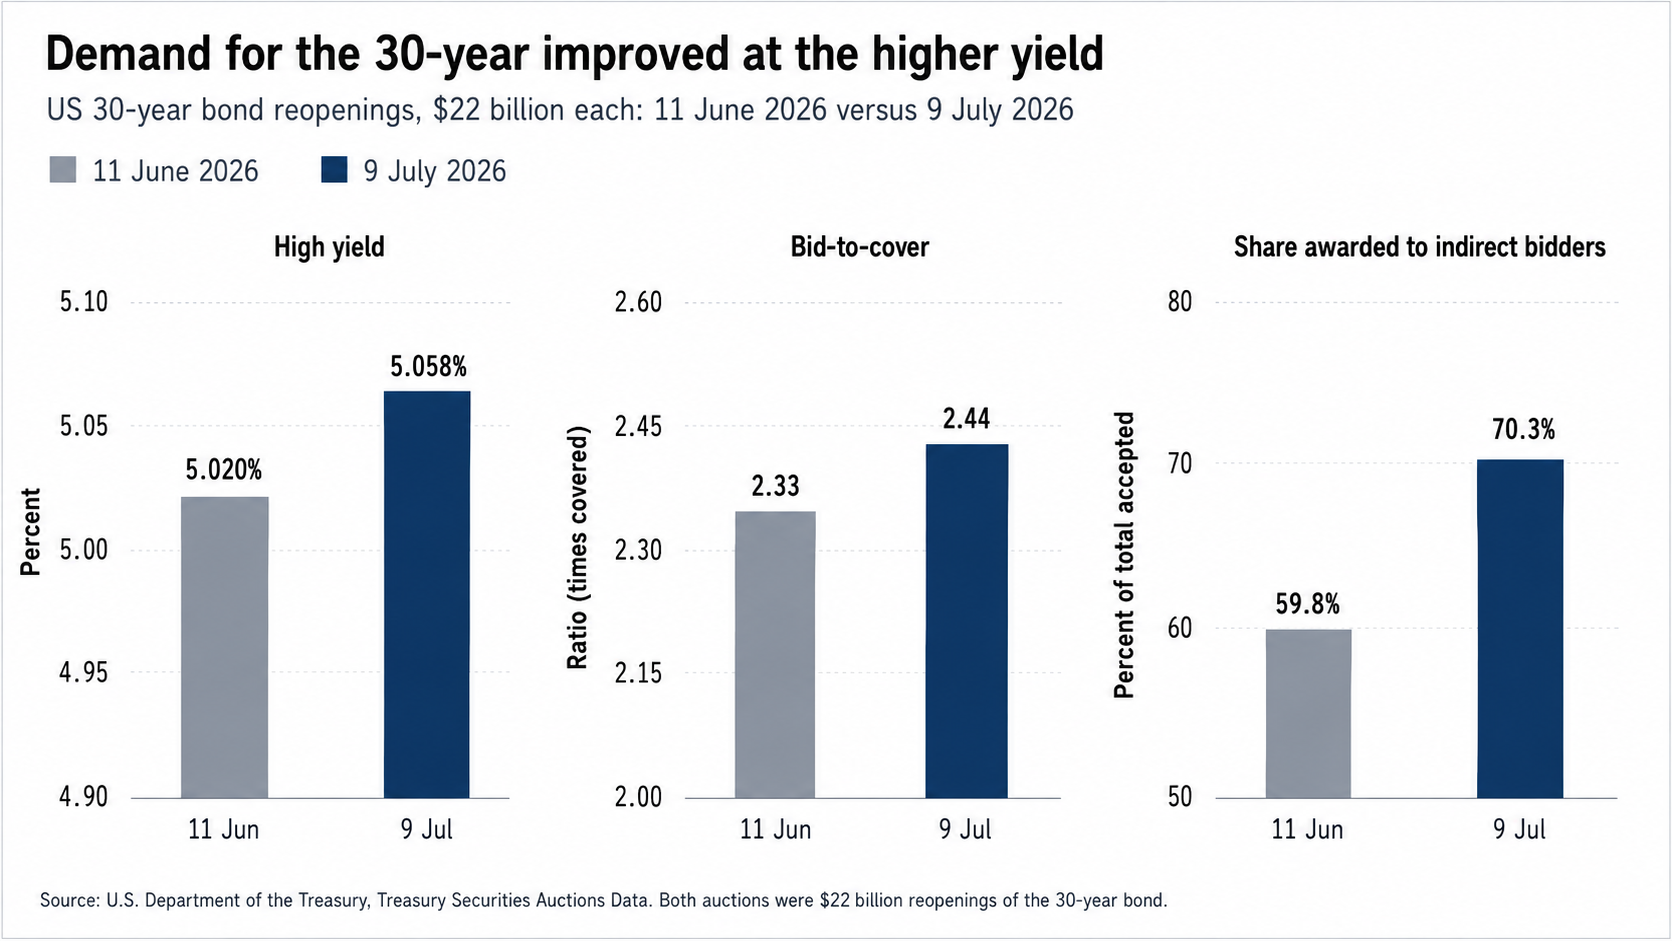
Next I checked the auction record, where a real buyers’ strike would show up first. I found the opposite. Treasury’s auction records show the July 9 reopening of the 30-year clearing $22 billion at 5.058% with a 2.44 bid-to-cover and indirect bidders taking 70.3%, while June’s auction had gone at 5.020% with 2.33 and 59.8%. Demand improved between the two. Indirect bidders, mostly foreign and official accounts, took more of the paper once the yield was nearly four basis points higher.
That looks to me like buyers repricing what they charge to absorb the supply, and the early August calendar tests that price i.e. Treasury releases its borrowing estimates on August 3, the quarterly refunding statement follows on August 5, and since Treasury has guided coupon sizes steady for several more quarters, the tell is whether that guidance survives.
Positioning: The Crowding Sits in the Basis, Not in a View
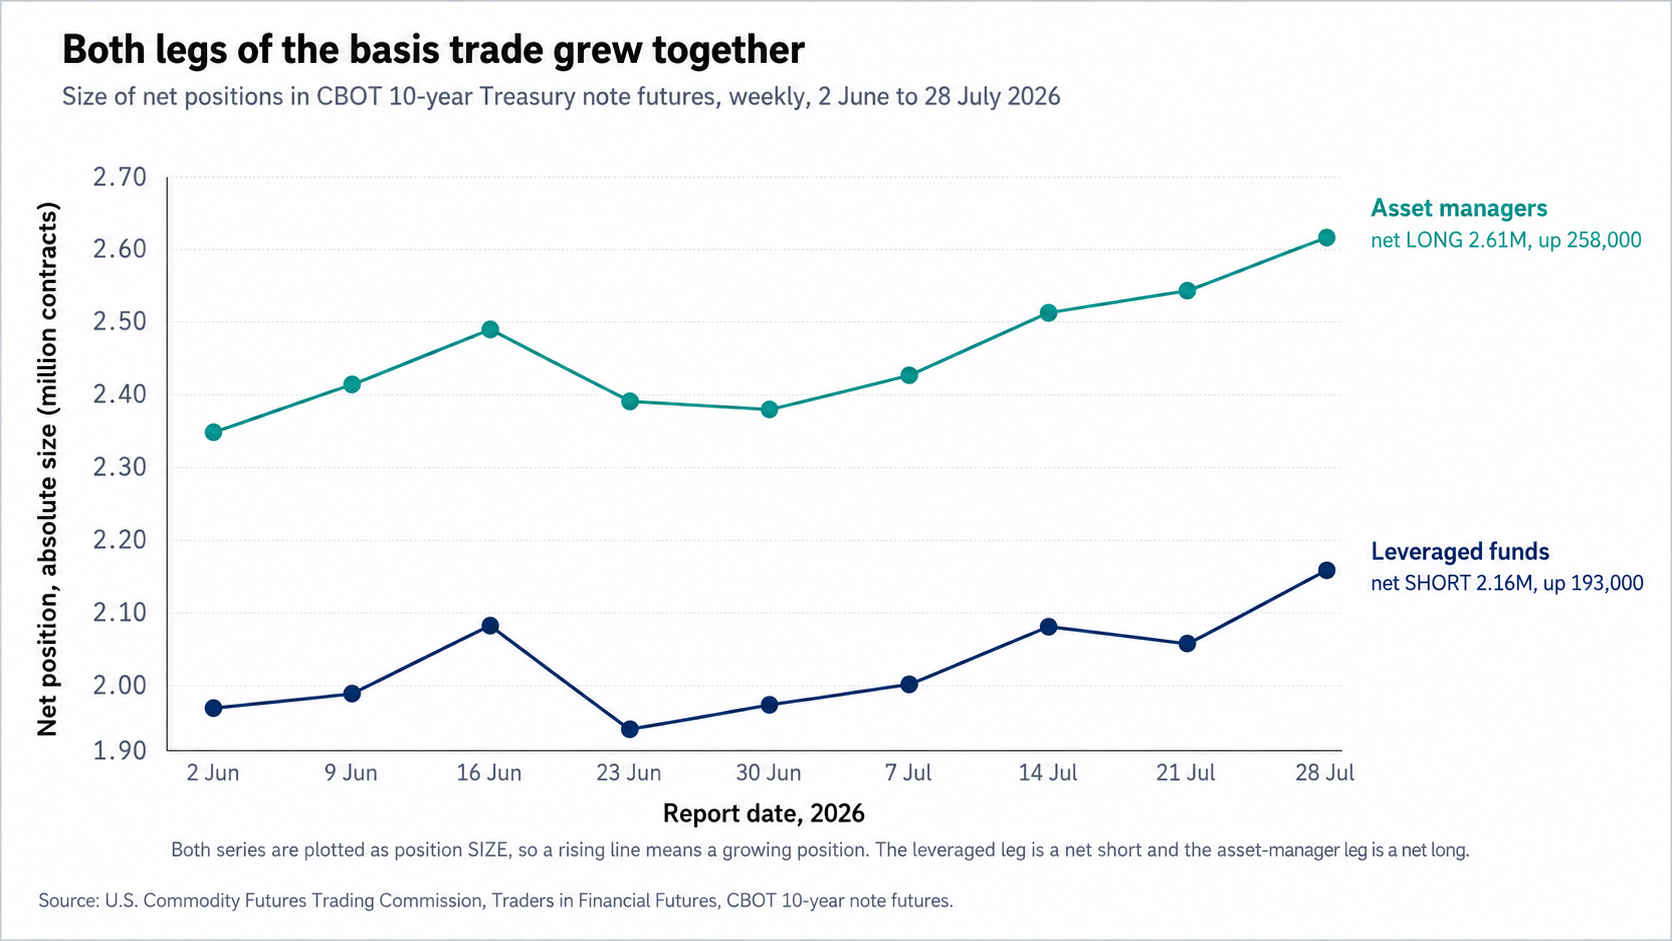
Leveraged funds took their largest net short since early June into the FOMC. CFTC’s July 28 report on 10-year note futures shows leveraged money net short 2.16 million contracts, up 193,000 since June 2, while asset managers sat net long 2.61 million, up 258,000.
That reads at first glance as a squeeze risk against my call, but both legs grew almost in step, which told me I was looking at the cash futures basis trade i.e. a short futures position hedging a long cash bond, so there is no view in it to capitulate on. It does carry financing risk, and a repo shock that forced those positions to unwind would push cash yields up before anything else moved. If that ever happens, the move would be in the direction of my call.
Cross-Asset: Gold Behaved Exactly as It Should Have
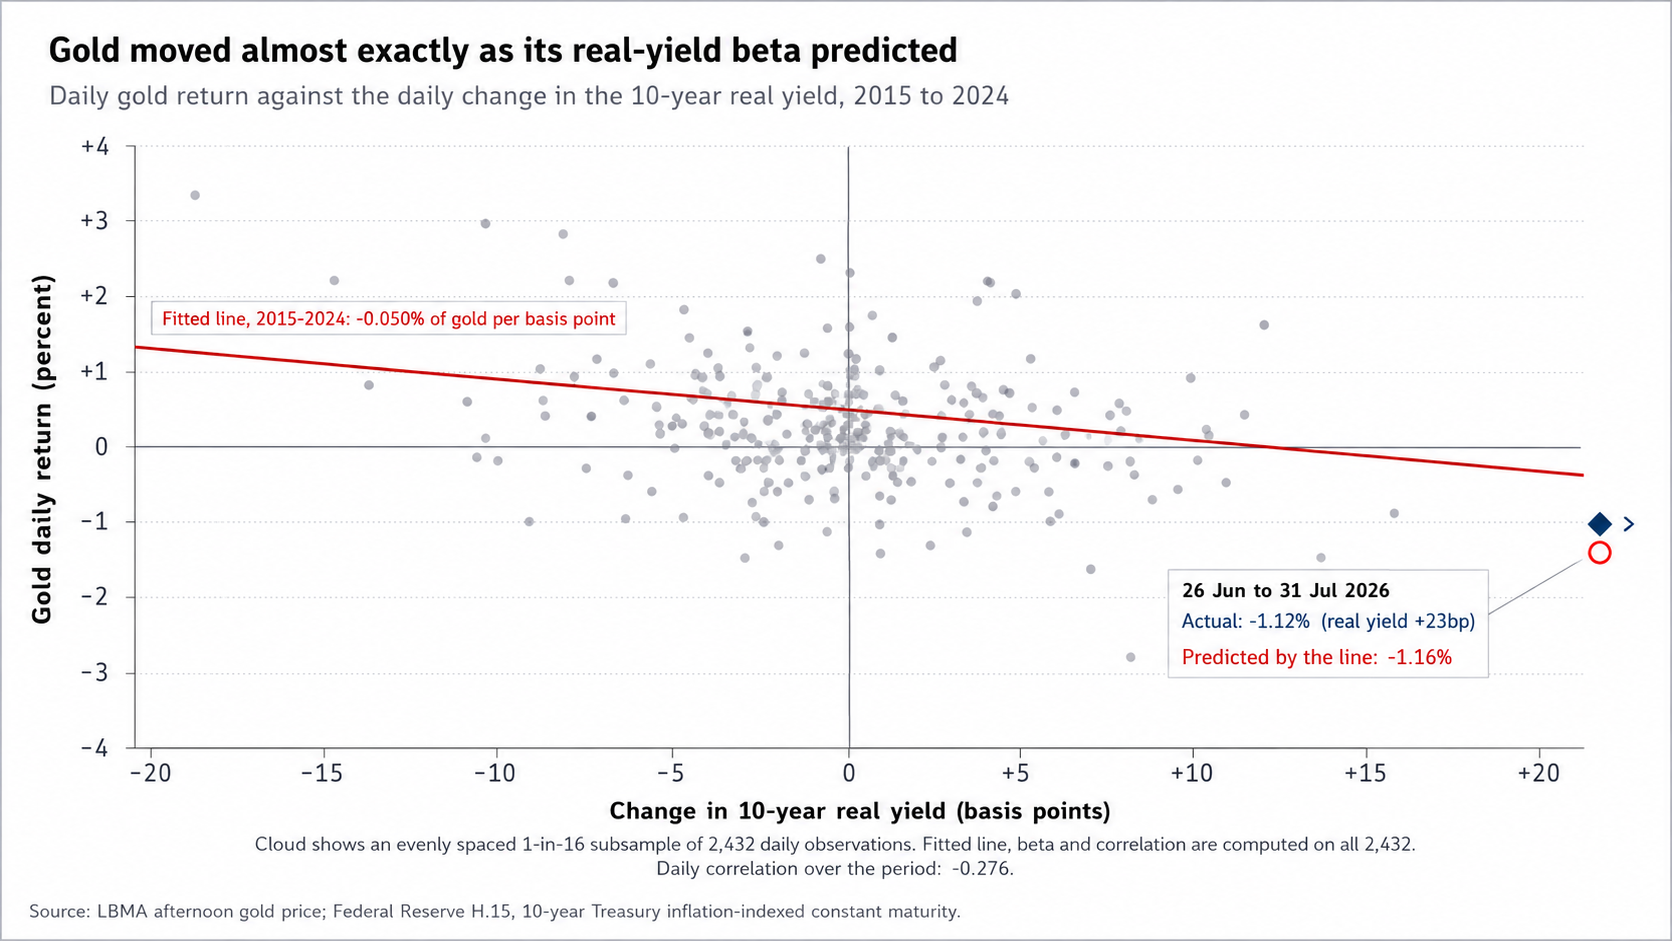
I expected to find that gold had decoupled from real yields between late June and July, since a term-premium-driven rise carries a fiscal signal gold buyers usually like. It hadn’t. I regressed daily gold returns on daily changes in the 10-year real yield over 2015-2024 and got a beta of -0.050% per basis point, which on the 23bp rise predicts a fall of about 1.16%. On the LBMA afternoon fix, gold went from $4,072.05 on June 26 to $4,026.60 on July 31, a fall of 1.12%. My prediction missed by four hundredths of a percentage point.
I would not lean on this relationship day to day, because the daily correlation is only -0.276 over 2015-2024 and -0.178 over January through July 2026; in my regressions the link only showed up over weeks. Over these five weeks it held. Gold has already paid for the rise in real yields that happened, and if the 10-year keeps going I expect gold to keep paying.
Position and Risk
In my view the 10-year Treasury yield keeps rising into the September 15-16 FOMC. I built the target out of the decomposition above. On July 24 the 10-year stood at 4.69%. The term premium that day was 0.84%. Subtract the second from the first and the expected-path component is 3.85%. I held that component still and solved for the premium instead. At 1.15% the ten-year prints 5.00%. Getting there asks 31bp more over eight weeks. The four weeks to July 24 delivered 15.3bp, so July’s own pace, run eight weeks further, lands almost exactly on the number.
The asset is the US 10-year Treasury yield, and spot gold carries the cross-asset expression. My direction is higher yields and lower gold. My target is 5.00% on the ten-year, or 5.10% if the August 5 refunding drops that steady size guidance with gold at $3,960. The timeframe runs through the September 15-16 FOMC. Fair entry sits in the 4.60%-4.68% band, which held on every pullback since July 20. A daily close below 4.55% invalidates the view. So does 2s30s flattening back inside 80bp.
Gold priced off the same arithmetic. I took a 5.00% nominal against the breakeven at its July 31 level of 2.28%. That leaves a 2.72% real yield, 31bp above the July 30 reading. Through the measured beta it comes to another 1.55% off gold. From the July 31 fix that’s $3,964, and I rounded the published target to $3,960.
Then I sized the risk. Across the 60 sessions through July 31 the daily changes in the 10-year carried a standard deviation of 4.47bp. Scaled to eight weeks that’s roughly 28bp. My 25bp target therefore sits inside one standard deviation, and the same move the other way puts the ten-year near 4.47%, through the invalidation level. Ordinary volatility could end this call inside the window. Soft labour data landing while Treasury reaffirms that steady size guidance worries me more.
That pair leaves the market a weaker growth signal and no new supply to price takes the premium out, and sends the ten year back toward the 4.55%-4.60% area it traded through mid July. About 20bp from the July 31 close. I’d have the mechanism wrong.
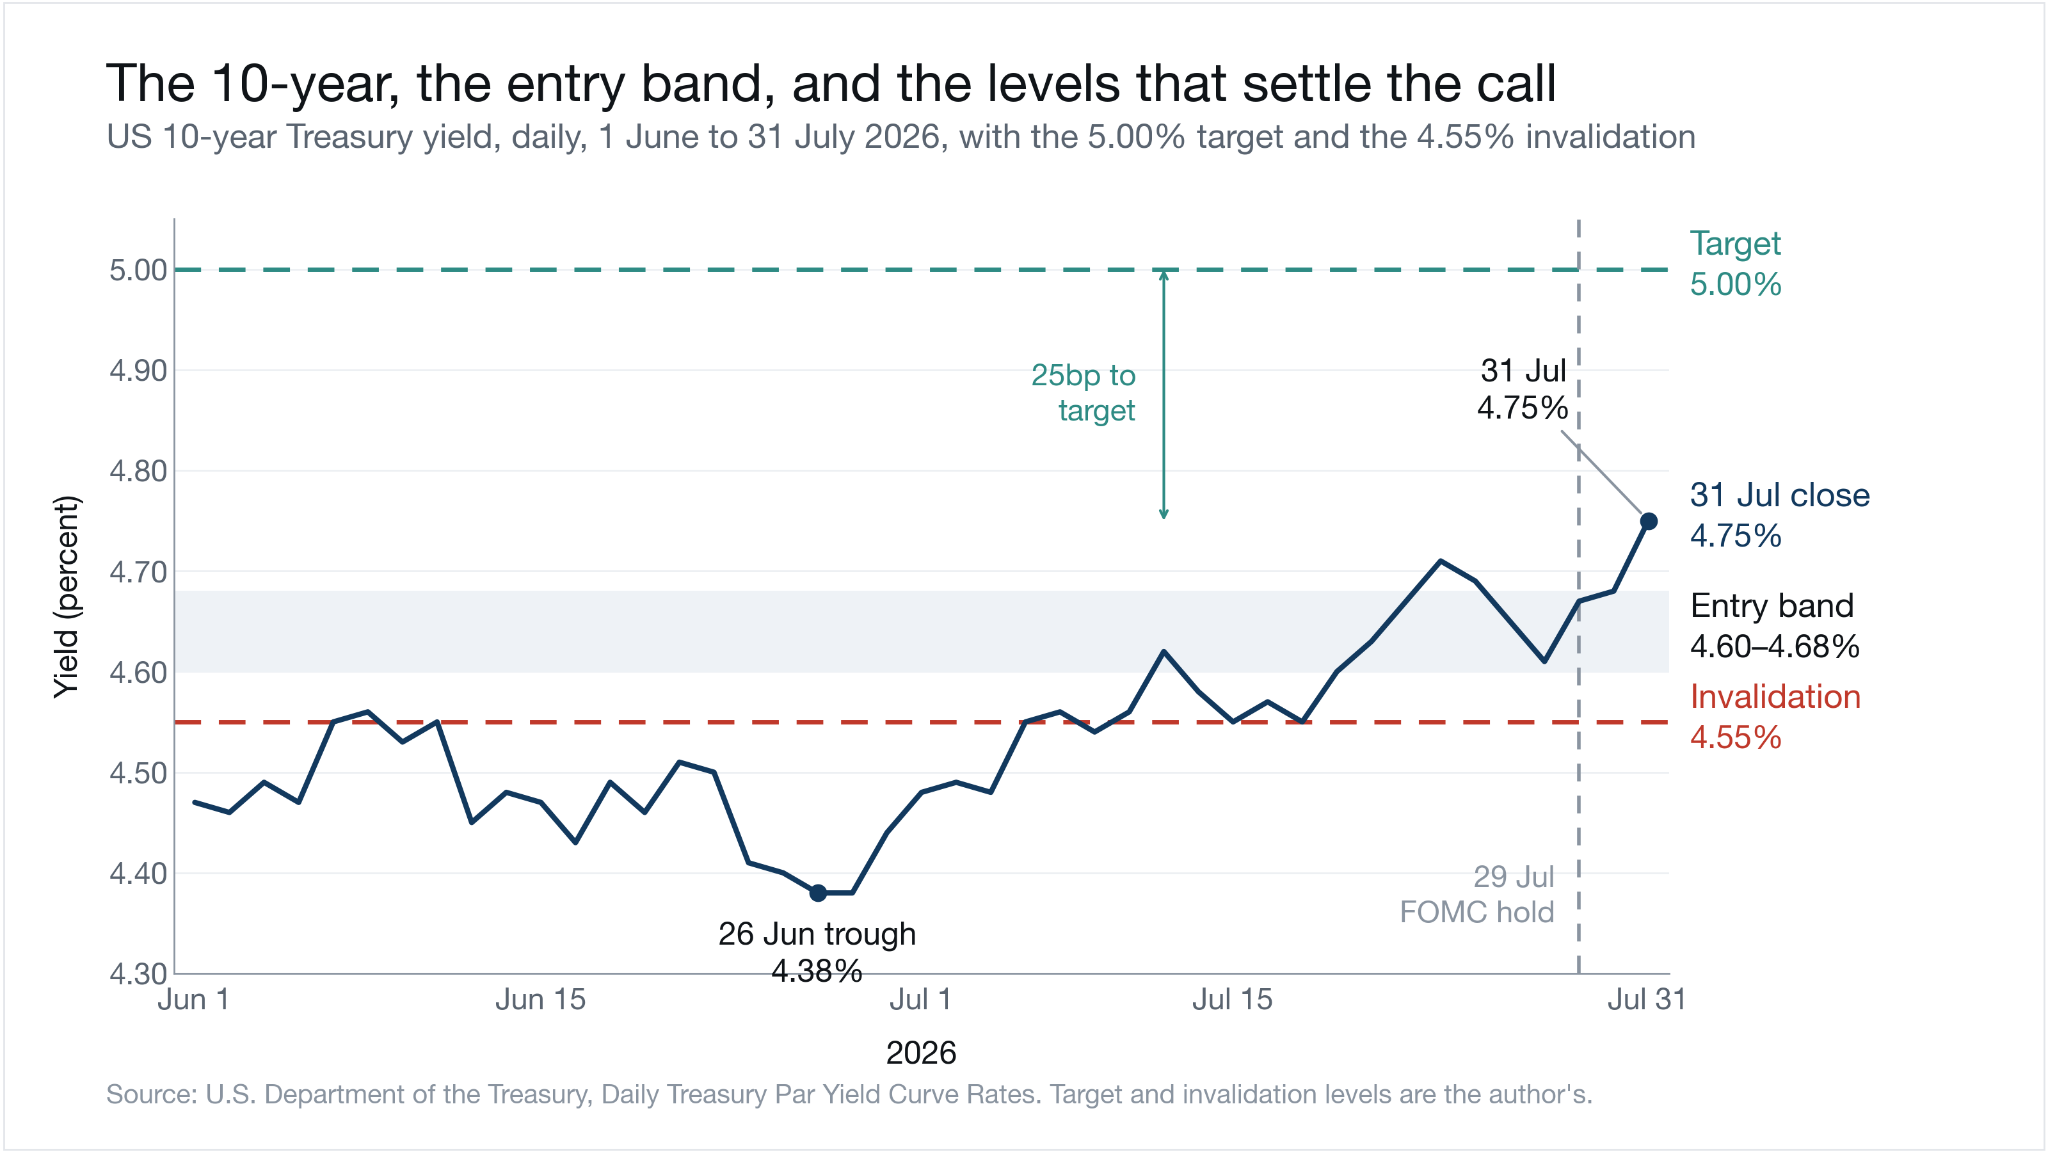
The US 10-year Treasury yield, daily from June 1 to July 31, 2026, with the 4.60 to 4.68 percent entry band shaded and the 4.55 percent invalidation level marked. Takeaway is July closed at the top of the two month range, roughly 20 basis points clear of the level that ends the call.
Conclusion
My base case into the September FOMC is a 5.00% ten year. The further rise comes from term premium and policy expectations stay near where they sit now. Gold lands near $3,960 on that path, through the real yield channel. A close below 4.55% tells me the call has failed.
Six to twelve months out I expect the structure to hold. The term premium averaged 0.13% for a decade and read 0.84% on July 24. I can not see what takes it back down while borrowing runs at this scale, short of a fiscal change nobody has announced. Equities meet the same mechanism next. I worked through that in my June analysis of the S&P 500 under Warsh’s committee when this Fed first turned hawkish, and my next date to watch is on the FOMC calendar: September 15.