



Japan just raised interest rates to its highest level since 1995. The yen pushed higher anyway and USD/JPY is now trading at its highest level since 2024. That is the real story, a hawkish rate hike that the market barely reacted to. In my view, that alone marks a top in USD/JPY. The two underlying dynamics are moving in opposite directions and the Treasury holdings data is where the more important signal may be emerging. It is still only a clue with no confirmed trend behind it yet, but it is worth paying closer attention to than most of the coverage has.
The News: A Hike Nobody Flinched At
Let’s start with the vote. The Bank of Japan raised its policy rate by 25 basis point to 1%, it’s highest level in more than three decades. The decision passed by a comfortable seven to one margin. For a rate hike of that size, the market reaction was mostly muted. The move had been telegraphed for weeks , but even so, a hawkish BoJ should have offered the yen some support but it didn’t. USD/JPY is now sitting near 161.2, which is above the 160.50 – 160.60 zone that had acted as a key line in the sand and beyond the level that Tokyo spent billions defending during its record April 30 intervention.
Now a broken resistance level like this means the pair wants to go higher, so the breakout itself is working against a bearish call here. What keeps the call alive is the silence. A genuinely hawkish hike came and went and there was no real rally to speak of. And now the break has just stalled and is sitting right in that 161–162 zone where Chief Cabinet Secretary Minoru Kihara came out on June 18 and dusted off the intervention language. The market’s not really watching carry unwind risk right now it is watching for Tokyo to move. That’s the dynamic. Moves everyone sees coming rarely spark a stampede, and this one had about three days of warning.
The geopolitics were supposed to help, and briefly looked like they would have. The Washington and Tehran signed a 14-point memorandum of understanding on June 17 to reopen the Strait of Hormuz. The truce lasted for only three days. On June 20 Iran shut the strait again, pointing to Israeli strikes in Lebanon as a breach of the ceasefire. CENTCOM said traffic was flowing; the transit trackers said otherwise, with commercial passages sitting near zero by June 21. So while the diplomats keep talking in Switzerland, Japan’s energy lifeline is blocked again, and the cheap oil leg of this trade has quietly gone missing.
The Context: Two Different Clocks
The standard write usp treats carry as one big pile of money. That is where most of them get it wrong.
USD/JPY Price Forecast
Every new USD/JPY analysis as it publishes, today's technical signal and key levels, live price — on one page.
See all USD/JPY forecastsThe Bank for International Settlements actually did the autopsy on the August 2024 blowup and broke it apart properly. The genuinely speculative slice fast money, the fast money that can exit inside a week, came to roughly ¥40 trillion, call it $250 billion. That’s the part that blew up in August. Fine. But sitting behind it is something much heavier and much slower. Nippon Life, Dai-ichi Life and Japan Post Insurance between them sit on something like $2.7 trillion in assets.
How much of that $2.7 trillion is actually exposed to the yen is the actual open question, and the hedge ratio is where it gets murky. JPMorgan’s research cited that in the same reporting has Japanese institutional hedge ratios down to multi year lows, comfortably under the 50% you would need to justify the $1.3 to $1.7 trillion of hedged exposure that floats around in other write ups.
If the hedges have really come off, the number that everyone is quoting is too big. Simple as that. The actually hedged base is smaller than it looks on the surface.
So use $2.7 trillion as the size of the pond. How much of it is actually in the water that is still open. But whichever way you cut it, none of this moves fast. Six to eighteen months is the cycle. This is not the pool that panics.
For now the fast money is comfortable. A hike everyone had penciled in is not the kind of jolt that blew the trade apart in August 2024, when the yen tore about 12% higher through the worst of a multi-week run and hauled USD/JPY from the 162 area down to 142.
The BIS reached for that old carry trade cliché picking up nickels in front of a steamroller. The one that pays a little, and a little, and then takes your arm off. The nickels are still on the ground, the steamroller has not yet moved, and that’s exactly why the slow money is the part worth watching.
Financial Analysis
The Rate Gap Still Favors the Dollar, for Now
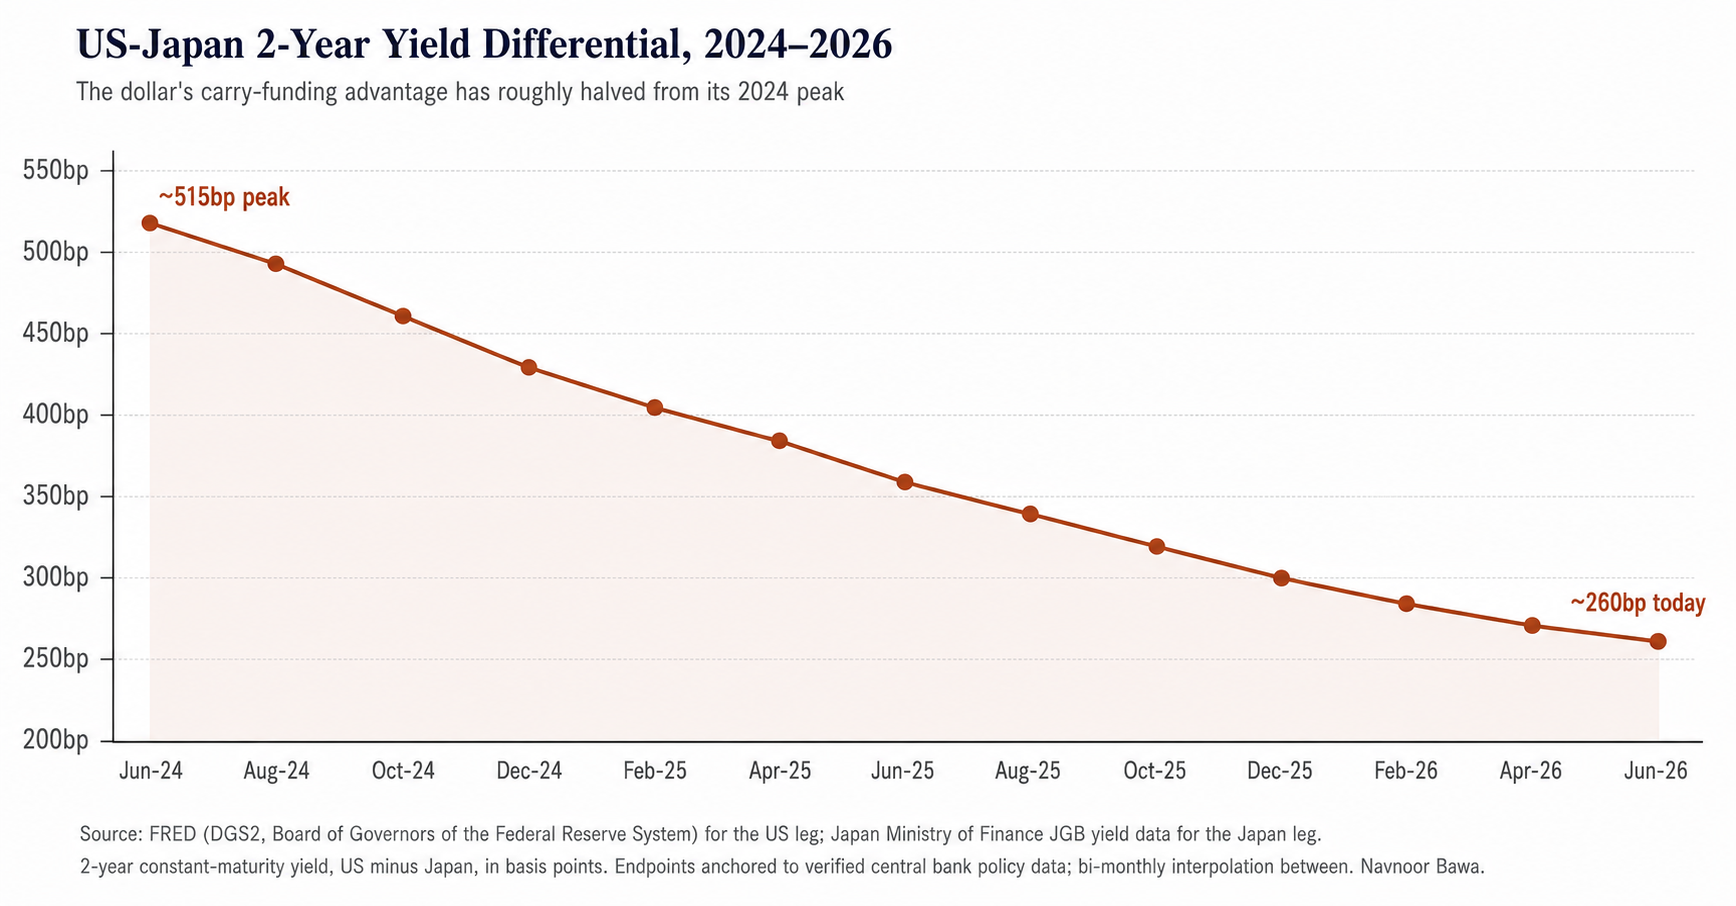
The obvious objection to all of this is that the carry trade still pays. The Fed sits at 3.5 to 3.75%, the BoJ at 1%, leaving a gap of roughly 250 to 275 basis points in the dollar’s favor. Rolled over, that is real income, and it is a large part of why the yen has not bounced.
Look at the trend, though. That gap topped 500 basis points in 2024 and has since then it has roughly halved, with the BoJ the last major central bank still leaning hawkish. The Fed side is also shakier than the headline suggests. One dot went missing from June’s Summary of Economic Projections, and the market read it as new Chair Warsh sitting out a rate forecast in his first meeting, though the Fed never says whose dot belongs to whom. Against that, half the committee still pencils in that at least one hike this year. Should that come through, the gap stops closing from the Americas end and the trade has to lean on the repatriation and energy legs instead. None of this forces an unwind on its own. It just wears the cushion thin, so that the next bout of volatility has less carry income to land on.
The Repatriation Case Has the Motive but Still No Flow
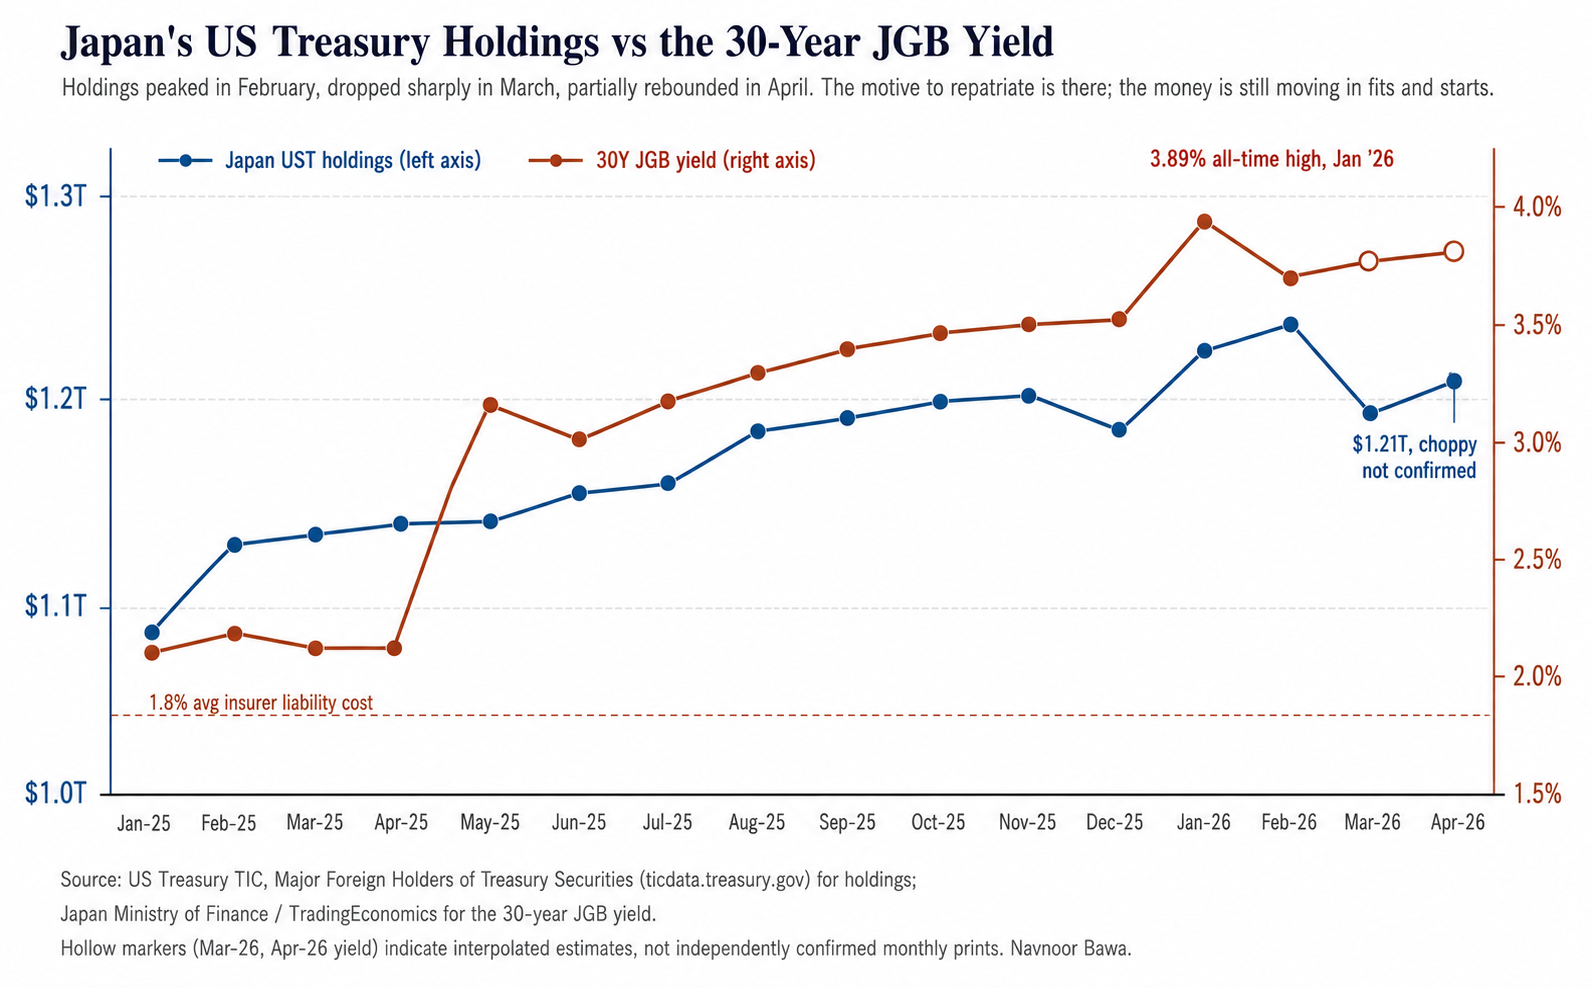
The Japanese government bond yields have run up fast. The 30 year touched at an all time high near 3.9% in January 2026 and stood at 3.84% on June 19, as per TradingEconomics, now miles above the roughly 1.8% average liability cost that the life insurers have to clear. Cross that line and bringing money home starts to make sense. Whether it has actually come home is what the TIC data below is there to test.
So far the incentive has not turned into a clean exit yet, and the numbers are bumpier than any single headline lets on. Japanese holdings of US Treasuries climbed to $1.24 trillion in February alone, and then slid almost 4% to $1.19 trillion in March, then clawed back to $1.21 trillion in April, the latest figure, released June 18. This series has wandered between $1.0 and $1.3 trillion for years now. Some of the moves are insurers rebalancing, the flow this thesis cares about; some are the MOF selling Treasuries to fund yen intervention, which is a different animal, and the two can wash each other out in the headline total. A sharp drop followed by a partial bounce does not make it a trend. It does mark the first real wobble the series has shown since the yield math flipped. TD Economics reckons that the eventual pull could add 20 to 50 basis points to the US 10 year over the medium term, whatever any one month happens to say.
The second leg is energy, and at the moment it is working against the yen. Japan’s fossil-fuel import bill came to nearly ¥22 trillion in 2025, around $147 billion, down from the ¥33.7 trillion spike of 2022 but still well north of the ¥17 trillion of 2021. The same IEEFA work spells out the tail risk. A drawn-out Hormuz closure could shave as much as 3% off Japanese GDP in 2026, exactly what the renewed shutdown above threatens. Reopen the strait for good and that import bill falls, handing the current account a lift that stacks on top of the repatriation story. Leave it shut and that lift simply is not there.
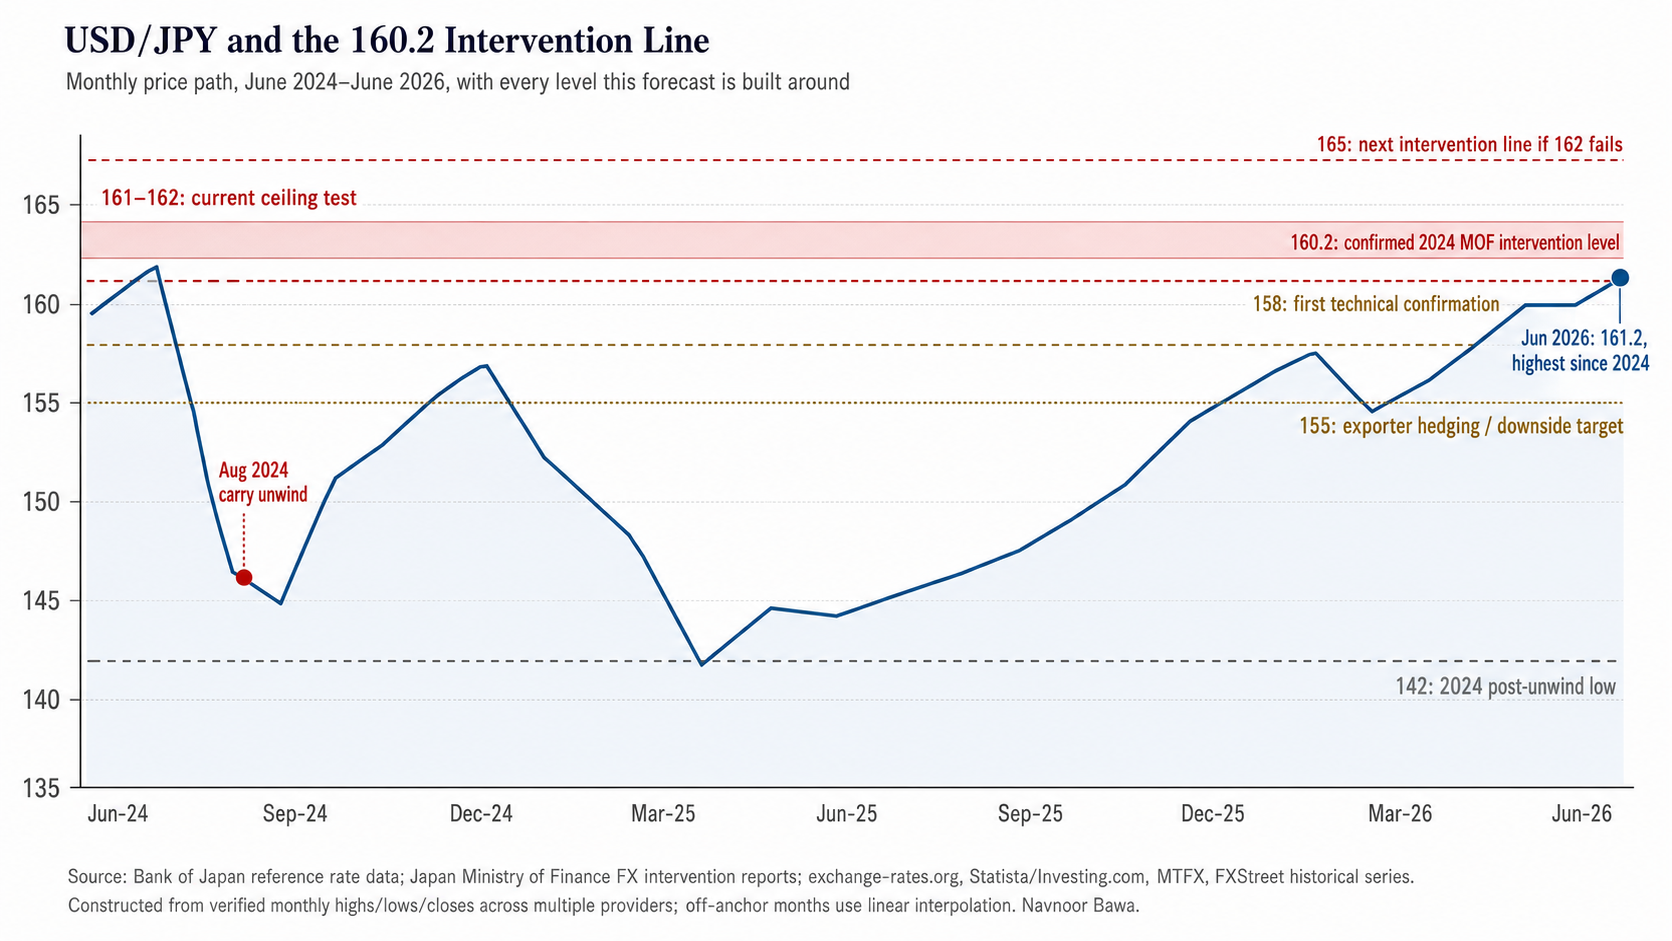
The 161 to 162 band earns its keep as a ceiling. Tokyo spent roughly $62 billion defending the yen in 2024 and stepped in around 160.2. Nobody short the yen at these levels is guessing where the pain threshold sits least of all now, with price parked right inside the zone.
Trade against it and you know who’s on the other side. A central bank with a bottomless balance sheet and no particular reason to blink.
Three signals, roughly in the order they’d fire:
Price first. A decisive daily close under 158 is the cleanest tell fast, unambiguous, hard to talk yourself out of. After that, TIC data. Slower and heavier. Two or three straight months of falling Japanese holdings would mean that the money is actually leaving, not just wobbling. And underneath both of those, CFTC positioning is already showing leveraged funds rebuilding short-yen exposure. That’s the same crowded setup that turned vicious in 2024. It didn’t end well then either.
Break 158 with conviction and 155 comes into view. If the slow money genuinely unwinds, the 142 lows from 2024 will be worth looking at. That is what the sequence points to if each signal fires in order and nobody steps in.
But Tokyo will probably step in. The strait closed again as of June 21 the transit data confirmed it and Japan’s energy bill is right back under the same strain this call assumed would ease. Let that drag on and the energy channel alone can push USD/JPY toward 162, then 165. The rate gap and repatriation legs are still pointing the other way. Doesn’t matter. Energy is loud enough to drown them out for a while.
The second risk is a BoJ that blinks. An openly dovish pause hands the shorts a gift room to rebuild, carry trade buys more time, the whole thesis gets slower. Neither of these flips the other two legs. They just make the timeline messier.
And if Hormuz actually reopens and holds whenever that lands the energy leg swings back to the bears. That’s when the thesis tightens back up. Right now it hasn’t.
Conclusion
Here is where I land: USD/JPY tops somewhere in 161 to 162 and grinds lower across the next two to four quarters toward 158, then 155. The rate gap keeps shrinking. Once Hormuz reopens, cheaper energy starts repairing the current account. The carry trade limps along in the meantime, which is what carry trades do when the math is slowly turning against them.
June’s hike was too well advertised to set off a 2024 style panic. And the climb to a fresh 2024 high reads more like a tired trend running on fumes than an actual breakout. On a six to twelve month horizon, the balance tips toward a firmer yen.
I will believe the structural turn has arrived when Japanese Treasury holdings fall for several months running. One sharp March drop that already half reversed does not count. The trap is reading a quiet tape as a stable one.
The fast money is back to scooping up nickels. The slow money has every reason to move and, on the last hard print, still has not. The day those two clocks line up, the move is rarely gentle. It is also rarely announced.
For the rates picture, 30-year JGB and the US 10-year are the ones to watch. Mark the calendar around each BoJ meeting and each TIC release. The rest is waiting.