


Washington joined Tokyo in buying yen on July 31, the pair fell 4.4% in a week, and the reading settling in now is that the authorities spent their credibility for a few yen. Below, I’ll lay out why the 2024 tape says otherwise, and why what kills a carry book isn’t the size of the rate gap. It’s what a week like that does to the volatility the gap is measured against.
Washington Bought Yen, Tokyo Did Not Raise Rates
July 30, a Thursday. Japanese authorities went into the market during US hours. Tokyo has never confirmed that one, and the Ministry of Finance won’t size it until the end of August.
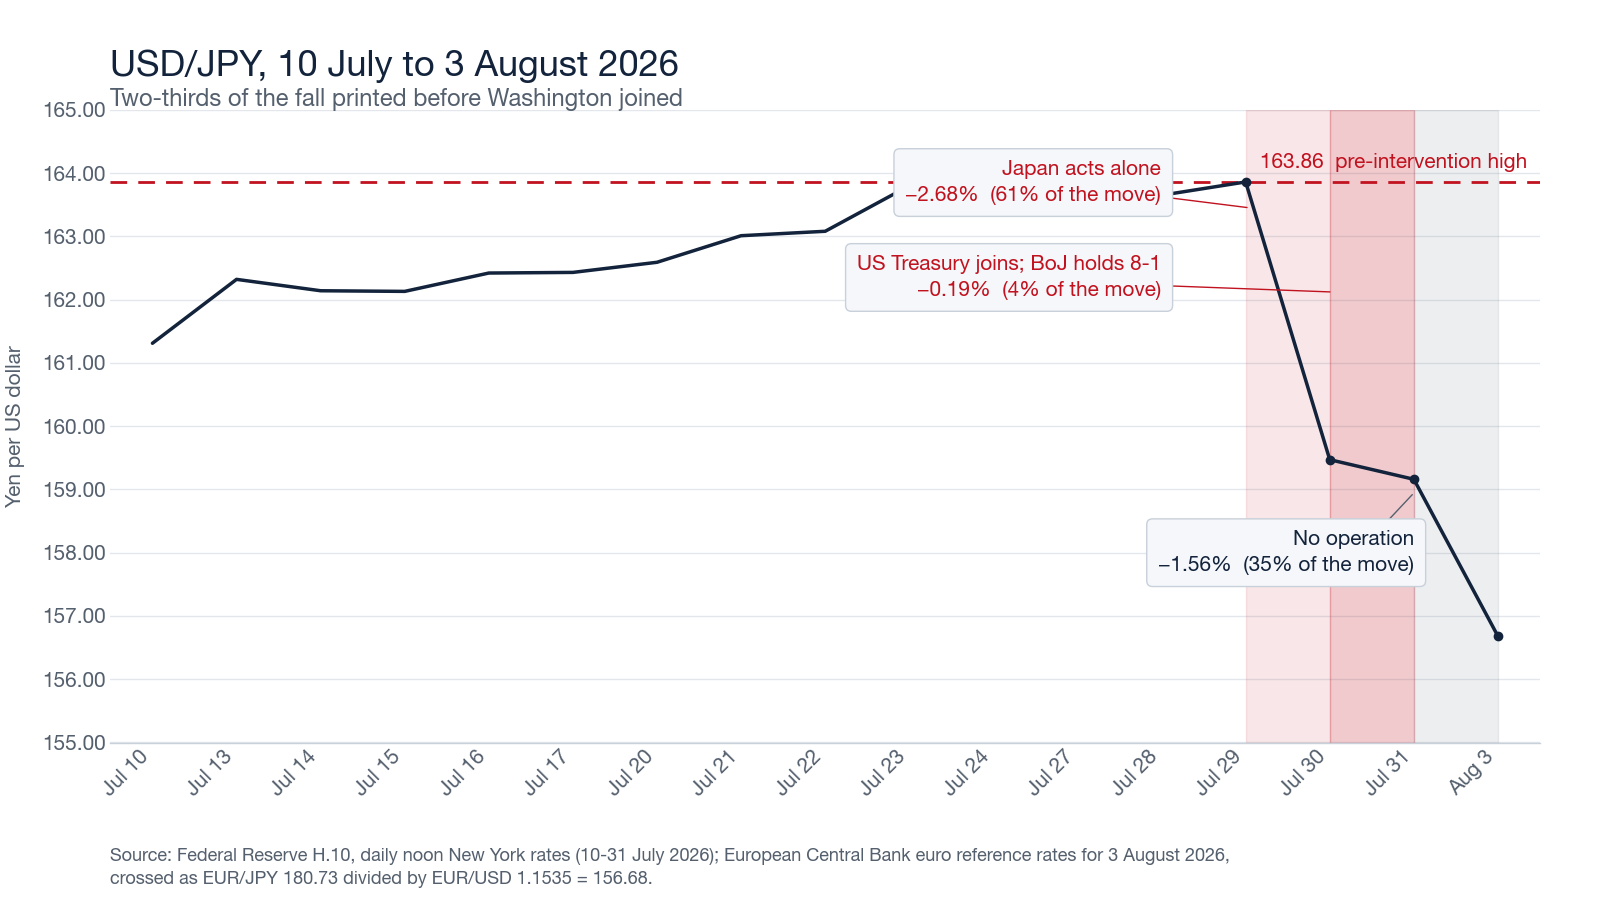
On the Federal Reserve‘s H.10 historical series the yen sits at 163.86 per dollar on July 29 and 159.47 on July 30. A fall of 4.39 yen against its noon New York fixing, in a session. Worth pausing on that 163.86, because it is the weakest the yen has printed on the Fed’s own series since the year 2000.
On Friday July 31 the New York Fed bought yen for the Treasury, and this one Tokyo did confirm, on August 3. H.10’s noon rate that day: 159.16.
Those two days have been fused into one story. The tape keeps them apart. July 30 carried 2.68% of the fall, before Washington arrived. July 31, the session Washington was in, carried 0.19%. Sixty-one percent of the move belonged to Japan acting alone. I would want that split before trading any of it.
Then came the part with nobody in it. By August 3 the ECB’s reference rates put the yen at 180.73 to the euro and the euro at $1.1535, which crosses to 156.68. Another 2.48 yen, a third of the whole move, with no operation behind it at all. No ministry was in the market for that leg. The threat was doing the work. That is new. (On venue, since I’m splicing two: July 29-31 are Fed noon New York fixings, August 3 an ECB cross struck at 14:15 CET. Read the third leg as indicative rather than exact. The pair drifted back toward 157.6 on August 4.)
That same Friday, the Bank of Japan met. It held the uncollateralized overnight call rate at around 1.0 percent, 8-1. Takata Hajime dissented, wanting 1.25 percent because the situation had “shifted to a new phase.” He lost. Narrowly, and it matters.
Two days earlier the FOMC held at 3-1/2 to 3-3/4 percent, 9-3, with Hammack, Kashkari and Logan all preferring a quarter-point rise. Two committees met inside 48 hours. Both had a hawkish minority. Neither moved. I keep returning to that.
USD/JPY Price Forecast
Every new USD/JPY analysis as it publishes, today's technical signal and key levels, live price — on one page.
See all USD/JPY forecastsWhy the Rate Gap Is the Wrong Number
I started this piece intending to argue the differential, and the arithmetic wouldn’t let me.
Take the strongest version of the consensus argument, the one where the Fed hikes 25bp in September and the Bank of Japan hikes 25bp two days later, and watch what happens to the number everybody quotes: the gap goes from 3.625% minus 1.00% to 3.875% minus 1.25%, which is 262.5 basis points either way. Unchanged. Not narrower. Not wider. Anyone arguing the yen off the level of the differential, me included until I did that subtraction, has no argument at all.
So the level isn’t the mechanism. What the position earns against what it risks, that is the mechanism.
I went looking for what the position actually earns, expecting the carry to be the big number in the trade. It is the small one. At 262.5bp a short-yen position collects 0.219% a month. The July 30 session moved 2.68%, which annualises to 42.5%. The week to August 3 moved 4.38%, twenty months of that income, in three transitions. Five cells of the Fed’s own table give all of it. I did not need a model.
I think that is what ended the trade in 2024, and in 1998 before it. A shock lands against a risk budget and the book comes down, whether or not the gap has moved a basis point. A desk on a volatility target does not get a view about it. It cuts.
A 25bp BoJ hike takes the monthly 0.219% down to 0.198%. Nine and a half percent of the income. That is not what does the damage on September 18. A second July 30 is.
Financial Analysis
The 2024 Sequence, and the Leg That’s Missing
July 11-12, 2024. Japan spent ¥5.53 trillion buying yen, about $36.8 billion at the rate on the day the total was published, and the pair went from 161.76 to 157.30. Nineteen days later came the hike everyone remembers. Nineteen. For those nineteen days the screen showed a large official flow, a lower pair, an unchanged differential, and a market saying the money had been wasted.
Then the BoJ raised the policy rate to around 0.25 percent on July 31 and set out a taper that halved its bond buying. Weak US payrolls landed August 2. Then it broke. By August 5 the Nikkei had fallen about 19.5% in three sessions.
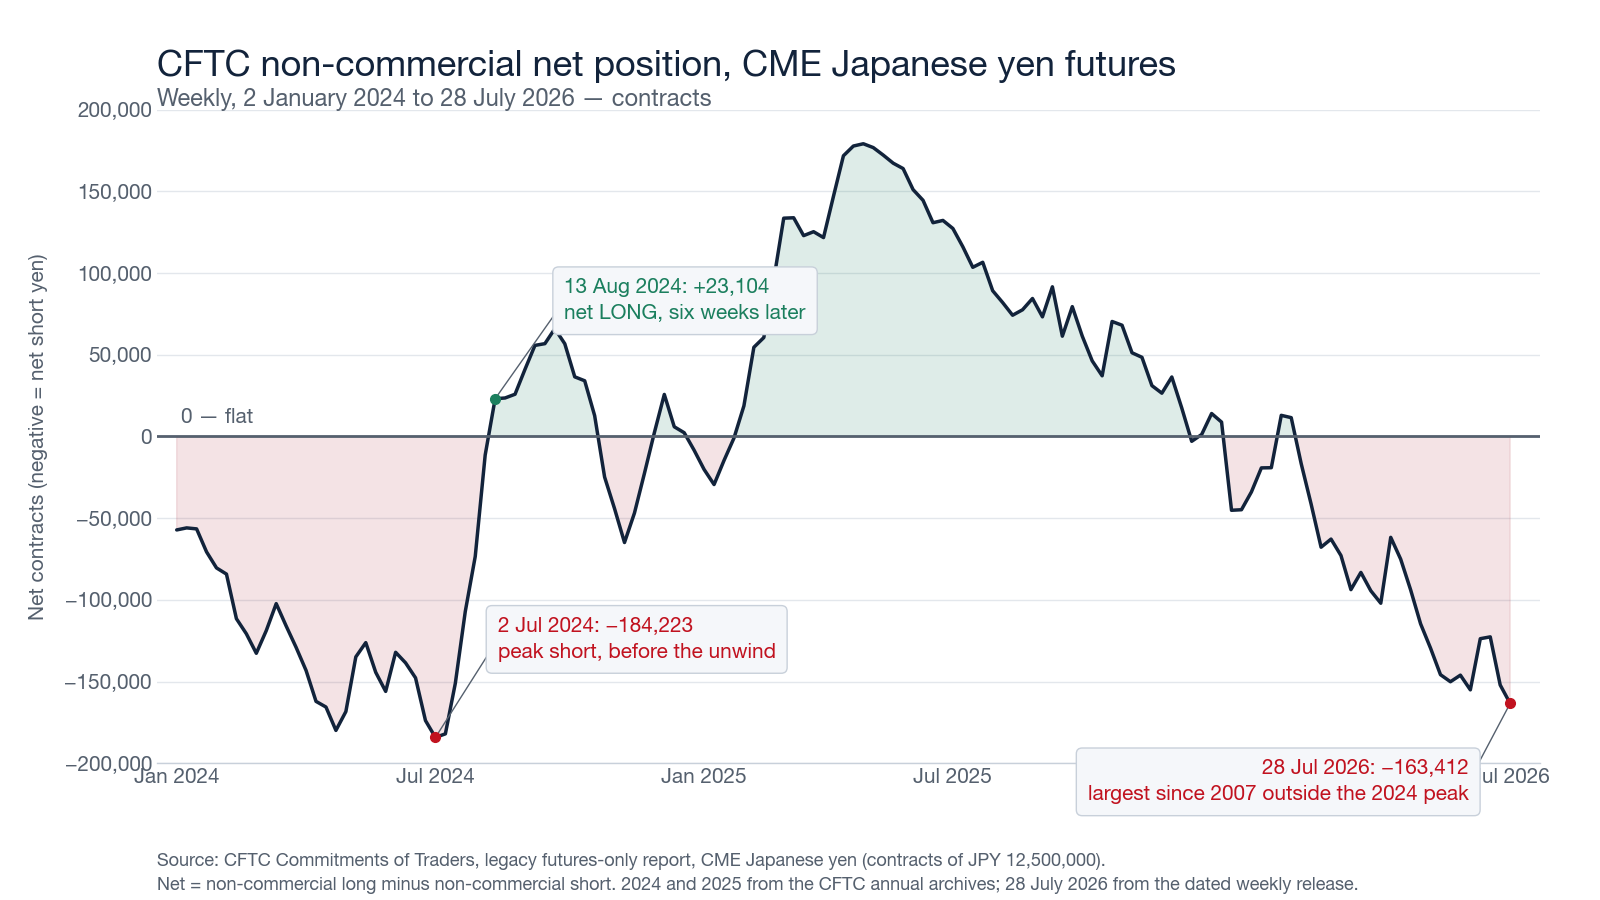
I went to the CFTC’s own 2024 archive for the damage. Non-commercial yen net short: 184,223 on July 2, 107,108 by July 23, 73,460 by July 30, 11,354 by August 6, and a net long of 23,104 by August 13. The pair went 161 to about ¥141.7 while that ran. Six weeks. Start to finish.
Two of the four legs are missing this time, and I’d rather name them than let a reader find them. The 2024 sequence was intervention, hike, US growth shock, unwind. In 2026 the US leg points the other way: three FOMC members dissented for a hike, not a cut. That’s exactly why my target is half the 2024 move and not all of it.
One Meeting Has Room to Surprise
Diary first. The FOMC meets September 15-16, the Bank of Japan September 17-18. Washington moves first. Tokyo answers two days later, into whatever the Fed has already done. Order matters.
A September Fed hike prices near 56% on fed funds futures, having run between roughly 56% and 61% across the last week of July. A September BoJ move prices near 40% on three-month TONA futures. Multiply them in the open. The double hike is a 22% to 24% event. A Fed hike into a BoJ hold runs 34% to 37%, and that is the likeliest single branch. So I’m underwriting the minority one on purpose. Sixty percent of the distribution still sits on Tokyo doing nothing, and that’s where the convexity is.
And the vote matters more than the rate. Takata lost 8-1, so four colleagues moving takes 1.25% from footnote to policy, and a shift to merely 7-2 with no hike keeps every carry position on while repricing the tail.
One thing the market has quietly forgotten. This committee already hiked, to 1.0% on June 16, its highest rate since 1995. The question in front of it on September 18 is not whether to begin, but whether to continue.
The Short Grew Into the Intervention
On the CFTC’s Commitments of Traders report, non-commercial traders were long 101,271 yen contracts and short 264,683 on July 28. Net short 163,412. Longs fell 6,319 on the week and shorts rose 4,968, taking the position 11,287 contracts deeper. So the market was adding to the trade as the authorities walked into it. That’s the detail I’d want.
That snapshot is Tuesday July 28, published the Friday: three days stale on arrival, good for extremes rather than for the current session. Outside the 2024 peak, it’s the largest I can find since 2007. Nineteen years.
At 12.5 million yen a contract, 163,412 of them is ¥2.04 trillion, about $13 billion. Here is what makes that figure worth more than its size. When the Bank for International Settlements went back over the 2024 unwind, it put the peak speculative yen short at “around ¥2 trillion, or about $14 billion.” The position sitting there on July 28 is ¥2.043 trillion. The BIS’s own marker for what a blown-up carry book looked like, matched almost to the yen. Before anything has blown up.
The same work sizes the wider book at roughly ¥40 trillion, about $250 billion, of yen lending to non-banks outside Japan as of March 2024, and, on the latest semiannual data for end-2025, $17.6 trillion of notional in FX swaps, forwards and currency swaps with the yen on one side. My $13 billion is 5% of the first and a rounding error against the second. They aren’t the trade. They’re the tell.
The Cash-Raising Leg, and It Has Form
COMEX copper printed its record near $6.71 on May 13. On August 3 the front month ran $6.45 to $6.58 and settled near $6.55, and it has traded near $6.60 since. Firmer. On the CFTC’s COMEX report for the same July 28 Tuesday has non-commercial traders long 103,023 and short 35,742. Net long 67,281, cut 6,696 on the week. At 25,000 pounds a contract, about $11.0 billion.
I expected copper to have held up through the 2024 squeeze, on the argument that its drivers are physical and the yen’s are not. It had not. Copper’s speculative net long ran 58,900 on July 16, 2024, then 42,220, then 24,475, then 19,598, and 15,797 by August 13. Down 73% across the four weeks the yen short was being destroyed. Same weeks. Same book. I checked both. A levered position bleeding in yen raises cash wherever it can, and copper was liquid and crowded. It still is.
That July 28 reading of 67,281 sits 14% above the 58,900 copper was carrying when the 2024 unwind began. Nothing in the physical picture has weakened. LME inventories went 324,850 tonnes on July 1 to 244,025 on August 3, down a quarter in five weeks. Chinese import premiums touched a fourteen-month high near $100 a tonne in mid-July and have eased back toward $70 since. The US import premium over LME is still an open policy question. My concern is the sequencing, not the substance.
The DAX: Least Exposed, and Here’s Why
Frankfurt’s DAX 40 closed at a record 26,001 on August 3, up 1.45%, led by Siemens Healthineers, Deutsche Telekom and SAP. Oil fell hard that session and the earnings ran with it. Frankfurt has printed higher since. Records cluster.
I wanted this index as the clean read on whether the yen move was reaching global risk appetite, and the session refused to give me one. Oil collapsed the same day, and a 1.36% euro move across three sessions is below the threshold where the effect would show. So 2024 is the evidence I have. Over the three sessions to August 5 that year the Nikkei fell 19.55%, from 39,101.82 to 31,458.42. The DAX went 18,508.65 to 17,339.00 over the identical days, 6.32%. A third as far. That was the worst week the carry trade has had this decade.
Position and Risk
USD/JPY. In my view the pair trades lower into the autumn. My base case is 148-150 by mid-October, and the derivation is the analogue rather than a chart: 2024 ran from its post-intervention 157.30 to 141.675, a fall of 9.93%, which from 156.68 gives 141.12. I’m calling half of that, 148.9, because 2026 is missing the US growth shock that supplied the second half in 2024. I’d call fair value 157.00-159.50, on a retracement toward the pre-intervention range, and I’d wait for it.
The arithmetic is why I’d wait: at spot the 7.18 yen of risk to 163.86 buys 7.78 of reward to 148.90, call it 1.08 to 1. At 158.25 it’s 1.67 to 1, and at 159.50 it’s 2.43 to 1. The entry zone is what makes this a trade rather than a coin flip.
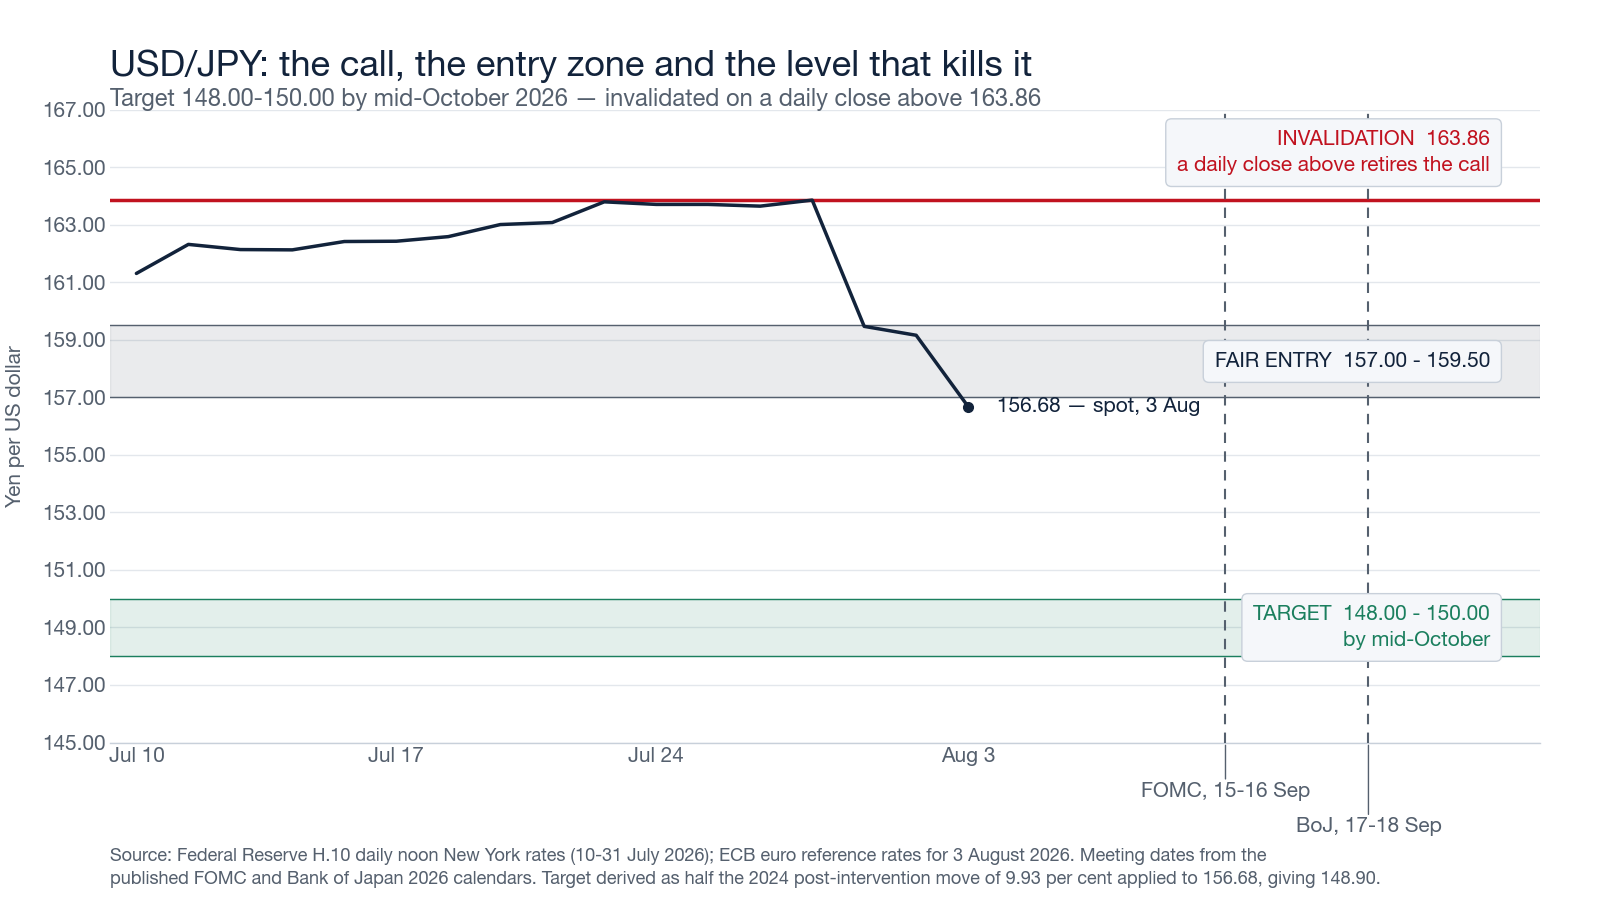
Invalidation. A daily close above 163.86 retires my call. That is the July 29 print. Above it, the market has seen two finance ministries and a joint operation and gone back to the trade anyway. A September 18 hold with the vote still 8-1 retires it too. The call is on the committee, not the rate.
Copper. In 2024 that long went 58,900 to 15,797 in four weeks while the physical case stayed intact the whole way. My read is that the same gap opens here, near term, between what copper is worth and what a levered holder can keep. A break of $6.20 is where the unwind confirms; a repeat of that 73% takes 67,281 toward 18,000. The Q4 2026 case at $6.65-6.80 rests on the tariff premium, which a currency move does not reach, and I still hold it.
DAX. The 2024 window is my whole basis here: 6.32% against the Nikkei’s 19.55%, over the same three sessions. Germany’s fiscal impulse is domestic and its exposure to a yen unwind runs only through the global-equity channel. So I have Frankfurt outperforming through this. A close below 25,000, 3.9% under the August 3 record, is where I would call the contagion broader than I think.
What beats me is also the likeliest branch. The Fed hikes on September 16, Tokyo holds again on the 18th, the gap widens to 287.5bp and the short rebuilds into it. That is where the consensus already sits, which is the reason this call is worth making rather than assuming.
Conclusion
June 16, the Bank of Japan took its policy rate to 1.0%, the highest since 1995. July 31, with Washington in the market on its behalf, the same committee held, 8-1, and Takata Hajime went on the record for 1.25%. September 18 is the next time those nine people vote. Two days after the Fed.
Between now and then, three numbers land and none of them needs an opinion. Japan’s end-July reserves publish around August 7. The Ministry of Finance’s intervention total for July 30 to August 27 publishes late in the month. And every Friday the CFTC prints whether 163,412 has started to cover.
I keep landing on the same distinction. A finance ministry can buy yen; it cannot make the trade expensive to hold. The committee meeting on September 18 can, and the position waiting on it is the largest since 2007. For copper, my earlier work on the US tariff premium sets out the structural case a currency move doesn’t touch.