
Advertisement
Advertisement
EUR/USD Mid-Session Technical Analysis for December 1, 2015
By:
Daily EUR/USD Technical Analysis The EUR/USD is trading higher at the mid-session. The higher-high price action has helped make 1.0557 a new minor bottom.
Daily EUR/USD Technical Analysis
The EUR/USD is trading higher at the mid-session. The higher-high price action has helped make 1.0557 a new minor bottom.
The main trend is down according to the daily swing chart. The main range is 1.0689 to 1.0557. Its retracement zone is 1.0623 to 1.0639. This zone is the primary upside target of the current short-term rally. Since the main trend is down, sellers are likely to come in on a test of this zone. Buyers will like to take it out to extend the move. This would make 1.0557 a new main bottom.
Based on the current price at 1.0591, the key angle to watch the rest of the session drops in at 1.0602. Trader reaction to this angle will determine the direction of the EUR/USD the rest of the day.
A sustained move over 1.0602 will indicate the presence of buyers. The first upside target is the intraday high at 1.0618. This is followed by the 50% level at 1.0623. This price is also a trigger point for an acceleration into a Fibonacci level at 1.0639.
A sustained move under 1.0602 will signal the presence of sellers. The first downside target is a downtrending angle at 1.0569. Crossing to the weak side of this angle will put the market in a bearish position with additional targets coming in at 1.0562 and 1.0557.
Taking out 1.0557 with conviction should eventually lead the EUR/USD into the April 13 main bottom at 1.0520.
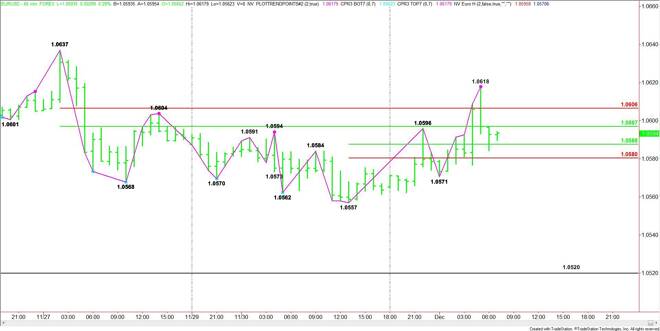
2-Hour EUR/USD Technical Analysis
The main trend is up according to the 2-Hour EUR/USD swing chart.
The main range is 1.0637 to 1.0557. Its retracement zone is 1.0597 to 1.0606. The EUR/USD straddled this zone earlier in the session on its way to 1.0618. This zone is now resistance.
The short-term range is 1.0557 to 1.0618. Its retracement zone at 1.0588 to 1.0580 is new support.
The current price is 1.0591.
A sustained move over the 50% level at 1.0597 will indicate the presence of buyers. This could lead to a test of a Fibonacci level at 1.0606 and the main top at 1.0618.
A sustained move under the 50% level at 1.0588 will signal the presence of sellers. The first target under this level is the Fibonacci level at 1.0580. This is followed by the main bottom at 1.0571.
A trade through 1.0571 will turn the main trend to down according to the 2-hour swing chart.
About the Author
James Hyerczykauthor
James Hyerczyk is a U.S. based seasoned technical analyst and educator with over 40 years of experience in market analysis and trading, specializing in chart patterns and price movement. He is the author of two books on technical analysis and has a background in both futures and stock markets.


Advertisement