
Advertisement
Advertisement
EUR/USD Mid-Session Technical Analysis for November 30, 2015
By:
Daily EUR/USD Technical Analysis The EUR/USD is trading lower at the mid-session. Earlier in the session, the Forex pair took out the previous short-term
Daily EUR/USD Technical Analysis
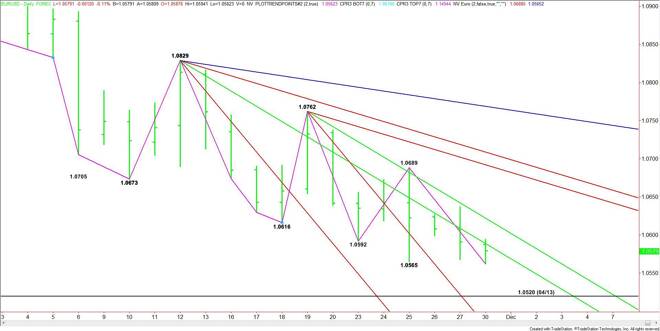
The EUR/USD is trading lower at the mid-session. Earlier in the session, the Forex pair took out the previous short-term low at 1.0565, reaching a low of 1.0562 before short-covering drove it back to 1.0583
Based on the current price at 1.0581, the direction of the market the rest of the session will be determined by trader reaction to the downtrending angle at 1.0589.
A sustained move over 1.0589 could create enough upside momentum to challenge the next downtrending resistance angle at 1.0622.
The inability to overcome 1.0589 and sustain the move will indicate the presence of sellers. This could lead to a retest of the intraday low at 1.0562.
If the selling pressure increases on a trade through 1.0562 then the primary downside target becomes the April 13 main bottom at 1.0520.
Watch the price action and read the order flow at 1.0589 today. Trader reaction to this downtrending angle will tell us whether the bulls or the bears are in control.
2-Hour EUR/USD Technical Analysis
The main trend is down according to the 2-Hour EUR/USD swing chart. However, the closing price reversal bottom at 1.0562 indicates that momentum may be shifting to the upside.
The short-term range is 1.0594 to 1.0562. Its retracement zone at 1.0578 to 1.0582 is currently providing resistance.
Momentum could shift to the upside if 1.0584 is taken out with conviction. This move will not only take out the short-term Fib level at 1.0582, but it will also confirm the closing price reversal bottom.
A sustained move over 1.0584 will indicate the presence of buying with the next objective the main top at 1.0594. This is followed by a 50% level at 1.0599, another main top at 1.0604 and a Fibonacci level at 1.0608.
The main trend is down, but a trade through 1.0594 will turn the main trend to up.
A sustained move under 1.0578 will signal the presence of sellers. The 2-hour chart is open to the downside with the next target the closing price reversal bottom at 1.0562.
Taking out 1.0562 with conviction will signal a resumption of the downtrend and could create enough downside momentum to challenge the main bottom at 1.0520.
About the Author
James Hyerczykauthor
James Hyerczyk is a U.S. based seasoned technical analyst and educator with over 40 years of experience in market analysis and trading, specializing in chart patterns and price movement. He is the author of two books on technical analysis and has a background in both futures and stock markets.


Advertisement