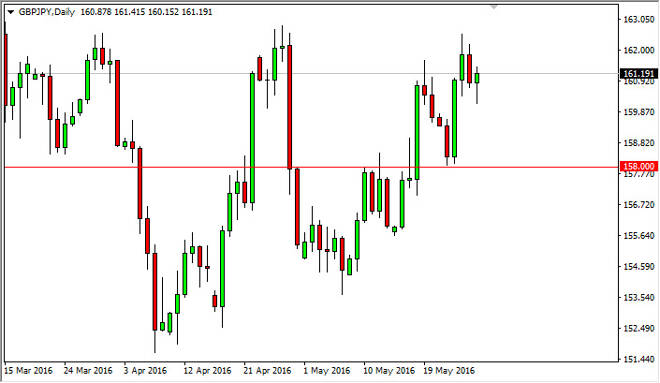
The GBP/JPY pair initially fell during the course of the session on Friday, but turned around to form a bit of a hammer. The hammer of course is a bullish
The GBP/JPY pair initially fell during the course of the session on Friday, but turned around to form a bit of a hammer. The hammer of course is a bullish sign, so we can break out to a fresh, new low, the market could continue to grind its way towards the 163 level, and then perhaps even the 165 level. A break down below the bottom of the hammer would of course be a negative sign, reaching down towards the 158 level given enough time. At this point, the market looks as if the buyers are starting to try to take control.
Chris is a proprietary trader with more than 20 years of experience across various markets, including currencies, indices and commodities. As a senior analyst at FXEmpire since the website’s early days, he offers readers advanced market perspectives to navigate today’s financial landscape with confidence.