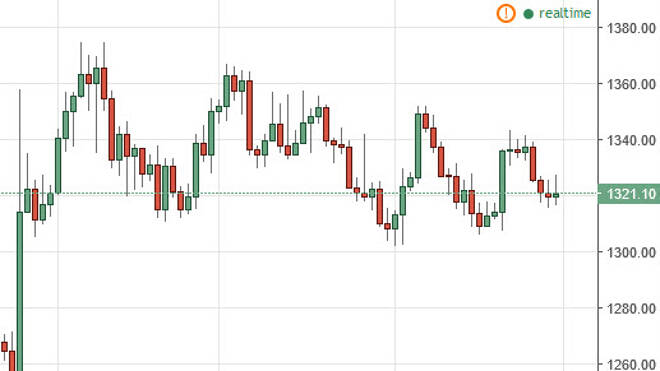
Gold markets initially tried to rally during the day on Friday, but gave back the gains yet again in order to basically sit at the $1320 level. The $1300
Gold markets initially tried to rally during the day on Friday, but gave back the gains yet again in order to basically sit at the $1320 level. The $1300 level below is massively supportive, and as a result I would be willing to buy a supportive candle near that area. With this being the case, and impulsive candle or the supportive candle is reason enough for me to go long. A break above the range for the session on Friday would be reason enough to go to the $1340 level. With this, I am “buy only” going forward.
Chris is a proprietary trader with more than 20 years of experience across various markets, including currencies, indices and commodities. As a senior analyst at FXEmpire since the website’s early days, he offers readers advanced market perspectives to navigate today’s financial landscape with confidence.