The NASDAQ 100 initially fell during the course of the session on Monday, but turned right back around to show signs of support yet again. It appears that
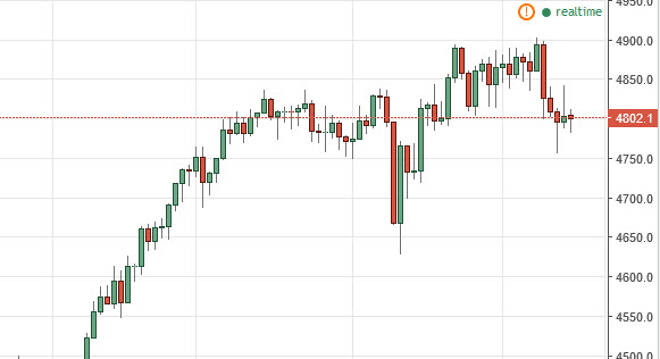
The NASDAQ 100 initially fell during the course of the session on Monday, but turned right back around to show signs of support yet again. It appears that there is a 4800 level that the market is paying attention to, and if we can break above this area here, I don’t see any reason why we won’t reach to the 4900 level after a while. If we can break above there, the market should then reach towards the 5000 level below which is my longer-term target. Pullbacks at this point in time should continue to find buyers.
Chris is a proprietary trader with more than 20 years of experience across various markets, including currencies, indices and commodities. As a senior analyst at FXEmpire since the website’s early days, he offers readers advanced market perspectives to navigate today’s financial landscape with confidence.