The NASDAQ 100 initially fell during the course of the session on Wednesday, but turn right back around to form a hammer. If we can break above the top
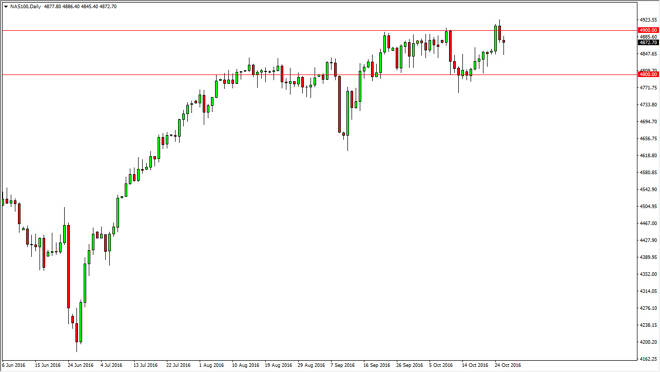
The NASDAQ 100 initially fell during the course of the session on Wednesday, but turn right back around to form a hammer. If we can break above the top the hammer, we then look to higher levels, especially once we break above the 4900 level. Once we get above there, the market should then reach for the 5000 level, which is the longer-term target that I’ve had for some time. I have no interest whatsoever in selling this market, and at the 4800 level I suspect that there is going to be a bit of a “floor.”
Chris is a proprietary trader with more than 20 years of experience across various markets, including currencies, indices and commodities. As a senior analyst at FXEmpire since the website’s early days, he offers readers advanced market perspectives to navigate today’s financial landscape with confidence.