The S&P 500 rally during the day on Monday, breaking above the 2160 handle, and testing the 2170 handle. The 2180 level above there is massively
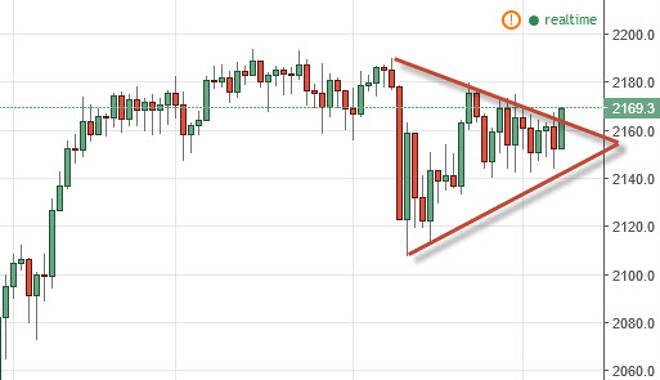
The S&P 500 rally during the day on Monday, breaking above the 2160 handle, and testing the 2170 handle. The 2180 level above there is massively resistive, and if we can break above there it’s likely that we can continue the longer-term uptrend. Ultimately, this is a symmetrical triangle that has just given way, so I believe at this point in time that the buyers are very much in control and are going to continue to be at least in the short-term. I have no interest in selling and believe that the 2120 level below is the “floor.”
Chris is a proprietary trader with more than 20 years of experience across various markets, including currencies, indices and commodities. As a senior analyst at FXEmpire since the website’s early days, he offers readers advanced market perspectives to navigate today’s financial landscape with confidence.