The S&P 500 initially rallied on Tuesday but turned right back around to form a relatively negative candle. At this point though, I think there is
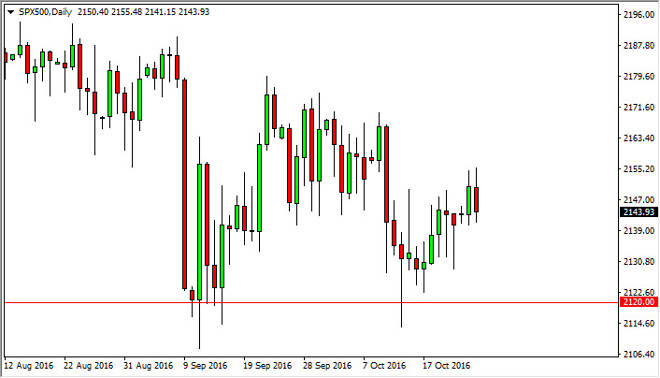
The S&P 500 initially rallied on Tuesday but turned right back around to form a relatively negative candle. At this point though, I think there is more than enough support below that extends all the way down to the 2120 level, and as a result I am waiting to see a supportive candle or break above the top of the candle for Tuesday in order to go long. I have no interest whatsoever in selling this market, there is far too much in the way of support to consider doing so at this point.
Chris is a proprietary trader with more than 20 years of experience across various markets, including currencies, indices and commodities. As a senior analyst at FXEmpire since the website’s early days, he offers readers advanced market perspectives to navigate today’s financial landscape with confidence.