
Advertisement
Advertisement
Technical Overview: EUR/USD, USD/CAD, AUD/USD And NZD/USD
By:
EUR/USD Ever since the EURUSD dipped below 1.1125-20 horizontal-support, the pair’s downtrend can be aptly portrayed by short-term descending
EUR/USD
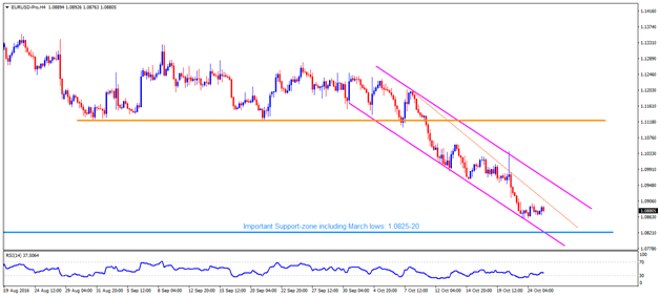
Ever since the EURUSD dipped below 1.1125-20 horizontal-support, the pair’s downtrend can be aptly portrayed by short-term descending trend-channel, signaling its additional weakness to 1.0850 before testing the channel support and March month lows, around 1.0825-20. However, oversold RSI might trigger its bounce then, failing to which can quickly drag the quote to 1.0770 prior to printing 1.0710 and the 1.0630 on the chart. On the upside, an immediate downward slanting TL mark of 1.0910 can limit the pair’s near-term advances, breaking which it could rise to channel resistance of 1.0965, which if broken might trigger its upward trajectory to 1.1025 and then to 1.1060 before challenging the 1.1125-20 area. Moreover, pair’s sustained break above 1.1125, enables it to test 1.1200 round figure resistance-mark.
USD/CAD
Unlike EURUSD, the USDCAD has different story. The pair presently confronts two-month old ascending trend-channel and is indicating brighter chances of a pullback towards 1.3220 immediate support. If the pair’s pullback stretch a bit longer below 1.3220, the 1.3135-40 might act as intermediate halt before it could drop to 1.3020-25 important support, comprising channel lower-line and 100-day. However, its break of 1.3020 might find it hard to clear five-month old ascending TL support of 1.2940, which if cleared signals its extended south-run to 1.2770-60. Meanwhile, pair’s capacity to provide a daily closing above 1.3380 channel resistance needs to give a confirmation by breaking 1.3410 in order to indicate its strength while challenging 1.3500 mark. Should the pair successfully trades beyond 1.3500, the 1.3650 and 1.3720 are likely north-side figures to appear on the chart.
AUD/USD
Even if the AUDUSD reversed from September high during last week, a short-term ascending triangle formation keep favoring its upside. At the moment, the pair struggles with 50-day SMA and 23.6% Fibonacci Retracement of its January – April upside, around 0.7600 – 0.7595, breaking which 0.7595 may offer an intermediate halt prior to its dip to formation support of 0.7525. In case of the pair’s break of 0.7525, it can quickly decline to 38.2% Fibo level of 0.7450 before signaling 0.7400 round figure support. However, the bullish formation and strength of the AUD indicates the pair’s up-move to 0.7690 on the break of 0.7650 nearby resistance while 0.7735 then becomes crucial level to watch. If the pair surpasses 0.7735 on a closing basis, 61.8% FE of its May – August upside, around 0.7820, again comes into play.
NZD/USD
With its failure to surpass short-term descending trend-line, the NZDUSD indicates further downside to 0.7085 with 0.7120 horizontal support acting as immediate halt. Should the pair declines below 0.7085, the present month’s low of 0.7034 and the 61.8% FE of its recent downturn, at 0.6985, are likely numbers to appear during the quote’s south-run. Alternatively, 0.7175 and the 38.2% Fibonacci Retracement level, around 0.7200, are expected nearby resistances for the pair traders to watch, breaking which 0.7225 is a buffer prior to its run-up to mentioned descending TL of 0.7245. Given the pair manage to surpass 0.7245, chances of its northwards trajectory towards 0.7300 and then to 0.7325-30 can’t be denied.
Cheers and Safe Trading,
Anil Panchal
About the Author
Anil Panchalauthor
An MBA (Finance) degree holder with more than five years of experience in tracking the global Forex market. His expertise lies in fundamental analysis but he does not give up on technical aspects in order to identify profitable trade opportunities.


Advertisement