
Advertisement
Advertisement
Technical Overview: EUR/USD, USD/JPY, AUD/USD And NZD/USD
By:
EUR/USD Even if the US Dollar strength dragged EURUSD to nearly three-month lows, the pair bounced-off from 1.0960-50 horizontal support and is presently
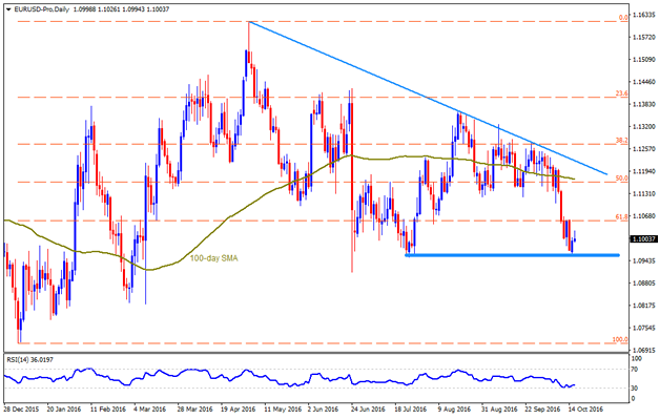
EUR/USD
Even if the US Dollar strength dragged EURUSD to nearly three-month lows, the pair bounced-off from 1.0960-50 horizontal support and is presently aiming towards 61.8% Fibonacci Retracement of its January – May upside, near 1.1055, ahead of the crucial US CPI data. Given the inflation gauge disappoint greenback traders, the pair might rally beyond 1.1055 towards 1.1120, the 50% Fibo level of 1.1165 and then to the 100-day SMA level of 1.1175. However, a strong CPI figure can again fetch the quote to 1.0960-50, which if broken opens the door for the pair’s southward trajectory towards 1.0900 and to the 1.0820 supports. Additionally, pair’s sustained trading below 1.0820 gives rise to hopes of 1.0770 and the 1.0710 downside figures to appear on the chart.
USD/JPY
USDJPY’s break of 100-day SMA failed to propel the pair beyond 104.30-40 horizontal resistance, which in-turn signals the pair’s pullback to 103.15 nearby support, comprising 100-day SMA. Though, pair’s further decline below 103.15 might find it difficult to clear 102.75-70 support-zone, which If sustained can quickly fetch the quote to 23.6% Fibonacci Retracement of its May – June plunge, around 101.80. On the upside, pair’s successful trading above 104.40 enables it to aim for 105.40 and 105.70 resistances ahead of looking at 106.55-60 region. In case of the pair’s closing break of 106.60, it becomes capable enough to flash 107.50 resistance mark.
AUD/USD
With the RBA Governor’s latest indication of fewer rate-cuts than market expects, the AUDUSD is confronting the month-old descending trend-line mark of 0.7690. However, overbought RSI and chances of the strong US details make it less risky for traders to expect a pullback till 0.7645 immediate support. Should the pair drops below 0.7645, it becomes wise to wait for the 0.7600 round figure and 50% Fibonacci Retracement of September month decline, at 0.7585, while having short positions. Meanwhile, pair’s capacity to surpass 0.7690 might have to justify the strength by breaking 0.7700 mark before rallying to previous month high of 0.7732. Given the pair successfully trades beyond 0.7732, the 0.7760 may act as a buffer during the pair’s north-run towards challenging 2016 highs of 0.7835.
NZD/USD
Alike AUDUSD, the NZDUSD is also near to the trend-line resistance, at 0.7220, which also comprises 23.6% Fibonacci Retracement of its January – September upside; Though, here the RSI and recent New-Zealand CPI print are more in the favor of pair’s north-run to 0.7275.80 prior to printing 0.7330 on the chart. Should the pair bulls propel the quote beyond 0.7330, the 0.7380 can offer a halt during its run to September high of 0.7482. Alternatively, 0.7120 and the 0.7095 could place the support should the pair reverses from present levels, breaking them can reignite the importance of 0.7050-45 support-zone, including 38.2% Fibo and nine-month old ascending TL. Just in case the pair prices dip below 0.7045, chances of its plunge to 200-day SMA level of 0.6950 can’t be denied.
Cheers and Safe Trading,
Anil Panchal
About the Author
Anil Panchalauthor
An MBA (Finance) degree holder with more than five years of experience in tracking the global Forex market. His expertise lies in fundamental analysis but he does not give up on technical aspects in order to identify profitable trade opportunities.


Advertisement