
Advertisement
Advertisement
Technical Overview – EUR/USD, USD/JPY, USD/CAD and AUD/USD
By:
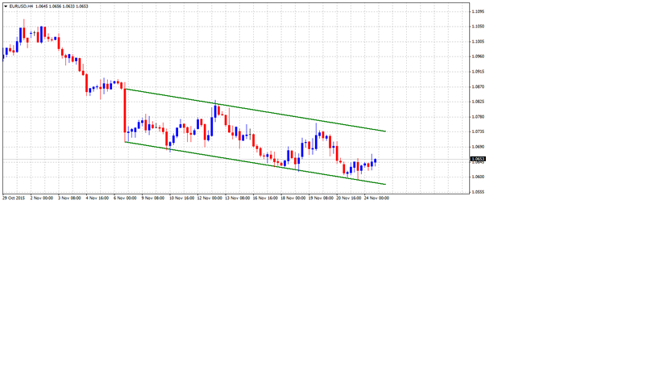
EUR/USD On 4-hourly chart, the pair has now moved within a short-term descending trend-channel and is currently rebounding from the lower trend-line
EUR/USD
On 4-hourly chart, the pair has now moved within a short-term descending trend-channel and is currently rebounding from the lower trend-line support of the channel. From current levels, the pair is likely to confront resistance near 1.0680-1.0700 area, which if conquered is immediately followed by a strong resistance near 1.0740-50 area, marking the upper trend-line resistance of the channel. A decisive break-through the descending trend-channel resistance now seems to pave way for extension of the pair’s near-term recovery move towards testing its next resistance near 1.0850 region. Meanwhile on the downside, 1.0600 round figure mark, closely followed by the lower trend-line support of the channel, currently near 1.0580 level, might continue providing immediate support. Failure to hold this important support has the potential to continue dragging the pair in the near-term towards retesting 1.0500 psychological mark support, tested earlier in Mar-Apr 2015.
USD/JPY
The pair once again failed to sustain its strength above 123.50-60 area, possibly forming a bearish Double-Top chart pattern. Moreover, the pair has also broken below a short-term ascending trend-channel and is now trading close to its immediate strong horizontal support near 122.50-30 area. Sustained weakness below this immediate strong support, thus confirming the bearish chart-pattern, is likely to drag the pair towards testing its previous strong resistance, now turned support, near 121.50 region with 122.00 round figure mark acting as intermediate support. Meanwhile, bounce from current support levels now seems to face immediate resistance 122.80 level, which if conquered opens room for further momentum beyond 123.20-30 intermediate resistance towards retesting the very important resistance near 123.50-60 zone. Only a decisive strength above this strong resistance might negate possibilities of any near-term corrective move for the pair.
USD/CAD
Although the pair continues to extend its near-term rebound from a short-term term ascending trend-line support, it now seems to be in the process of forming a bearish Rising Wedge chart-pattern on daily chart. The formation, however, is not complete unless the pair decisively breaks below the lower ascending trend-line support, currently near 1.3100 mark, also coinciding with 100-day SMA support. From current level, till the pair continues holding above 1.3300 mark immediate support, it is likely to make a fresh attempt towards reclaiming 1.3400-1.3420 strong resistance area. Sustained strength above this immediate resistance is likely to lift the pair towards another ascending trend-line resistance (forming part of the bearish Rising Wedge chart-pattern) currently near 1.3640-50 area. Alternatively, weakness below 1.3300 mark and a subsequent drop below 1.3250 level seems more likely to take the pair back towards retesting the very important support confluence near 1.3120-1.3100 area.
AUD/USD
The pair continues to hover around 0.7200 mark confluence region, comprising of 100-day SMA and 23.6% Fib. retracement level of May to Sept. down-leg. Should the pair manage to extend its near-term recovery beyond 0.7250 level, the momentum is likely to lift the pair towards testing 38.2% Fib. retracement level resistance, near 0.7385-0.7400 region. However, failure to extend its near-term recovery and a subsequent weakness back below 0.7160-50 immediate horizontal support, has the potential to drag the pair back below 0.7100 round figure mark support, towards testing a short-term ascending trend-line support, currently near 0.7050 level. Further, a break below the trend-line support might now expose a retest of recent lows support near 0.6930-10 region.
Follow me on twitter to discuss latest markets updates @Fx_Haresh
About the Author
Haresh Menghaniauthor


Advertisement