
Advertisement
Advertisement
Technical Update: USDCHF, GBPCHF, AUDCHF and NZDCHF
By:
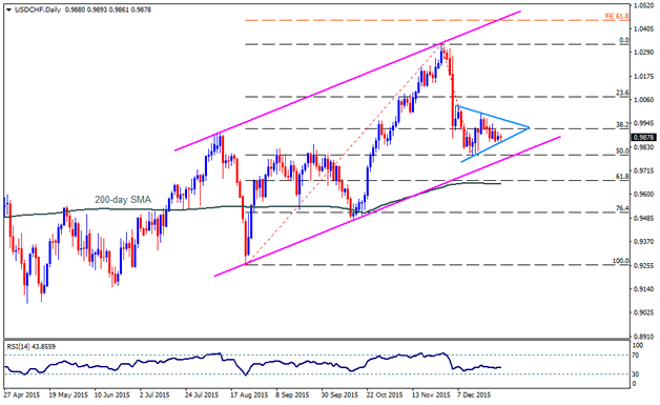
USDCHF Even if the symmetrical triangle confines immediate USDCHF moves, a closing break below 0.9860, comprising formation support-line, can quickly push
USDCHF
Even if the symmetrical triangle confines immediate USDCHF moves, a closing break below 0.9860, comprising formation support-line, can quickly push the pair towards 50% Fibonacci Retracement of its August – November rally, around 0.9800 – 0.9790 area; however, four-month old ascending trend-line, near 0.9750-45, could restrict its further downside. Given the bears’ dominance following 0.9745 break, the pair can stretch the south-run to 200-day SMA, presently near 0.9650, breaking which it can be deprived of near-term up-move and may plunge to sub-0.9500 mark. Alternatively, a bounce from the current levels is likely witnessing 38.2% Fibo, near 0.9920, as an immediate resistance prior to targeting the triangle resistance-line, around 0.9960. Moreover, sustained break above 0.9960, also clearing the 1.0000 psychological magnet, can fuel the pair’s rally to surpass 1.0200 round figure mark with 1.0090 and 1.0130-40 being intermediate resistances.
GBPCHF
AUDCHF’s pullback from 100-day SMA and four month old ascending trend-line support, also including 23.6% Fibonacci Retracement of its September 2014 – August 2015 downside, seems finding it difficult to break 0.7200 round figure mark during the year-end thin trading sessions; however, mentioned trend-line support, presently around 0.7110, may hold the pair’s near-term up-move. If the trend-line support fails to stop the pair’s downside, 100-day SMA and 23.6% Fibo, near 0.7050-45, may give another chance for the pair traders to expect a bounce, negating which the pair might progress in its southward trajectory to 0.6950-45 and to the January lows of 0.6850. On the upside, a daily close beyond 0.7200 may trigger the pair’s advance to 0.7250, the 0.7285-95 and the 38.2% Fibo, near 0.7375, prior to targeting the fifteen month old descending trend-line resistance, near 0.7485-90.
NZDCHF
Failure to break 0.6460-50 support-zone triggered the NZDCHF bounce, which presently fuels the pair towards eight months old descending trend-line resistance, around 0.6810-20, that could restrict its additional upside, failing to which can help the pair test 0.6930-35 resistance-zone. If the bulls accelerate pair’s north-run beyond 0.6935, the 0.7055-60 is likely an intermediate halt during its rise to 0.7140-50, including 61.8% Fibonacci Retracement of January – August downside. Though, inability to counter the mentioned trend-line resistance keep favoring the pair’s pullback to 0.6700 mark, followed by the 0.6610 – 0.6600 area, comprising 200-day SMA and the 38.2% Fibo. On a further decline below 0.6600, an ascending trend-line support, connecting August lows to recent lows, at 0.6550, may limit the pair’s downside, breaking which 0.6500 may offer a small stop for the pair’s southward trajectory to 0.6300 – 0.6290 area, including 23.6% Fibo level.
Follow me on twitter to discuss latest markets events @Fx_Anil
About the Author
Anil Panchalauthor
An MBA (Finance) degree holder with more than five years of experience in tracking the global Forex market. His expertise lies in fundamental analysis but he does not give up on technical aspects in order to identify profitable trade opportunities.


Advertisement