
Advertisement
Advertisement
US Equity Indices: Technical Outlook
By:
Dow Jones Industrial Average Repeated failures to clear 50-day SMA by the Dow Jones Industrial Average Index presently drags the important US equity gauge
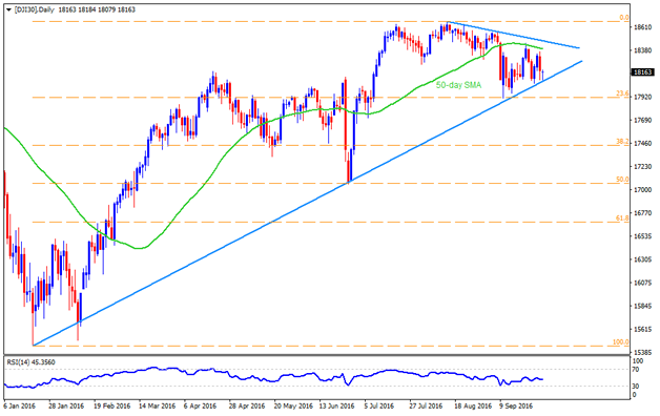
Dow Jones Industrial Average [DJI30]
Repeated failures to clear 50-day SMA by the Dow Jones Industrial Average Index presently drags the important US equity gauge towards testing eight-month old ascending trend-line support of 18060; however, strength of the TL and upbeat sentiment at US continue favoring the gauge’s upside bounce to 18250 immediate resistance. Should the index manage to extend its pullback beyond 18250, the 18345 and the 50-day SMA mark of 18395 might restrict its further north-run before fueling it to short-term descending trend-line level of 18485. In case of its successful break above 18485 on a closing basis, a fresh upward trajectory towards 18670 and 18800 can’t be denied. On the downside, a daily closing below 18060 can quickly drag the index to 18020 and to the 23.6% Fibonacci Retracement of its January – August upside, at 17910, breaking which 17760 and 17650 are likely following downside figures to appear on the chart. If the gauge keeps declining below 17650, 38.2% Fibo level of 17440 may give rise to its U-turn.
S&P 500 [SP500]
Alike DJI30, the S&P 500 also struggled to counter the 50-day SMA and failed recently, indicating its weakness to flash 2138 upward slanting trend-line support, closely followed by 100-day SMA level of 2133. Given the index break 2133 on a closing basis, 2120 and the 2109 are expected south-side numbers to appear ahead of fetching the quote to 50% Fibonacci Retracement of its June – August upside, at 2091. Alternatively, 2159 and 50-day SMA level of 2169, adjacent to near-term TL of 2177, can keep restricting the gauge’s immediate upside. If the index surpasses 2177, the August highs of 2193.5 might act as intermediate halt during its upward trajectory to 61.8% FE level of 2233.
Nasdaq [NQ100]
As compared to other equity indices, the Nasdaq continue trading in short-term symmetrical triangle wherein it recently bounced-off from support-line, indicating a test to 4849, 4868 and the upper-line of 4875. In case if the gauge surpasses 4875, the 4885 and the present month high of 4895 could entertain short-term bulls prior to printing 4930 on the chart. Meanwhile, a dip below formation support of 4816 can drag the index to 4804 and the 38.2% Fibonacci Retracement of its September advances, at 4793. Moreover, the gauge’s further downside below 4793 might find it hard to break 4770, it can plunge to 4740 and the 4723 support levels.
Cheers and Safe Trading,
Anil Panchal
About the Author
Anil Panchalauthor
An MBA (Finance) degree holder with more than five years of experience in tracking the global Forex market. His expertise lies in fundamental analysis but he does not give up on technical aspects in order to identify profitable trade opportunities.


Advertisement