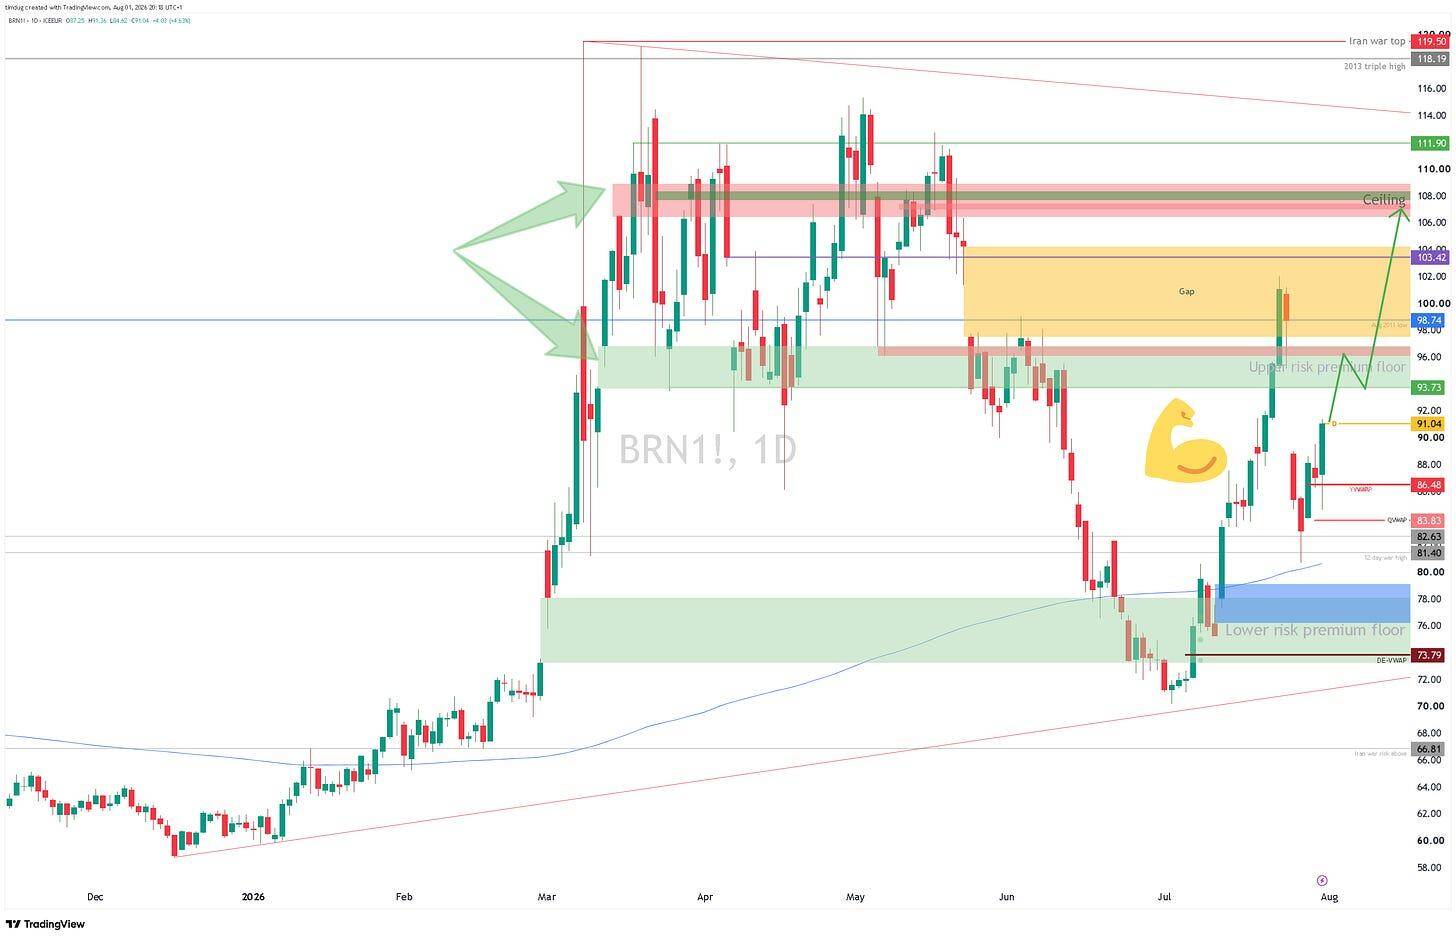
We can take it that the blunt force we have seen from The Houthis have served as a strong warning shot across the US bow. The threat is a most real and present danger to the energy markets. Despite this, oil price remains contained. So, with initial sparring subdued, talks between Tehran and Washington are continuing in earnest, brokered by Pakistan.
Further ‘kinetic events’ and thus short to medium term supply shocks can not be ruled out. With front month prices the nerve ending for this, loadings and transits to and from Yanbu are subject to Houthi attack at any time. The Saudi Petroline (East-West pipeline) can deliver 7mb/d to this port, but Yanbu can only load about 4.5mb/d, with loadings as of July 13th reaching an all-time high of 4.7mb/d.
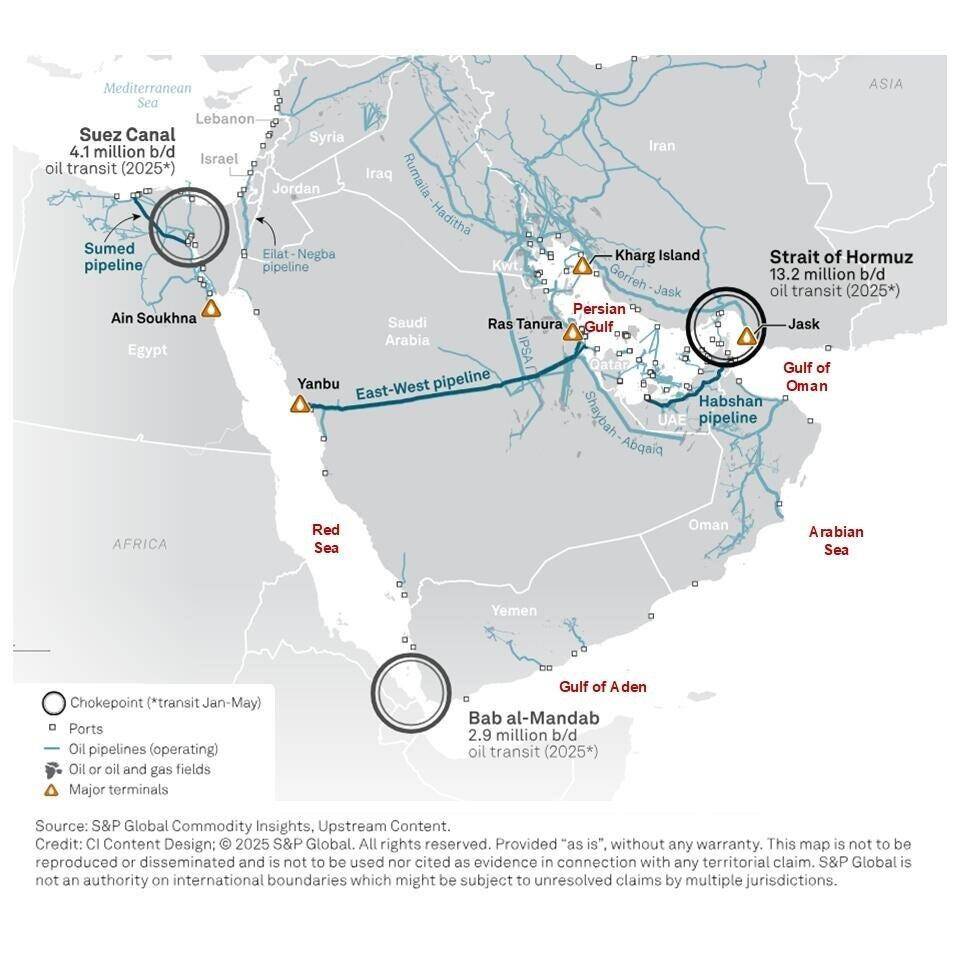
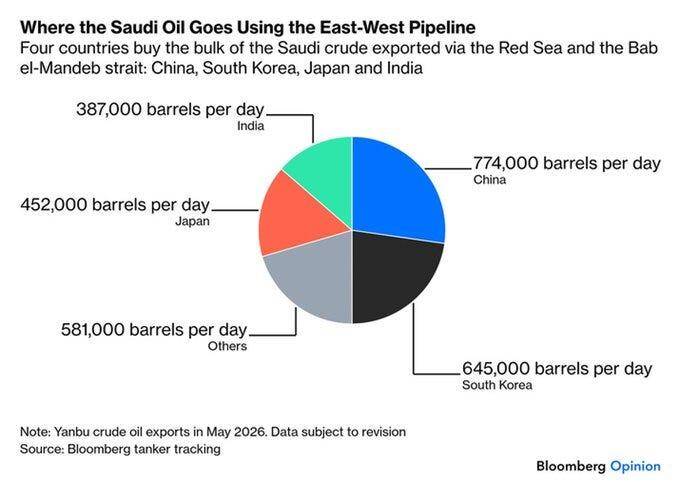
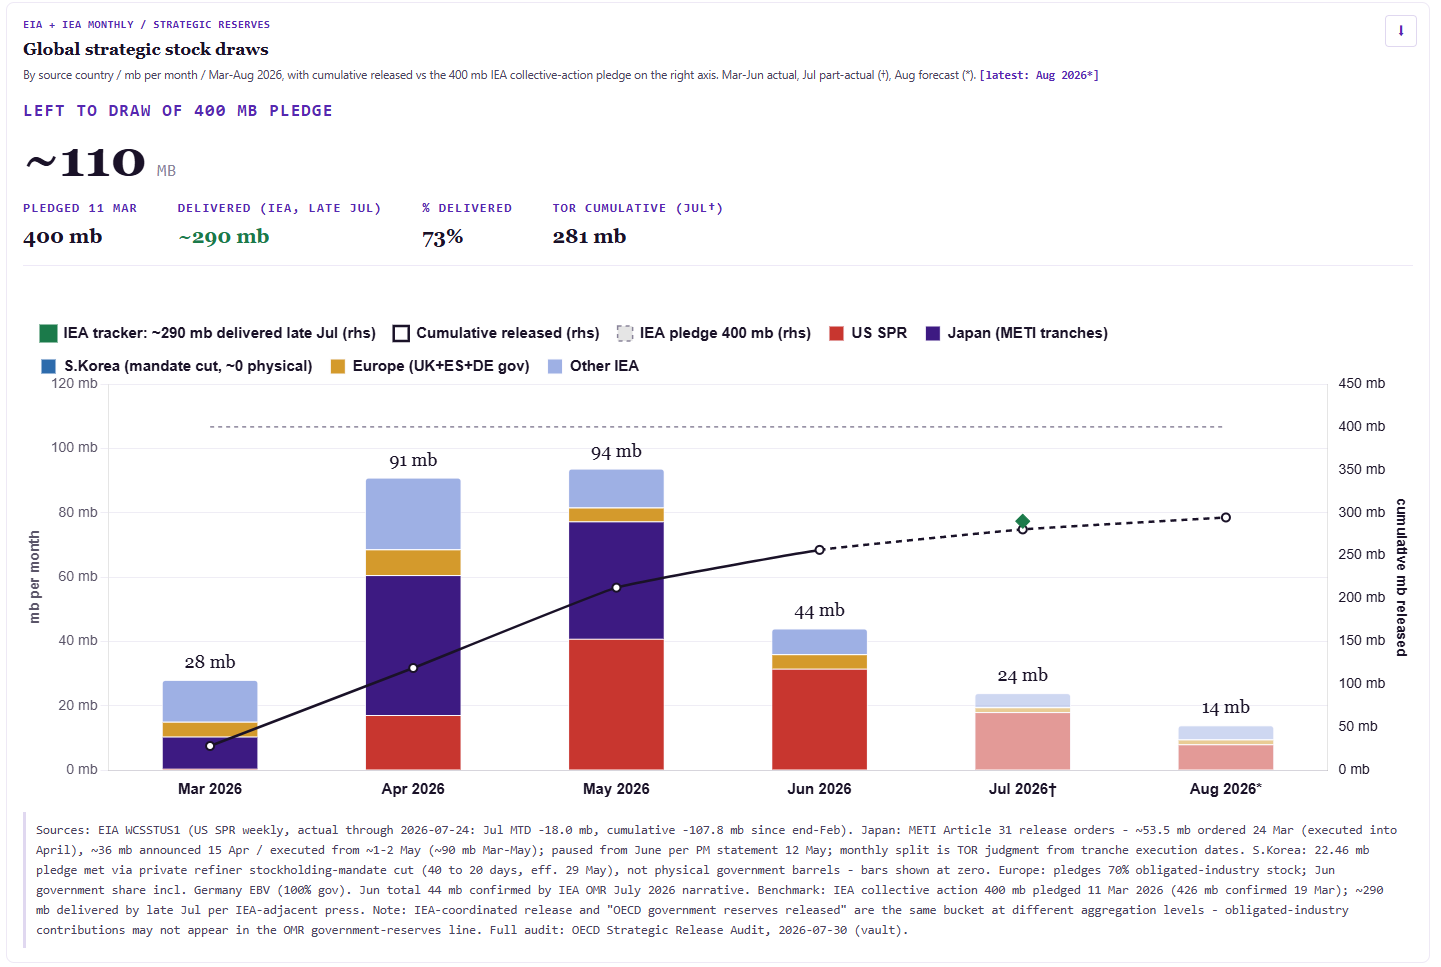
So we see a picture where, despite now 2 straits going hot, the cap on price is the safety net of the IEA strategic release and the headlines that talks are ongoing. The bulls had a great go at price over the last 3 weeks, and they continue to rule the roost.
The bears are holding on to 3 pillars, 1 is gone, 1 is dwindling and the other is never going to happen.
1. Dwindling – The strategic releases are scheduled to grow sharply smaller through August, with 110mb left of strategic reserves.
2. Never going to happen – The last couple of months, despite a lot of effort from all sides, have not yielded any middle ground on talks. A return to talks will be hobbled by the issues of the MOU.
3. Read on below in the China section.
Colliding Conflicts
We now get to connect the powers involved on both sides of the two major war fronts happening around the globe. The US, Europe and Israel represent the western axis. Russia, Iran and Yemen represent the eastern axis, with China no doubt to be added soon.
On Saturday, 26 July, Ukraine struck the Iranian-flagged cargo ship Ana in the Caspian Sea with a long-range drone. One crewman was killed. Zelenskyy said the vessel was moving drones and missiles from Iran to Russia. Iran called it commercial shipping and summoned Ukraine’s chief of mission. Two wars that were being fought separately are now being fought over the same supply line. I think this will serve as the first of many. In my opinion, this is a war that will move to global conflict status within 12 months.
Brent Oil Price Forecast
Every new Brent Oil analysis as it publishes, today's technical signal and key levels, live price — on one page.
See all Brent Oil forecasts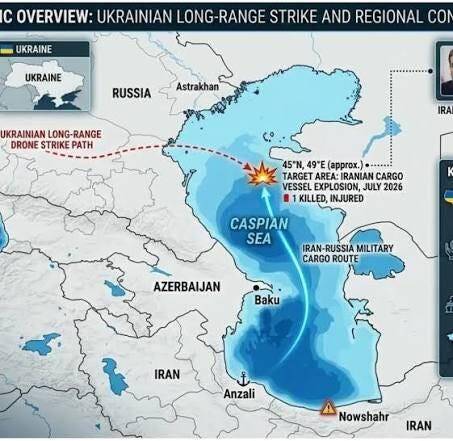
A Tightening Market
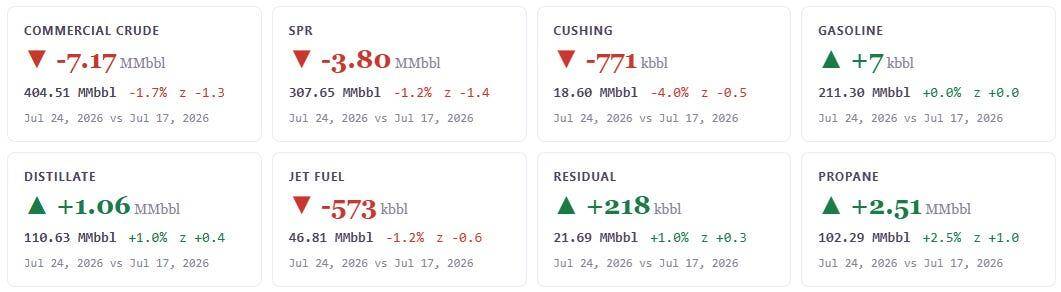
There is a tightness stalking the US crude picture. Refiners are running now at 97.2% efficiency, up from 96% prior. With margins as fat as they are around 70 bucks from a normalised range of about $20 to $30. The latest EIA report flagged a couple of points of evidence. Commercial crude was a 7.17mb draw with Cushing also drawing 4% further. The EIA adjustment reading of residual oil also took a sharp pullback- more in the EIA report here
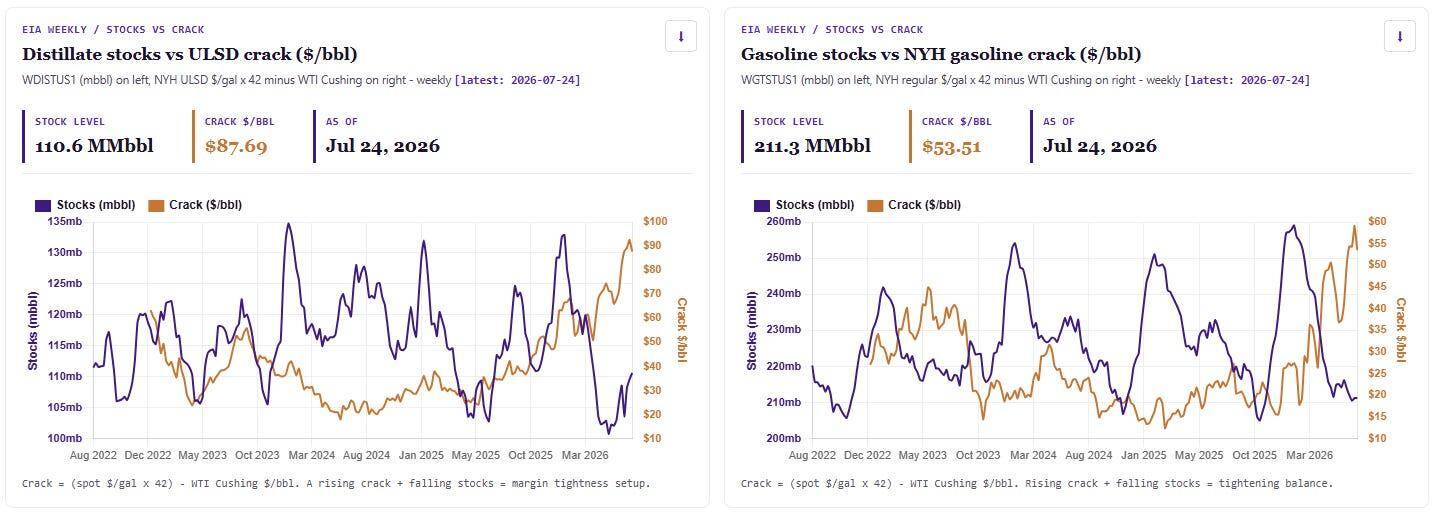
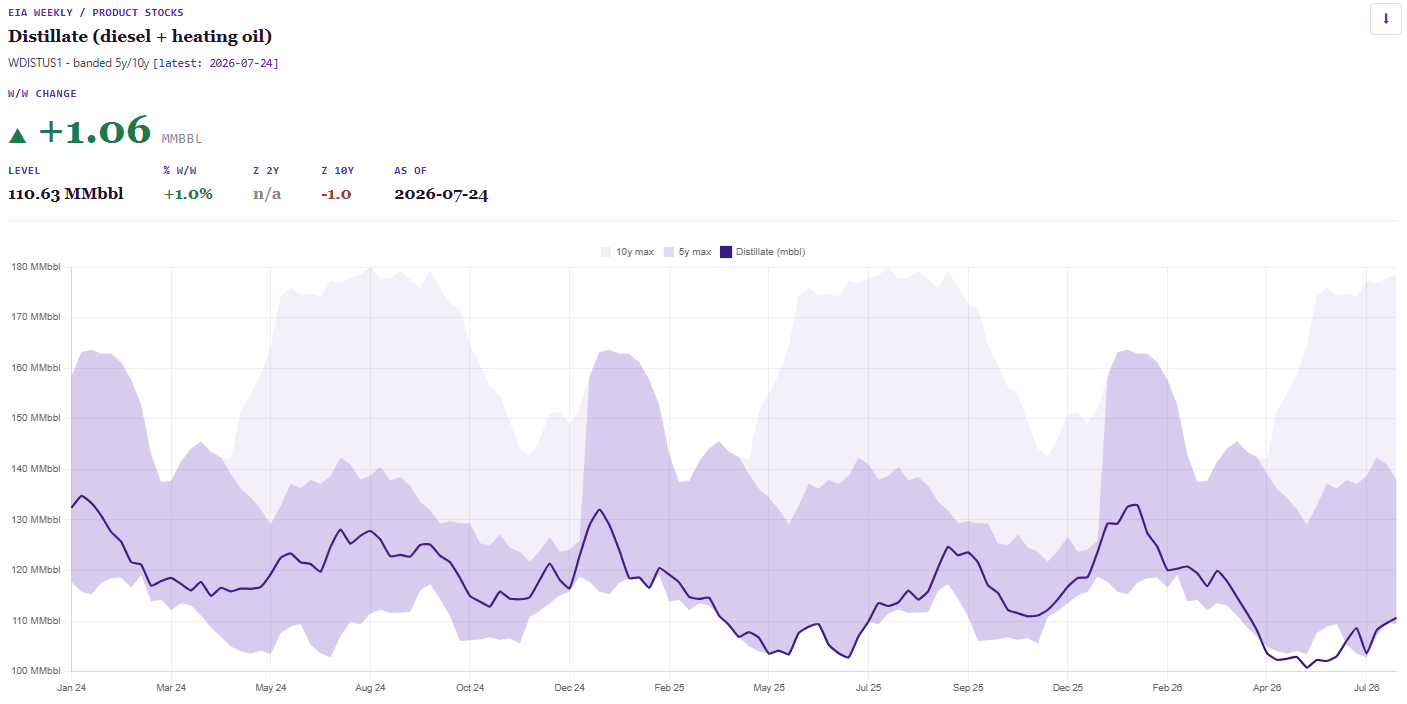
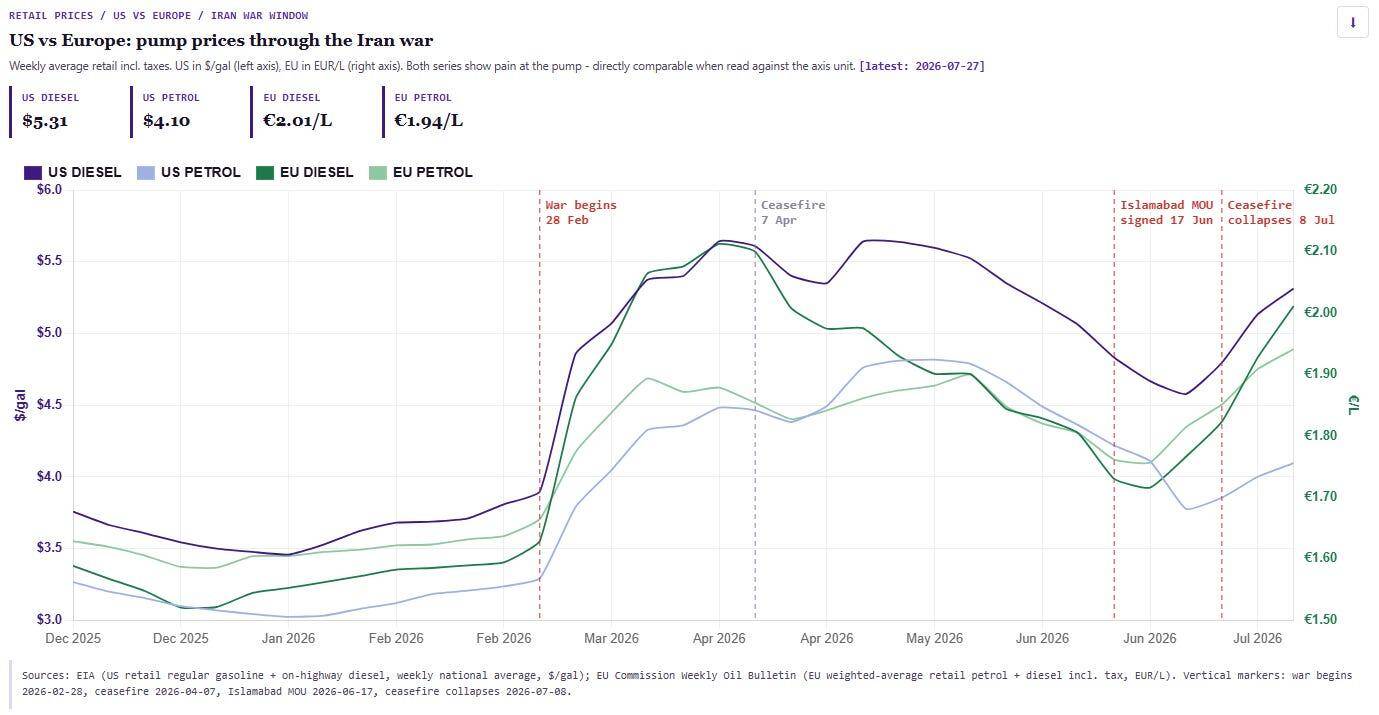
As I have discussed over the last 2 weeks, the concern is now shifting away from front month prices towards refining. Prices are now inflecting back towards the highs seen at the start of this conflict in March/April. We must watch this space, as governments across the world have largely thought that they dealt with this already. I would be concerned that they may not have thought this would need a second bandage. Will we see new highs across Diesel and Petrol? I think we will, and it will come right into harvest time. Despite The US producing higher rates of Diesel, it may not be enough given how decimated the global refinery picture is currently.
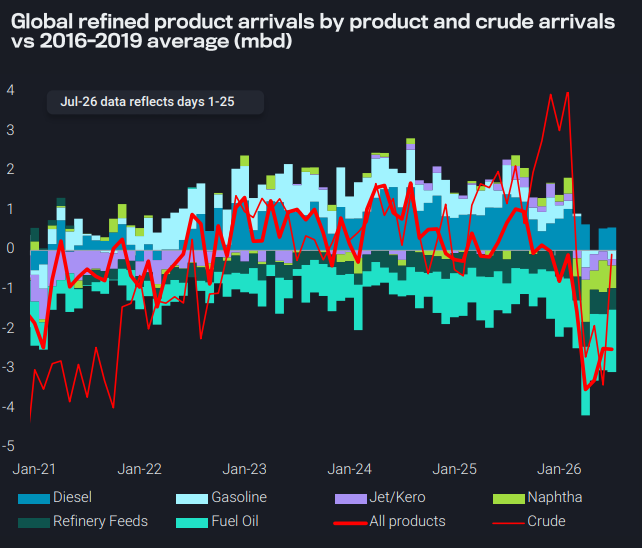
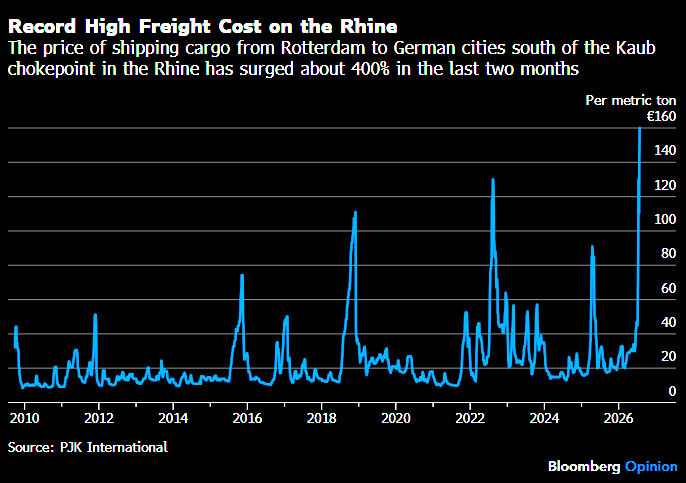
Oh, and there is also this.
China Is Back!
Russia is increasing its exports to China via the Northern Sea Route. And guess what? They are back importing amidst a sharp reduction in onshore crude inventories.
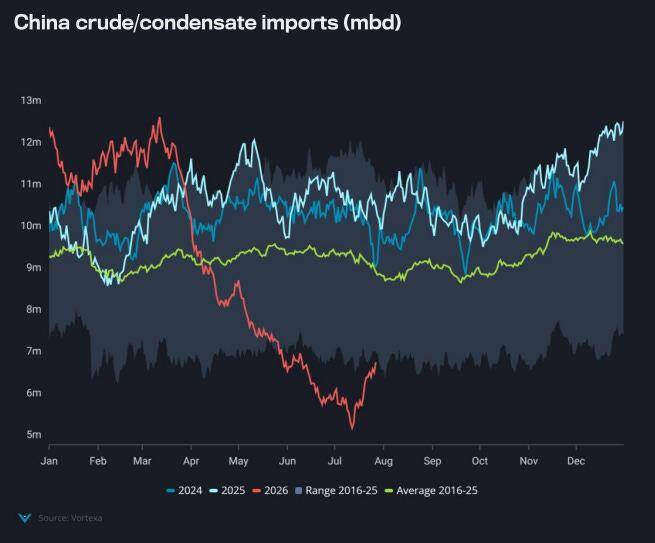
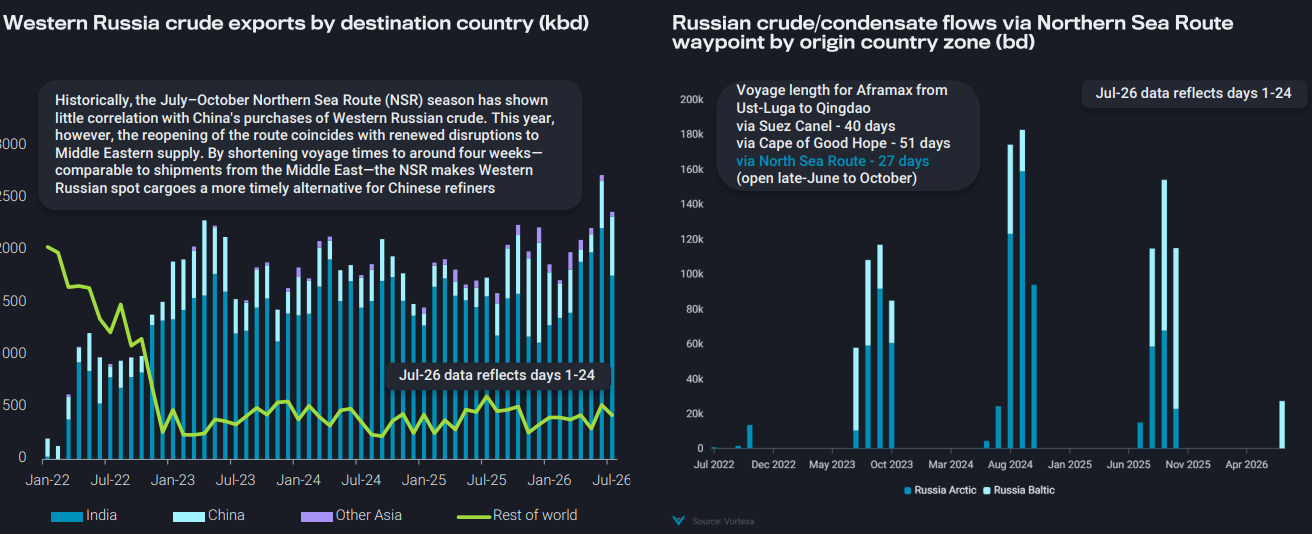
On close observation, USGC -U.S Gulf Coast crude is NOT being bought by China.
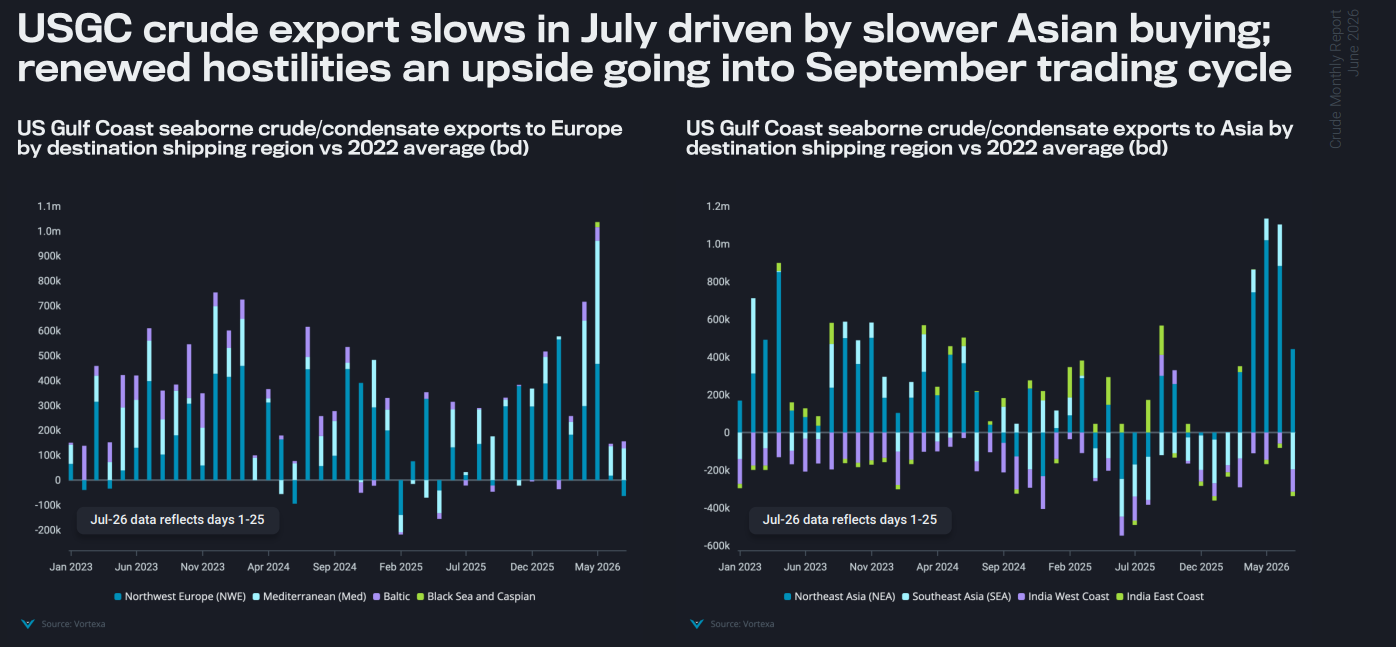
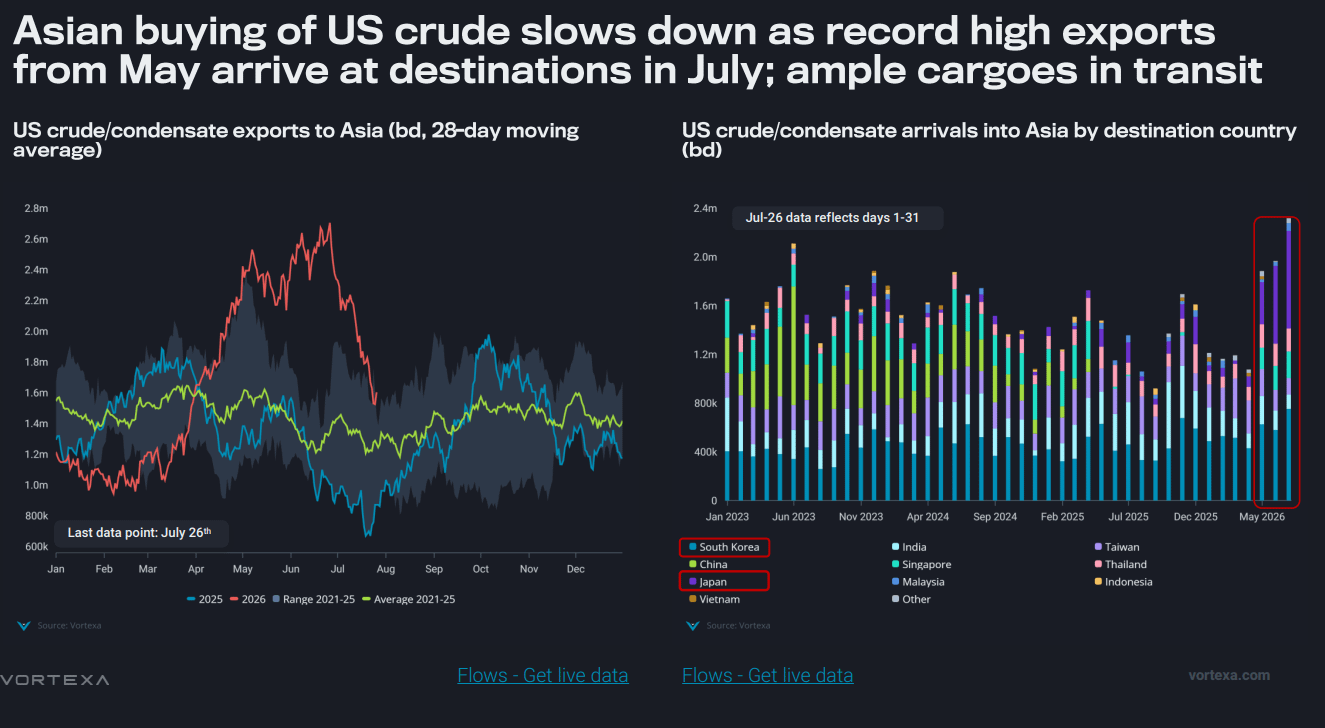
The Net Net
The sword of The Houthis hangs over the market right now and we can see this everywhere from positioning and price, to transits and routing. I said it last week and I’ll say it again. This market is way too mispriced and we must move up! This will be falsified by new intervention from the IEA or Iran/US negotiations actually becoming substantive. The Hamas Israeli draft peace deal is absolute window dressing.
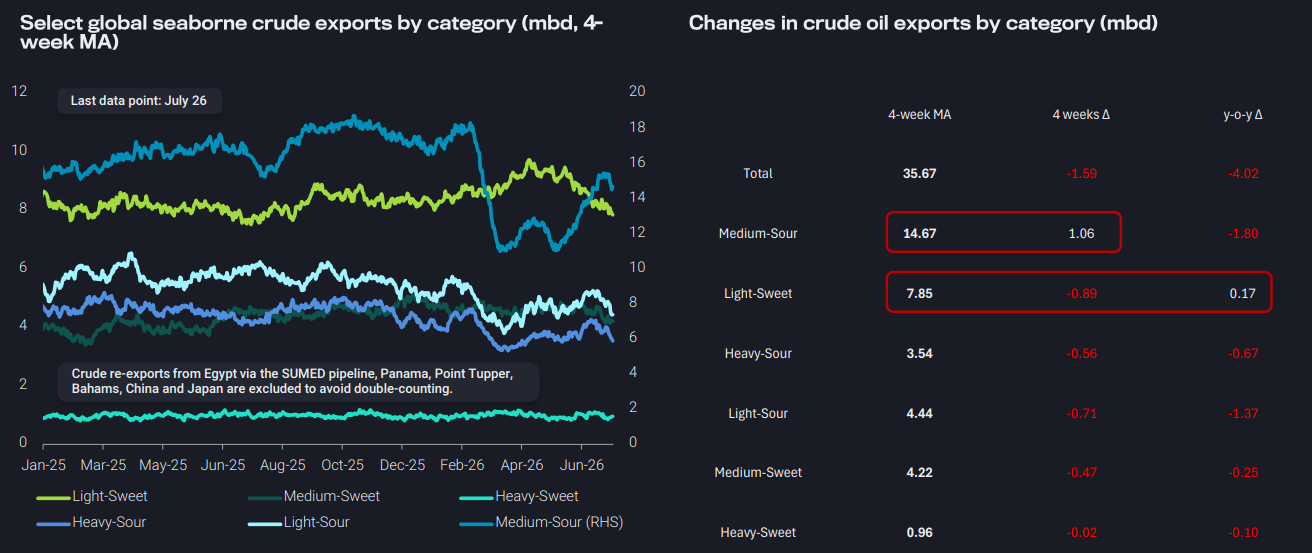
We are already seeing MEG export slowdowns impacting all key grades, with a sustained downwards trajectory on the precious light sweet grade. This will underpin the bid on markets along with China now back in the market. And people want to be short?
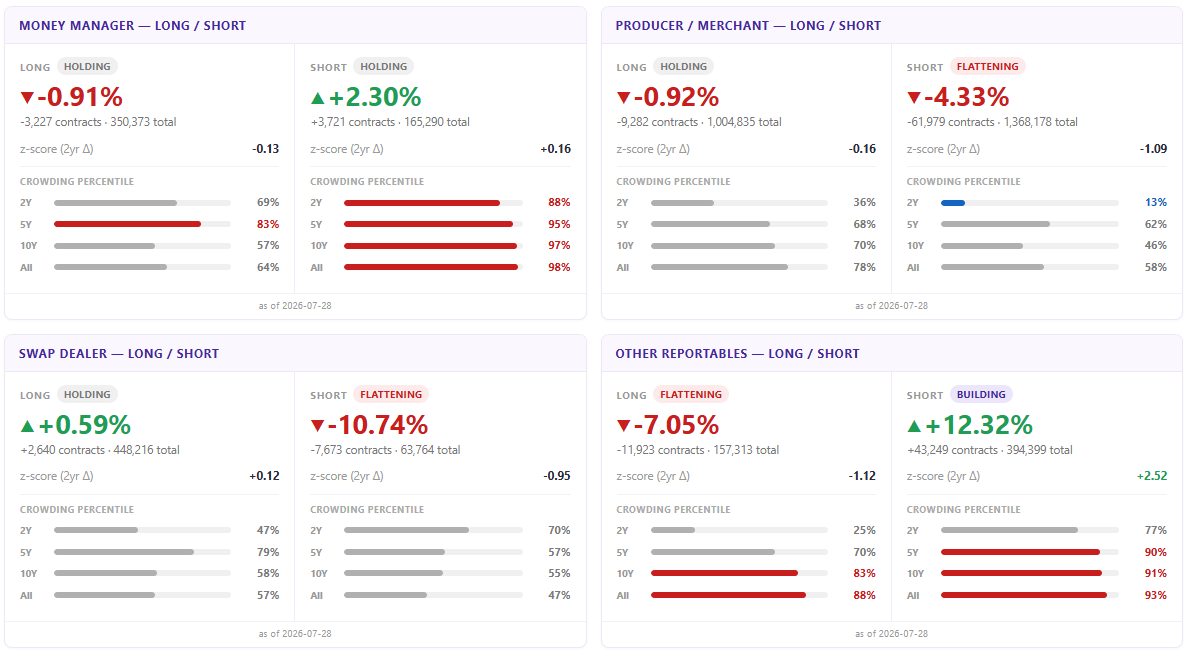
The Swap dealers closed shorts by 10% or 7k contracts while increasing longs by 2600 contracts. A good show that they are locsing appetite to short a market with these aforementioned clear and present dangers.
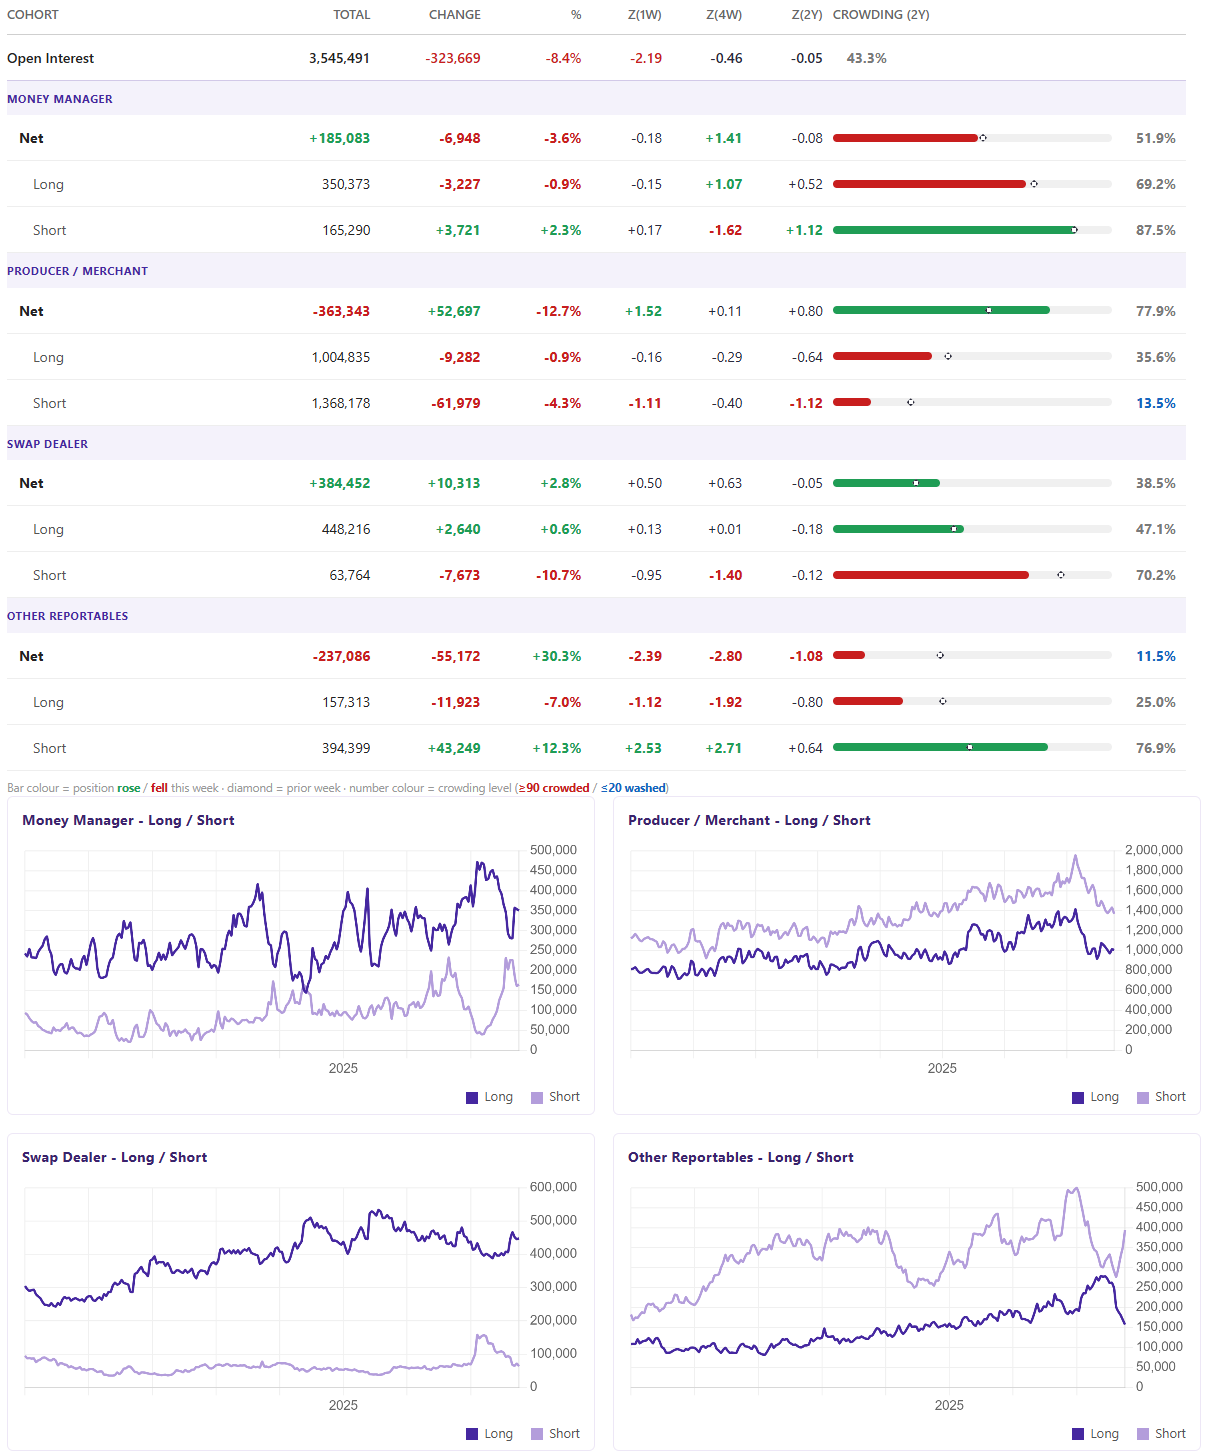
Money managers increased their shorts (god bless em) by 2.3% 3700 contracts, while also cutting longs by a similar amount of size 3200 contracts. This tells me these guys are getting stubbornly short the whole shooting match AGAIN (87th percentile crowded on a 2yr look back)c
Producer/merchant shorts fell 61,979 contracts, -4.3%, and their crowding is pretty low. The physical side in the bottom 15% of the last two years…. into a rally. They are standing back from selling forward. These are the actions of a cohort that sees higher prices ahoy!
The Read
The Open Interest decline is almost entirely options: futures-only open interest fell 12,000 lots, a 0.2 sigma move, which is noise. The print lands in the last week of the month, when ICE Brent options expire. Since 2011, a 2-sigma open interest drop has happened in 9.0% of month-end weeks against 2.4% of mid-month weeks – nearly four times as often. This is the calendar, not a change in positioning. The last one was 28 April, at 3.1 sigma.
Despite the noise, it is clear that swappies remain long by a factor of 7x against shorts. Money managers are net long by a factor of 2x their shorts. The market is long, but the smaller OR are net short by a factor of about 2.5 of their longs.
What’s the Next Move?
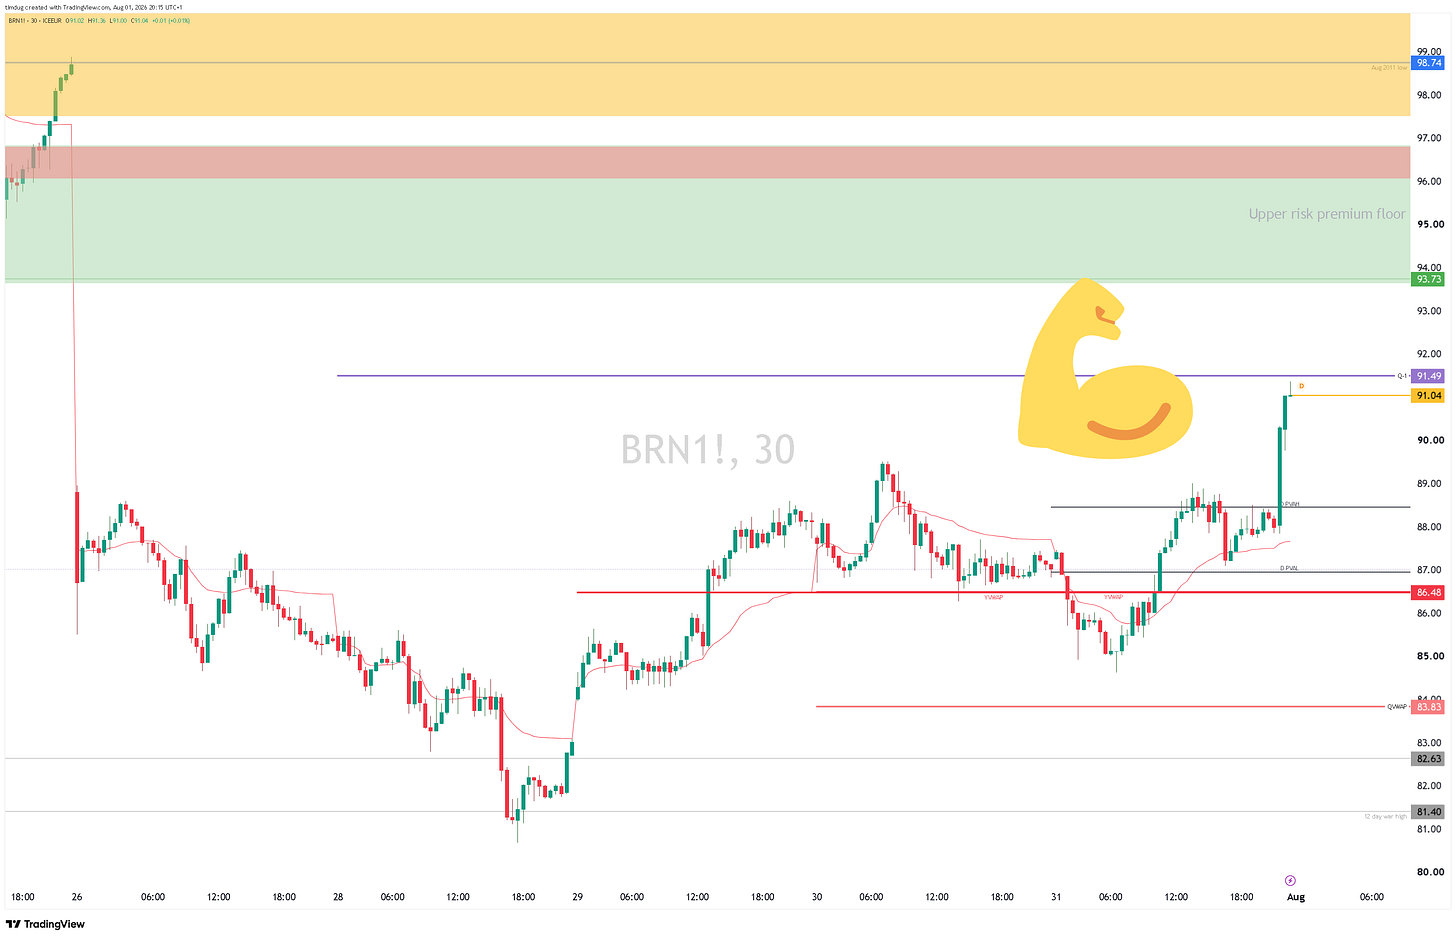
Given the stochastic nature of this conflict, ie. it does not pay to be overly committed to a view. And that if you take on a headline-driven trade, that you understand that you are on limited time until the upside meets its terminal cap point. I have been mapping these fixed areas over the last few months in the trade section. ‘Strong views, loosely held’ really serves us well here in this war when placing and removing risk.
With all that bullshit said, I continue to think we go higher… and the hanging sword of The Houthis is enough to take us there. We must remain exposed to the upside, despite talk of gluts and surplus into 2027.
It has been an exceptionally quiet week on the Red Sea front, and I do not see this calm continuing. The US will get frustrated and continue to hit Iran who will retaliate in the Red Sea. Iran are playing an exceptional game of asymetric warfare.
Technical view is simple. The 12-cday war high of brent $81.40 was only tested as support once in the week past. Holding that will bring us back to $91.50’s and $93.73 which is the low of the upper risk premium floor. We then pull back in a flush out of the momentum chasers, then push on to $97s+++. Thought once we touch $97s (top of upr risk floor), there will be sellers and I expect buyers to return from $93.73 area ie. bottom of the upr risk floor. Then its chucks’ ahoy for closing the upr gap. All told, an 18% up move. It may not come all next week, but I believe its coming. Notwithstanding the falsifiers I mentioned above.
Just before publishing this on early Sunday morning, Trump, has come out pausing any further attacks on Iran. This would make me cautious that we could actually have a small gap down on electronic overnight reopen tonight. I will have to update everyone with trade guidance on Tuesday when I’m back from the Bank Holiday here.