
USOIL, UKOil & Natural Gas Outlook: U.S. Stock Build Tests Crude as Saudi Supply Disruptions Persist
Oil fundamentals were more mixed on Wednesday. An inventories report showed unexpected inventory builds on U.S. shores. The American Petroleum Institute reported a build of 7.1 million barrels versus the anticipated draw of 1.6 million barrels. Inventories for gasoline and distillates also built at the U.S. shores. This means supplies may be building more rapidly than anticipated.
Looking at WTI and Brent, the larger physical-market disruption concern is still Saudi Arabia. Saudi Arabia has halted Yanbu port loadings after attacks on the kingdom’s East-West pipeline. Saudi Arabia is also canceling some September cargoes to European clients. In addition, they are offering additional supplies for Asian clients through ship-to-ship offloading near Sohar, Oman, to offset the displacement of projected cargos.
The pipeline had previously carried 4 to 5 million barrels per day, and is a significant alternative to the Strait of Hormuz. U.S. Energy Secretary Chris Wright, stated on Tuesday that he expected the pipeline to start up again in a matter of days. However, sources told Reuters that it could take a considerable amount of time.
Hormuz remains disrupted. Preliminary shipping data reported only four visible vessel transits on Tuesday, compared to seven on Monday and the 10-day average of 18. Before the conflict, the waterway accounted for one-fifth of all international oil and LNG supplies.
For LNG, the U.S. enjoys another great year of exporting. This year, the Middle East has been particularly disruptive, resulting in a loss of 36 million tons of LNG, mainly lacking Qatari and UAE LNG exports through the Strait of Hormuz. U.S. LNG balances the market. The EIA anticipates record dry-gas production of 111.7 bcfd in 2026, with inventories heading into winter at 5% above their average of the last 5 years.
Fundamental bias: USOIL moderately bullish, UKOil moderately bullish, Natural Gas moderately bullish.

Natural Gas Technical Analysis: NG Tests Descending Trendline as $2.92 Resistance Caps the Rebound
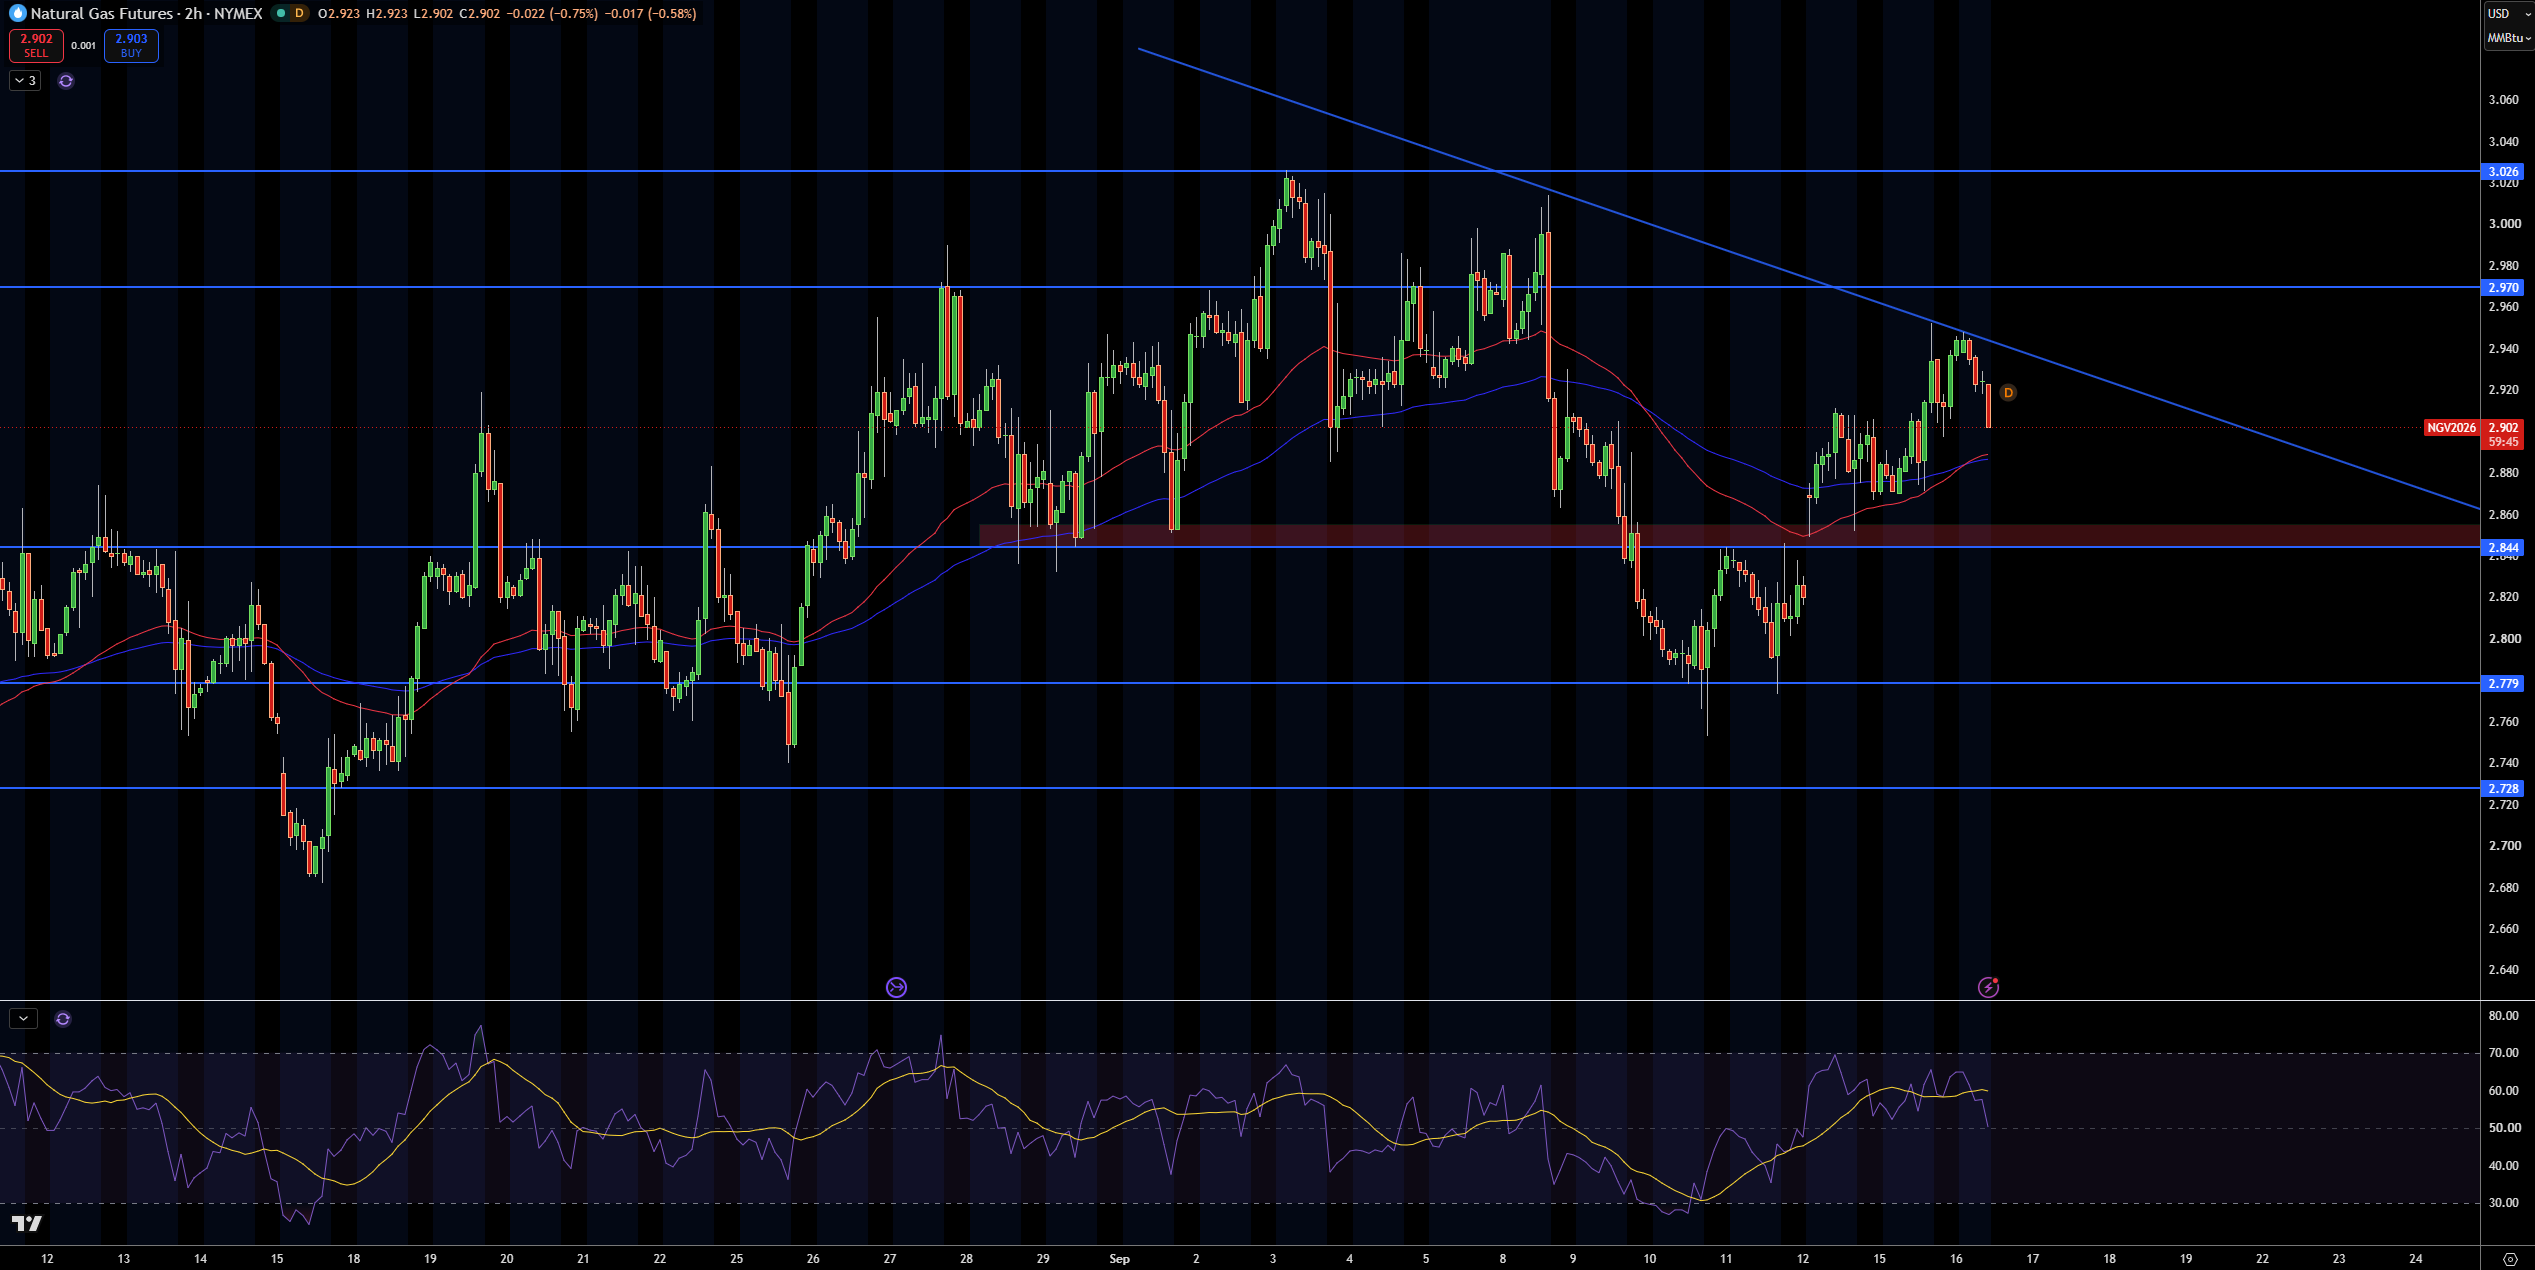
Natural gas has touched $2.90 after rebounding from the $2.78 area. While natural gas has recovered above the short term moving averages, price has found resistance at the falling trend line and the $2.92 area. This leaves the overall structure neutral.
The first resistance zone is between the $2.92 and $2.97 areas. A move above these levels opens the $3.03 area. On the other hand, from a lower standpoint, if selling pressure returns, then the natural gas price would trade around the $2.84 area, followed by the $2.78 and $2.73 levels.
The RSI is still within its neutral range, but is more bullish than bearish at the moment. I am neutral, but leaning bullish as long as the price of natural gas stays above the $2.84 level. I would become more bullish if price rises above $2.92 and more bearish if price falls below the $2.84 level.
Natural Gas Price Forecast
Every new Natural Gas analysis as it publishes, today's technical signal and key levels, live price — on one page.
See all Natural Gas forecastsWTI Crude Oil Technical Analysis: USOIL Holds Above $103.16 as $106.69 Breakout Remains in Sight
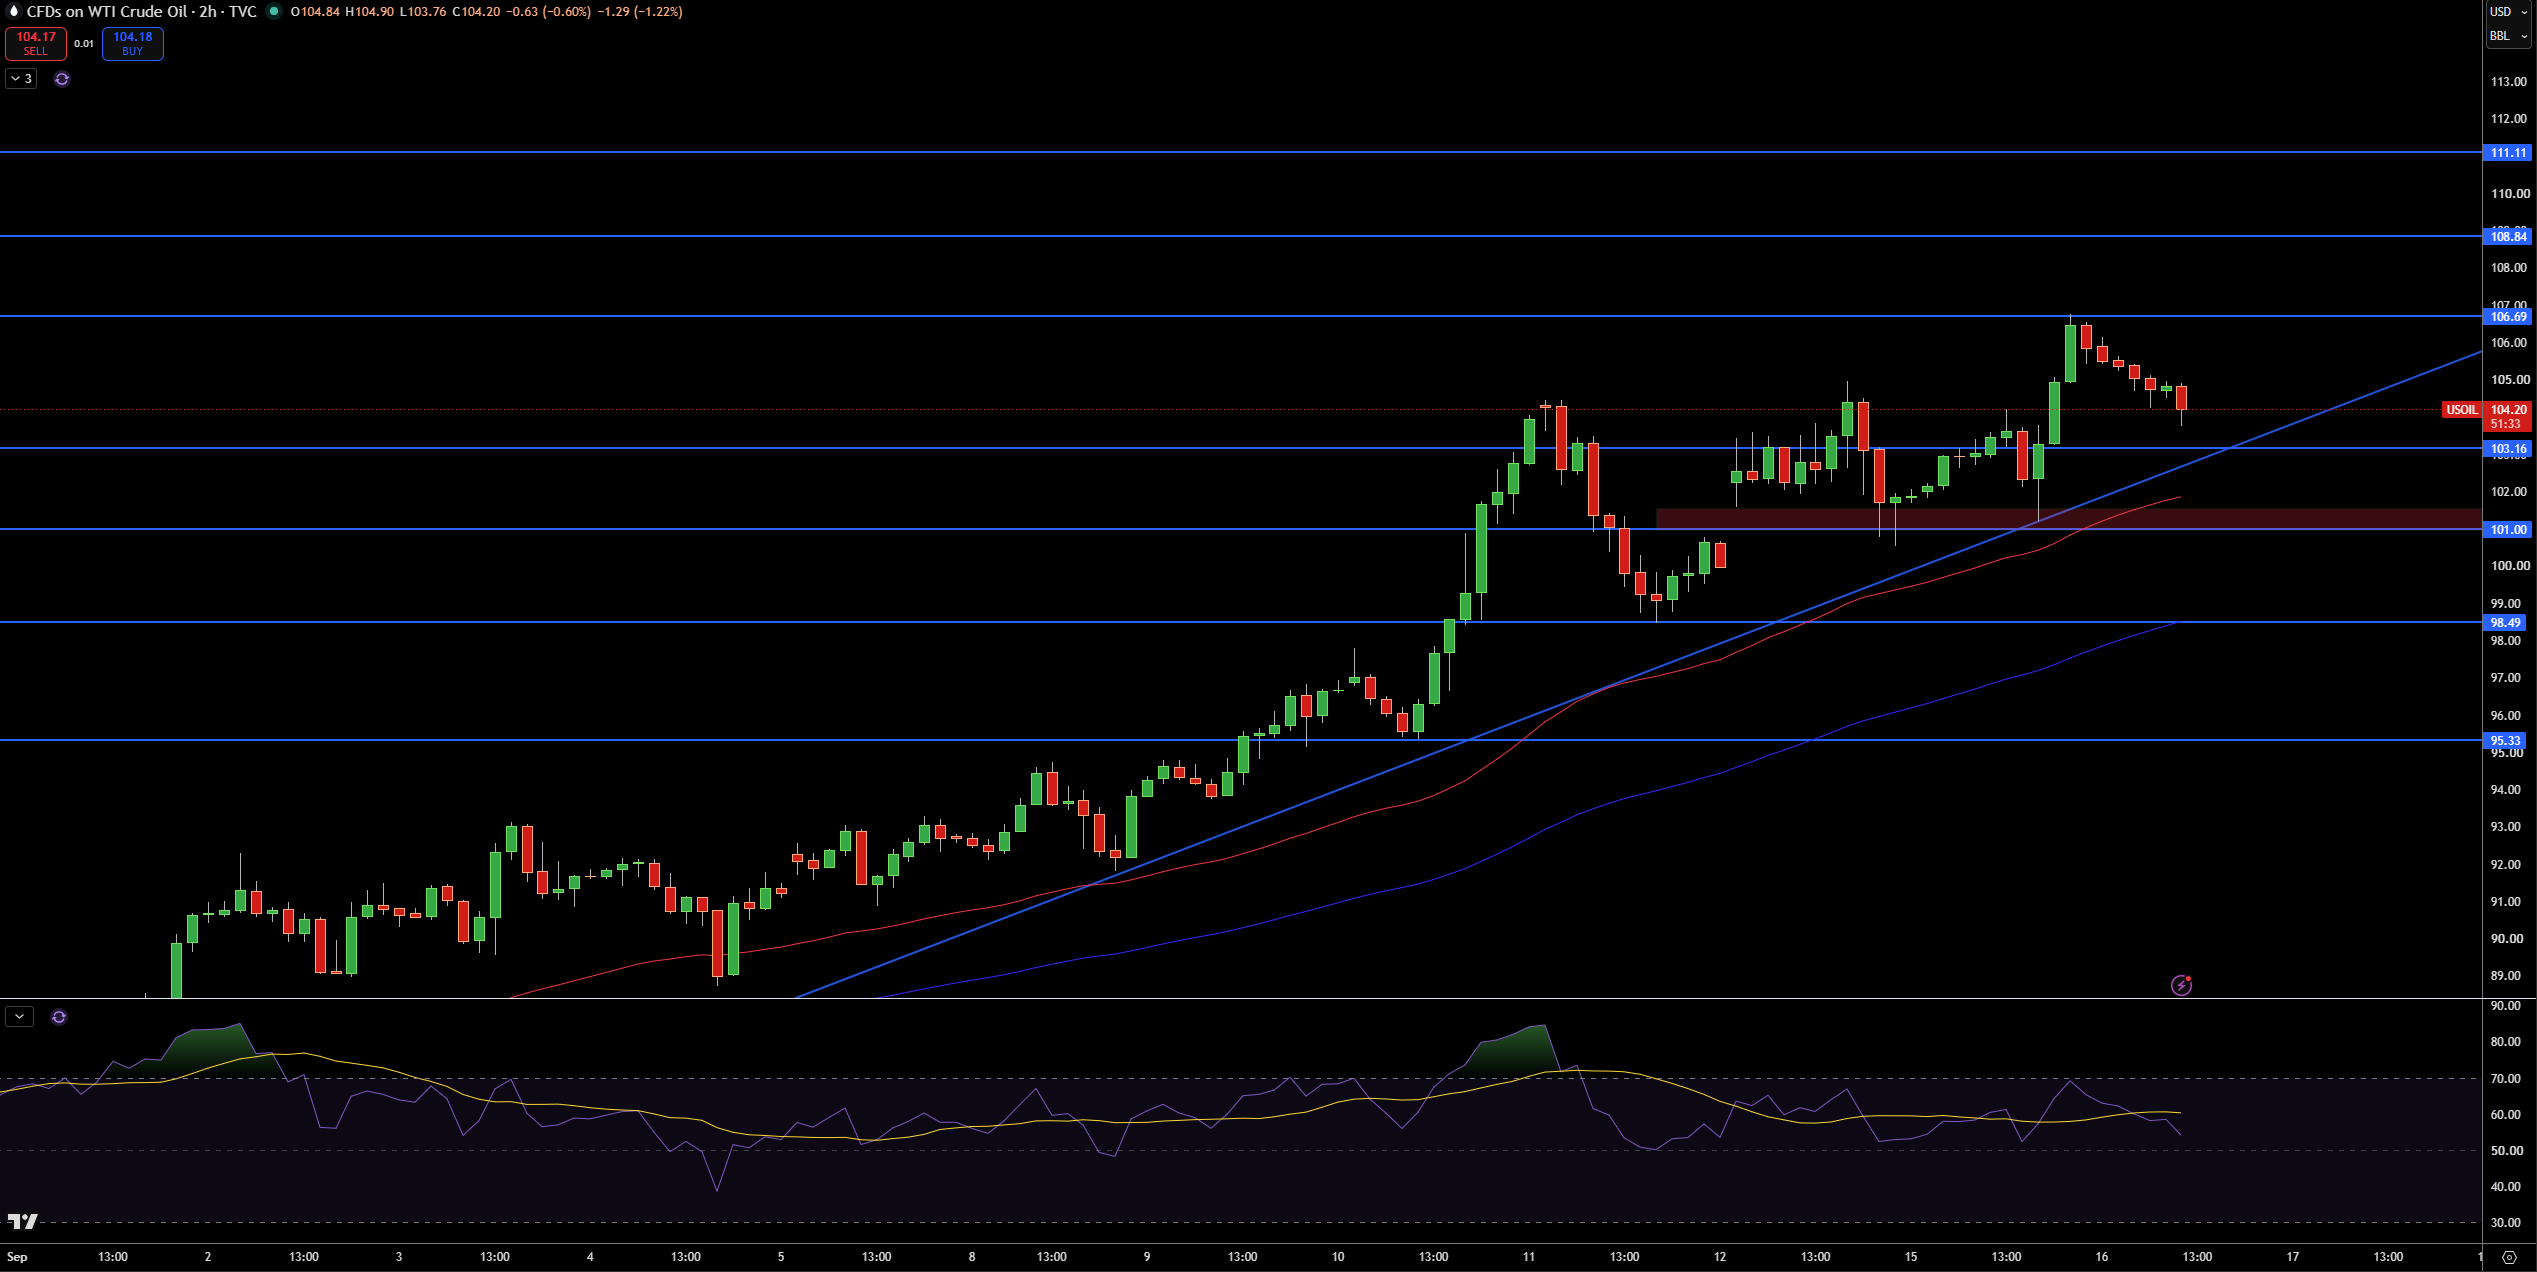
WTI crude price is currently trading at $104.20 on the 2-hour chart. The first thing that stands out is that WTI crude price continues to trade above the rising trend line while residing comfortably above both the moving averages. The latest pull back from the $106.69 resistance zone has been an orderly pull back and leaves the overall and dominant short term structure still in favor of the bulls.
The first significant resistance zone will come into play at $106.69. A clean break above this will bring $108.84, $111.11 into focus. The opposite will be true from a support standpoint, and the first important support zone will come in at $103.16 and $101.00 will come into play if price moves lower. A deeper pull back will bring the focus back to the $98.49 support zone.
From a potential momentum perspective, the RSI is still above the mid line, and that remains in favor of the bulls while price trades above $103.16 and the rising trend line. Until price moves reliably below $101.00, the bullish case remains in favor. Beyond $106.69, the next target will be the $108.84 resistance zone.
Brent Crude Oil Technical Analysis: UKOIL Holds $105.14 as $109.87 Remains the Immediate Test
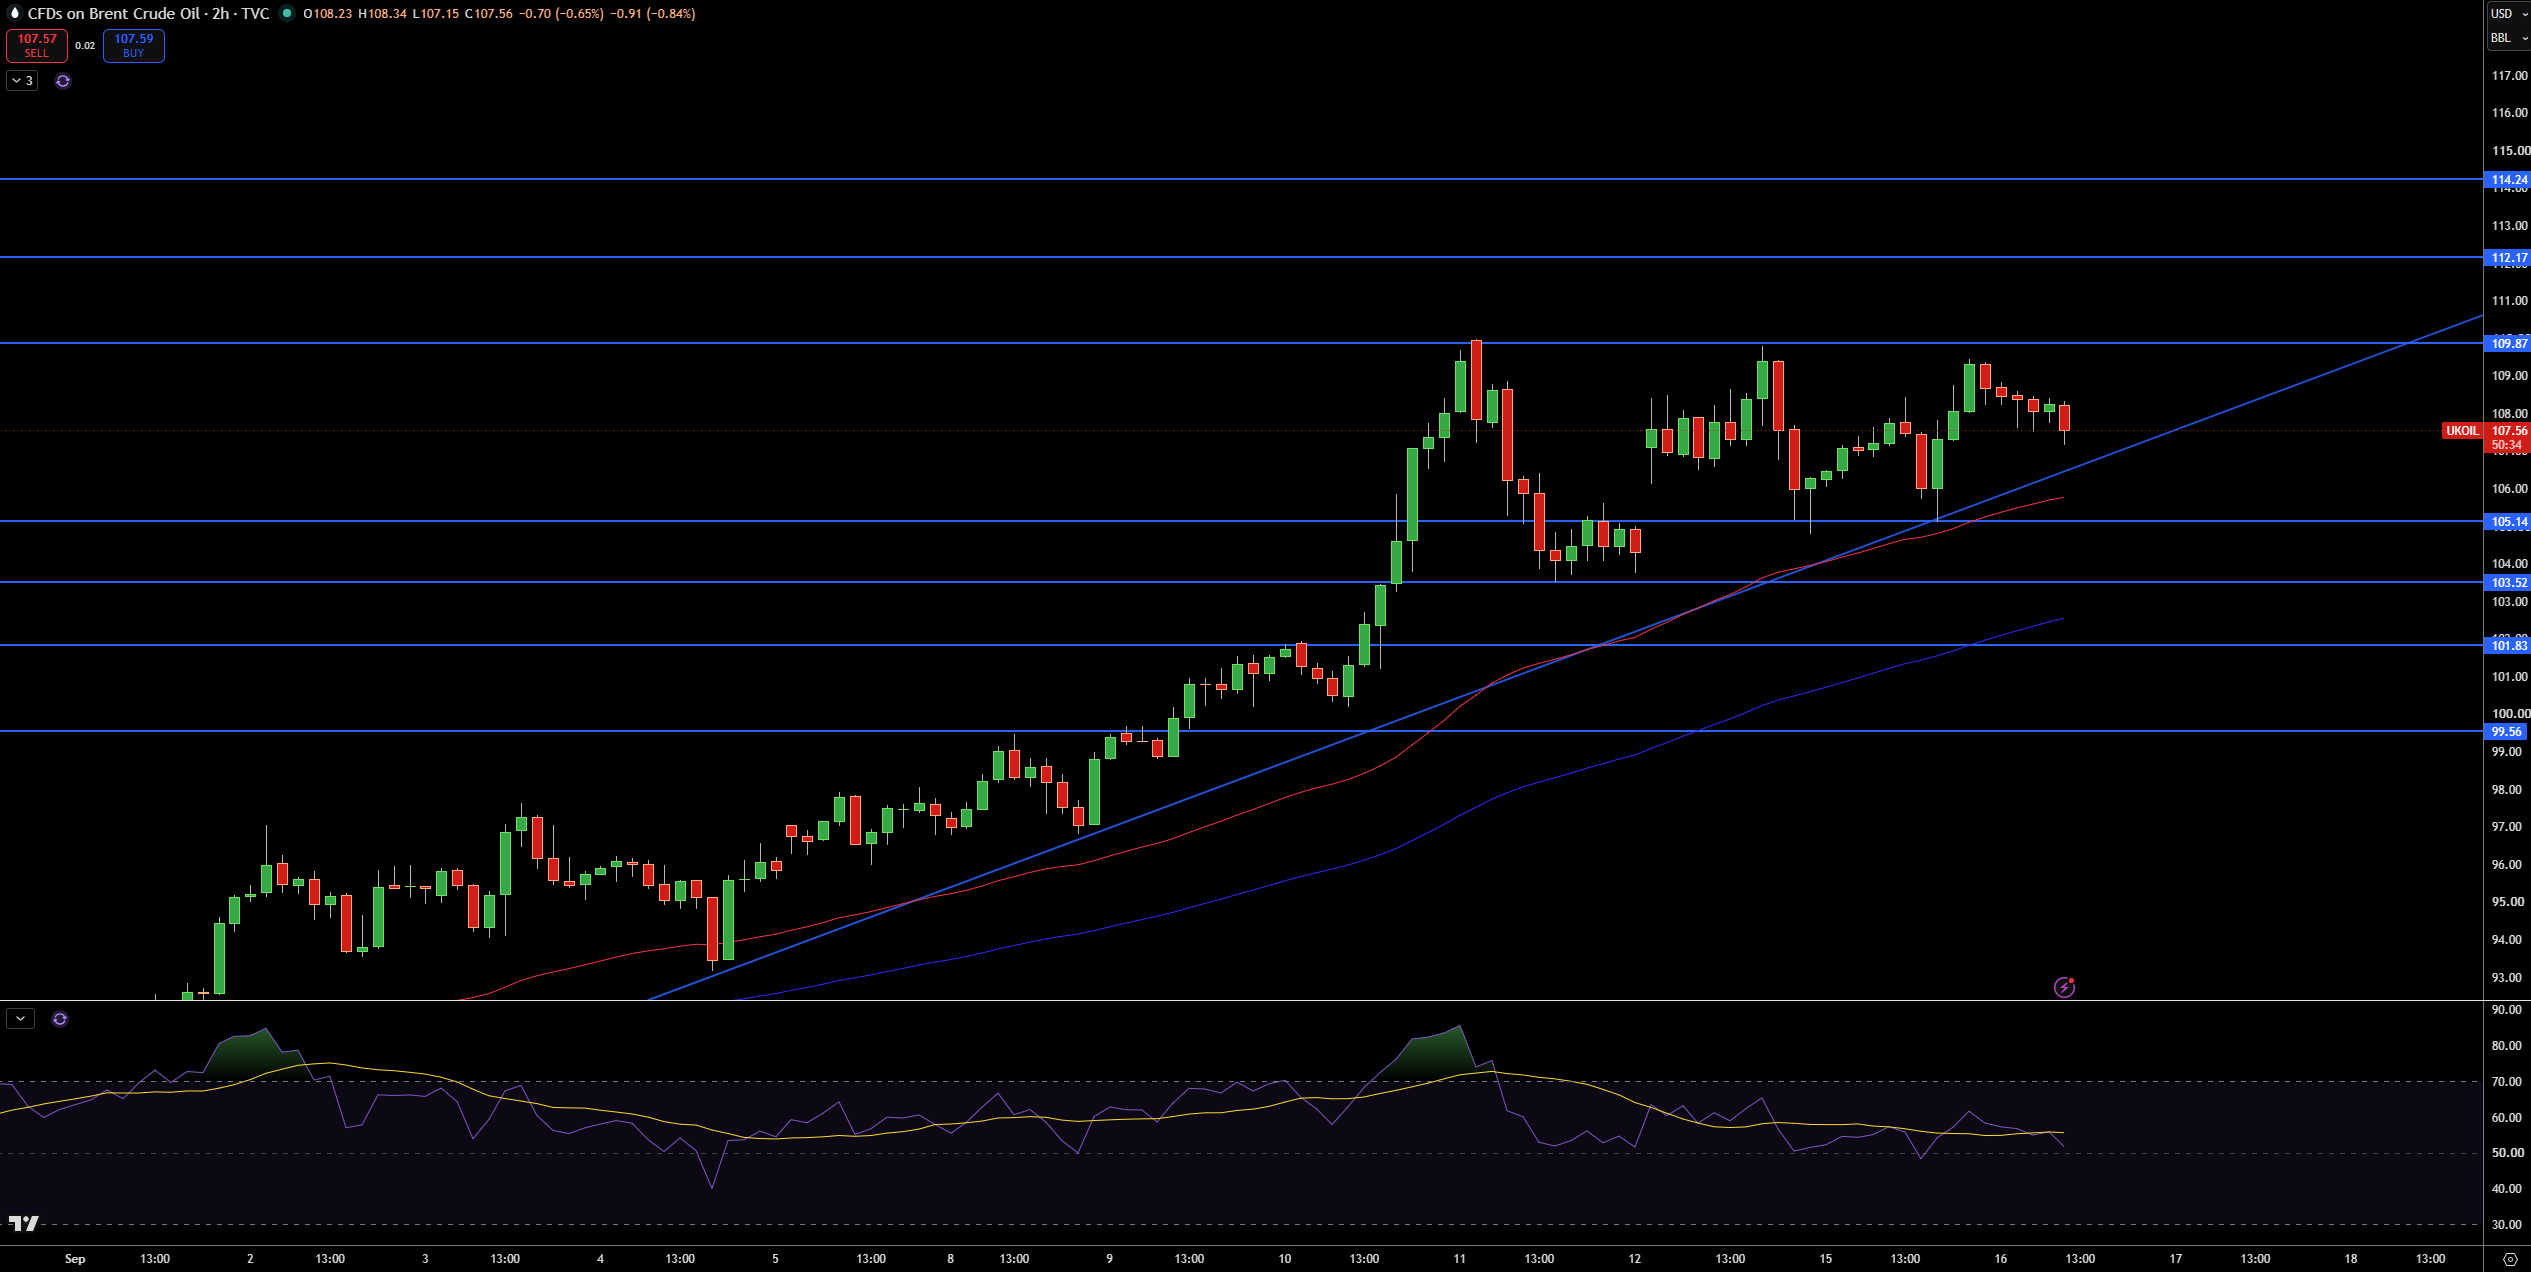
Brent crude oil is currently trading at $107.56 on the 2 hour chart. The recent trading action has kept the price above the rising trend line and both moving averages. While upside movement has seen a subsequent pull back, the overall structure remains in favor of the bulls.
The next target zone will be encountered at $109.87, and a clean break above this will bring focus on $111.11 and $113.00. Support zones will come into play at $98.20 and $98.49
RSI provides a potential bullish signal as it is currently in an over bought zone. Price action above the current rising trend line will remain supportive for the bulls. A potential shift to the bears will occur if price action moves reliably below the $98.20 and $98.49 support zones. A clean break above $109.87 will bring the focus on $111.11 and $113.00.
The first resistance I am looking at is positioned at $109.87. A break above that level would put $112.17 and $114.24 in focus. On the other hand, $105.14 is the first important support. If the current structure weakens, support levels are likely to be at $103.52 and $101.83.
RSI is currently in a consolidation zone. This is a bullish structure as long as Brent stays above $105.14. A break below $103.52 would change my outlook to neutral, while a break above $109.87 would put $112.17 in focus.