Zcash (ZEC) surged with the crypto market to a new record high and is now eyeing further gains on a convincing bullish continuation setup.

ZEC Breaks Out Of Bull Flag Pattern
ZEC’s price jumped by almost 35% to reach near $1,396 on Sept. 17, its highest level on record. This upside move pushed the price above the upper trendline of its recent bull flag, a continuation pattern that typically resolves in the direction of the preceding uptrend.
The pattern appeared after Zcash rallied sharply from around $800 in late August to above $1,200 in September. ZEC then entered a brief consolidation phase, forming lower highs while holding above rising support.
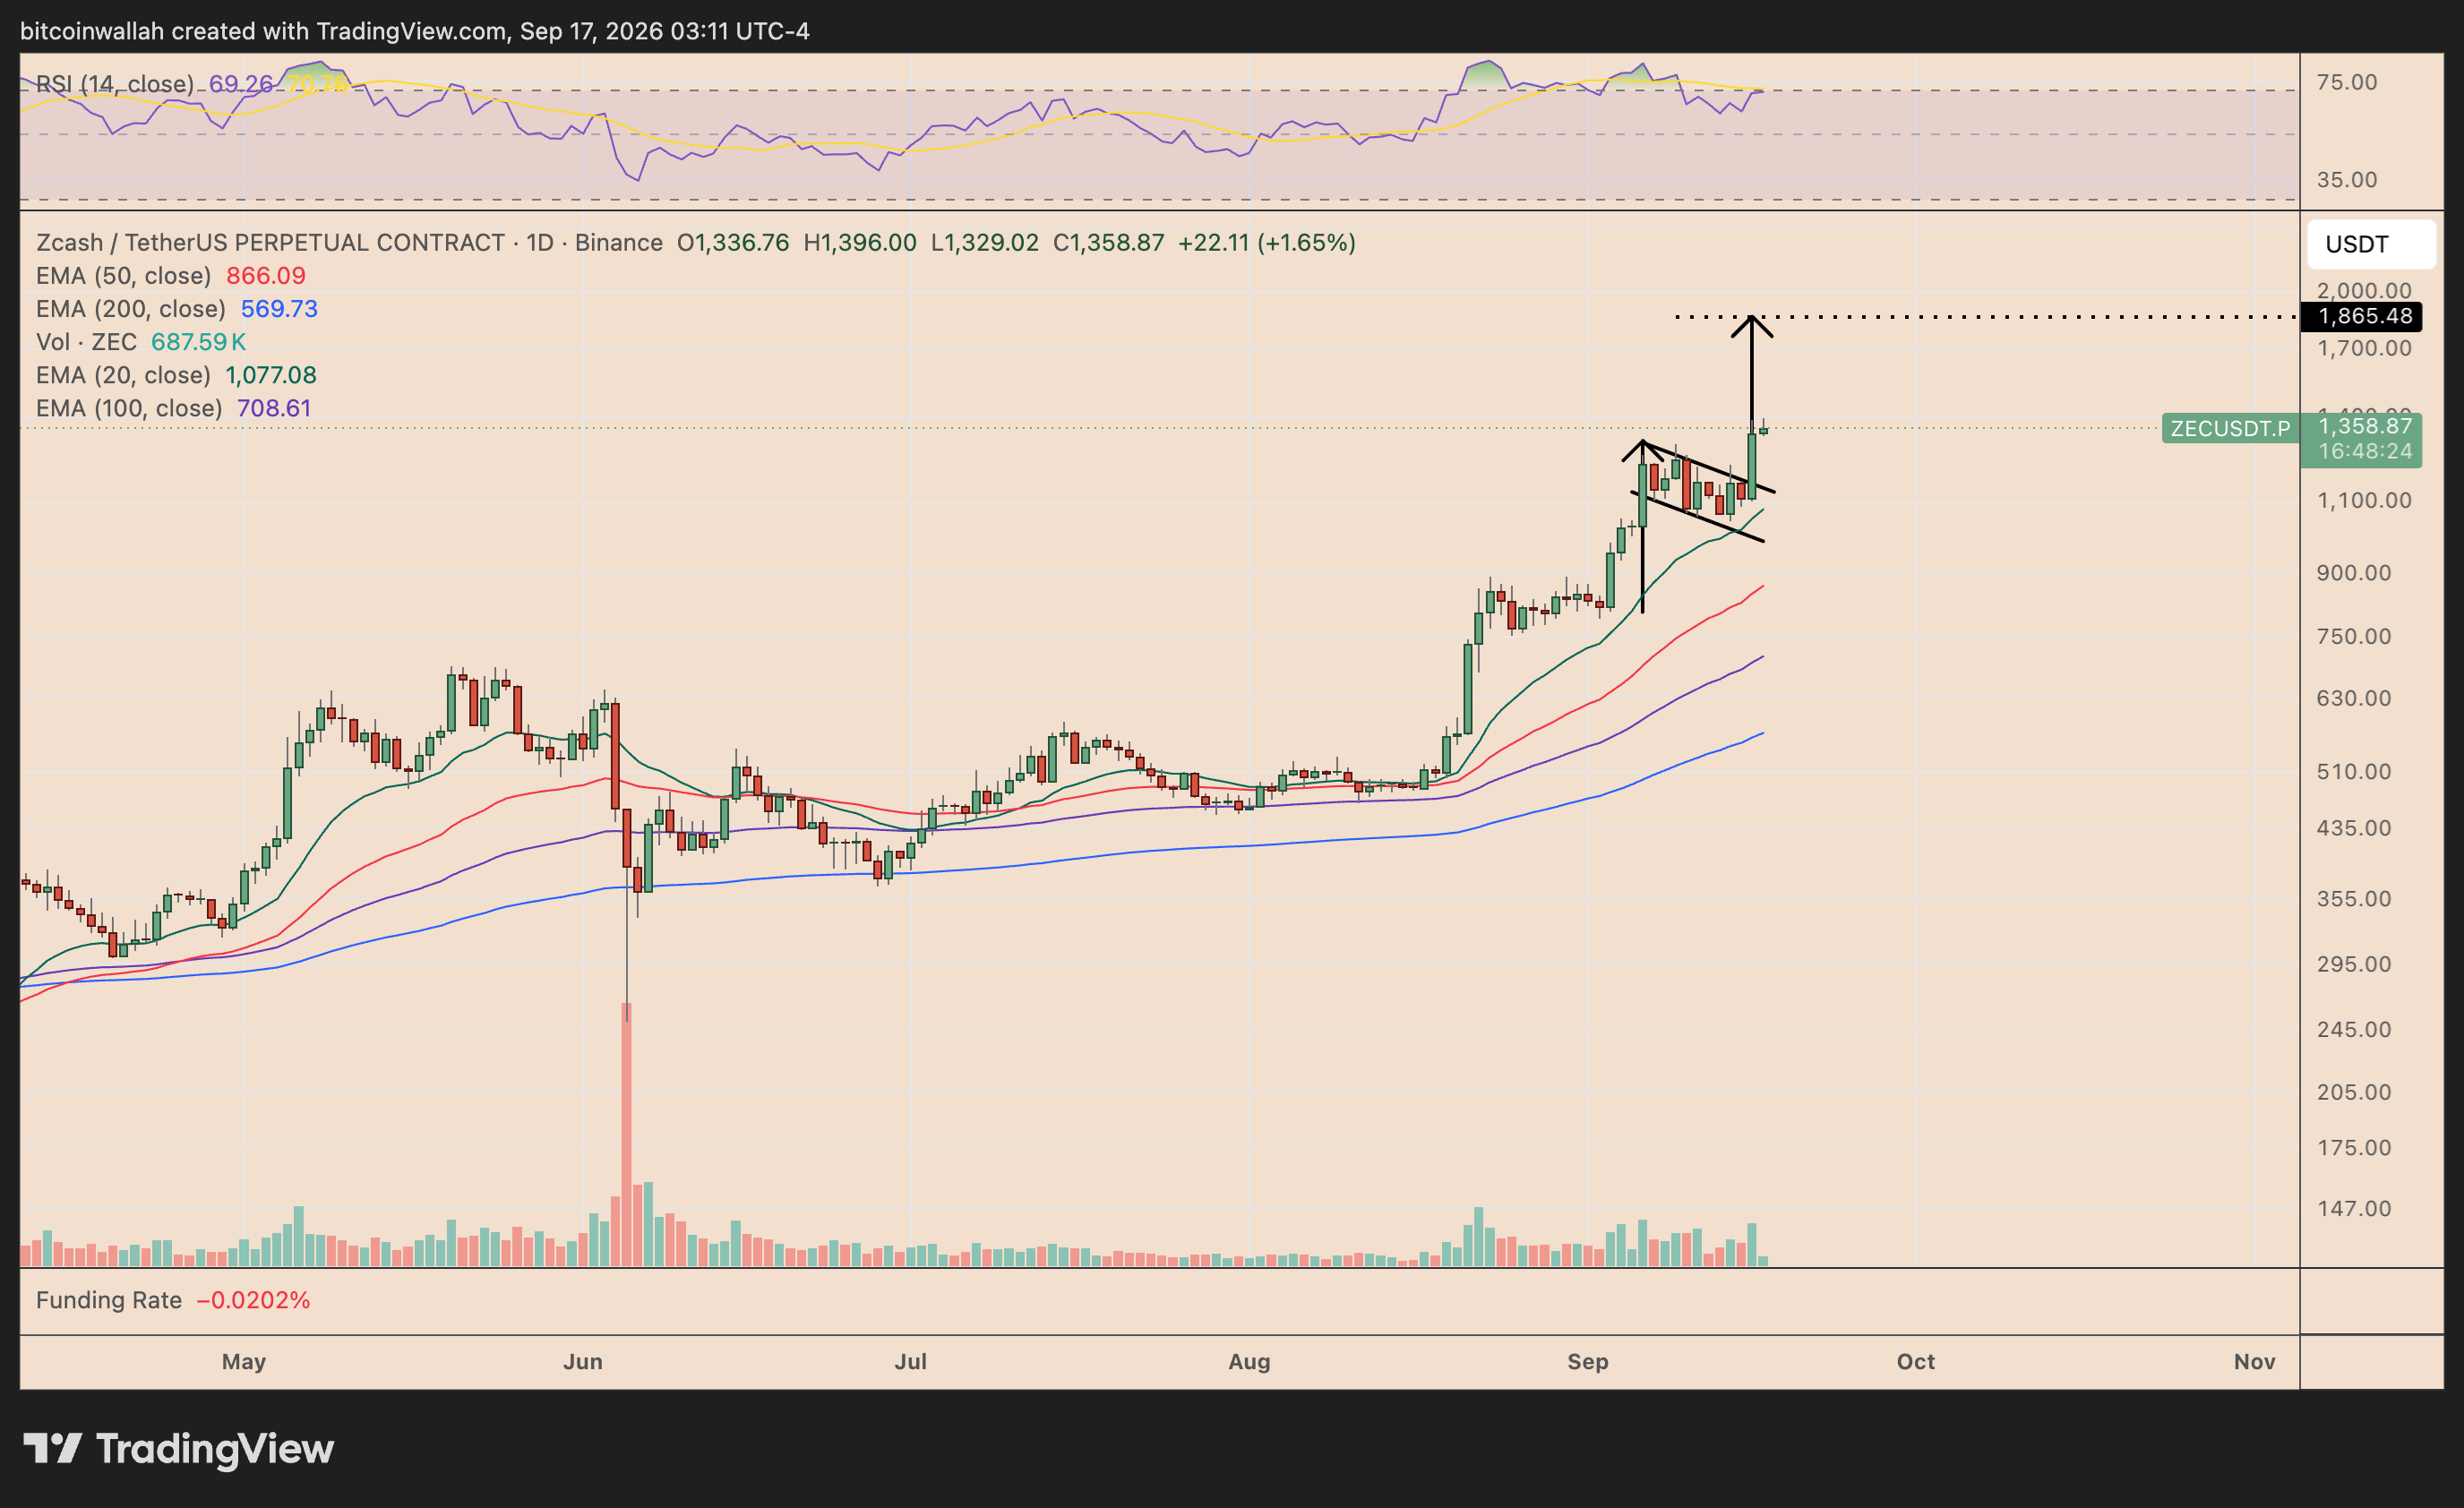
A sustained close above the $1,300-$1,350 area could strengthen the bullish confirmation and open the door toward approximately $1,750-$1,865. That would represent roughly another 30%-37% upside from current levels.
ZEC is also trading comfortably above its major exponential moving averages.
Its 20-day exponential moving average (20-day EMA, green) sits near $1,077, followed by the 50-day EMA (red) around $866, indicating that the short- and medium-term trend remains strongly bullish.
Meanwhile, the daily relative strength index (RSI) stands near 69, just below the conventional overbought threshold of 70. That suggests momentum remains elevated, though the high reading also raises the possibility of short-term volatility or profit-taking.
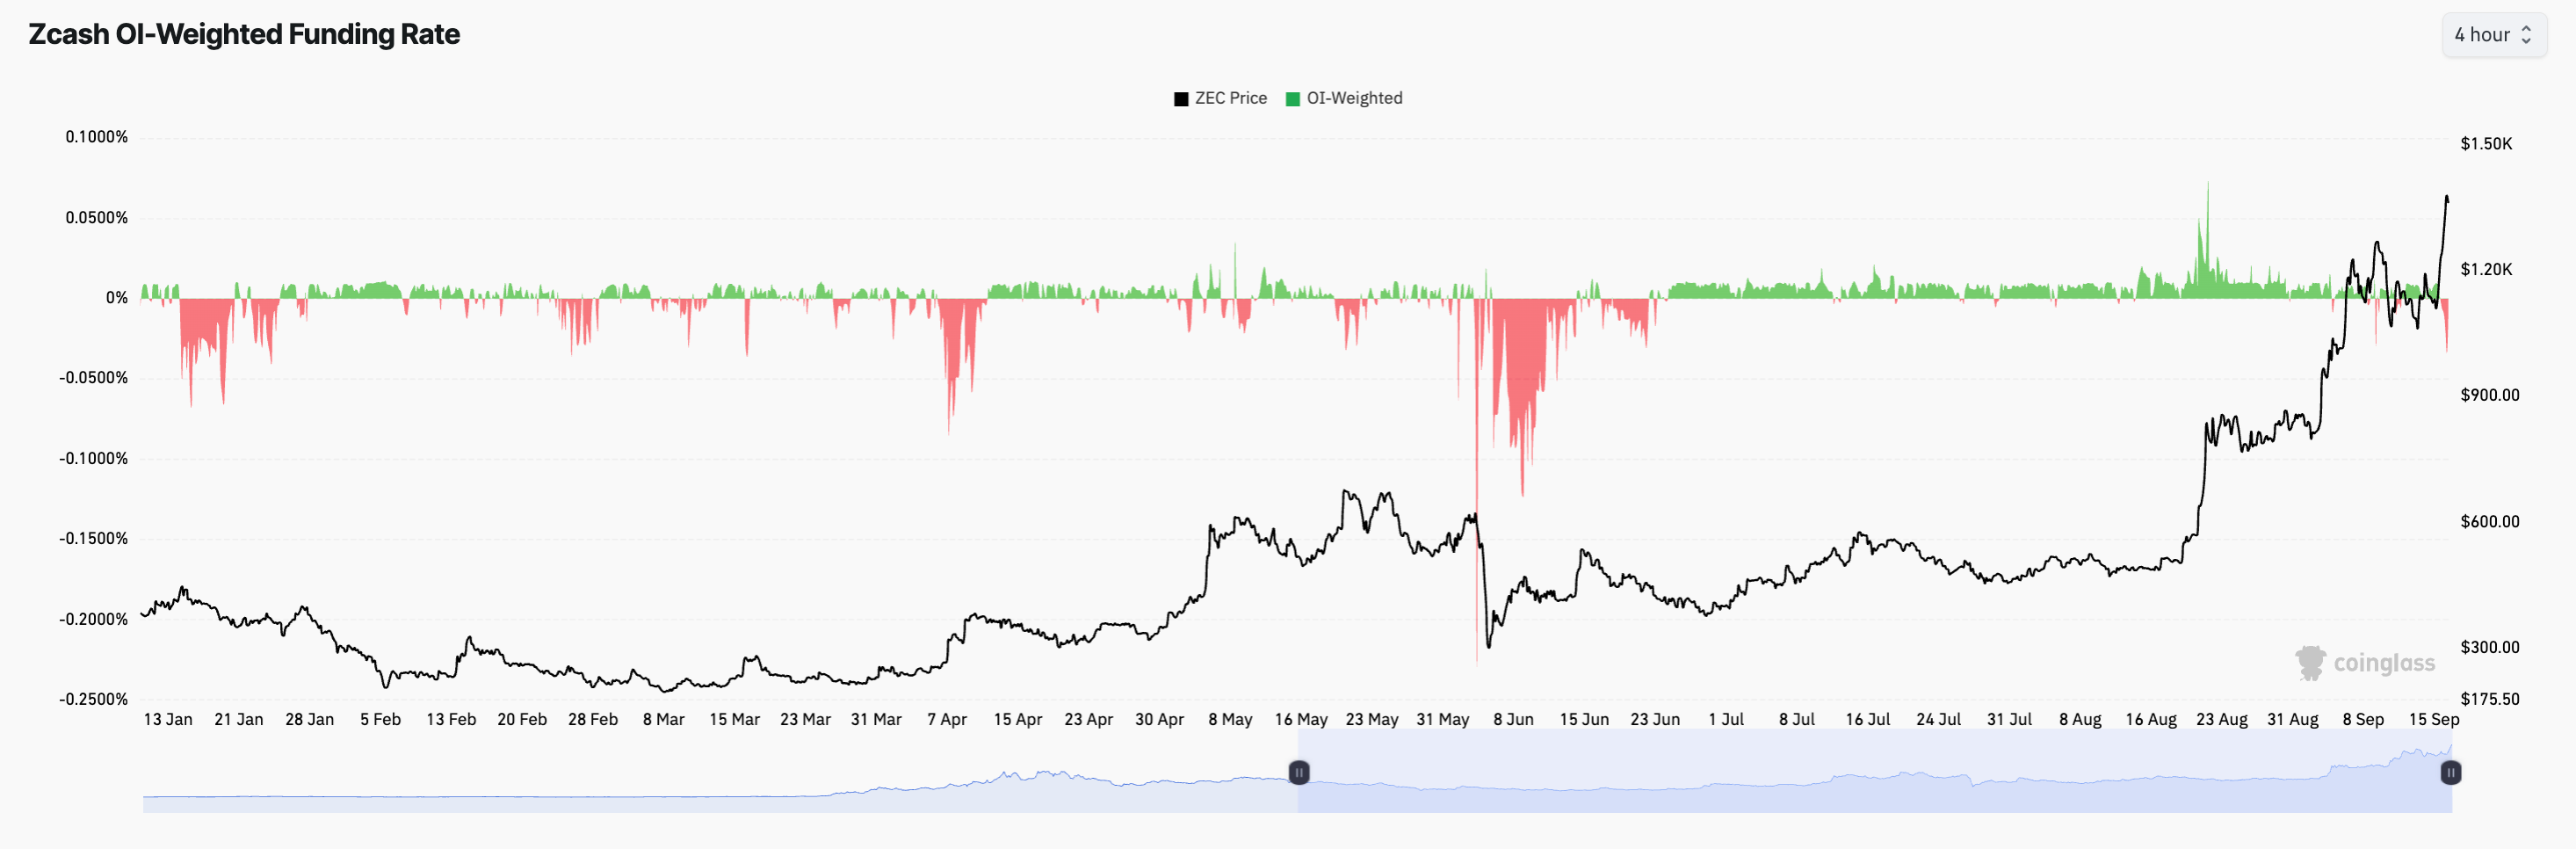
ZEC’s funding rate remains negative at around -0.0202%, despite the price rally. Persistent bearish positioning in the derivatives market could amplify the upside if rising prices force leveraged shorts to close.
ZEC Cup-and-Handle Breakout Targets $2,700
Zcash’s weekly chart adds another bullish layer, with ZEC confirming a breakout from a multi-month cup-and-handle pattern.
The structure began forming after ZEC peaked near $700 in late 2025, followed by a rounded decline toward roughly $180-$200 and a gradual recovery back to the same resistance area. A smaller consolidation beneath $700 subsequently formed the “handle.”
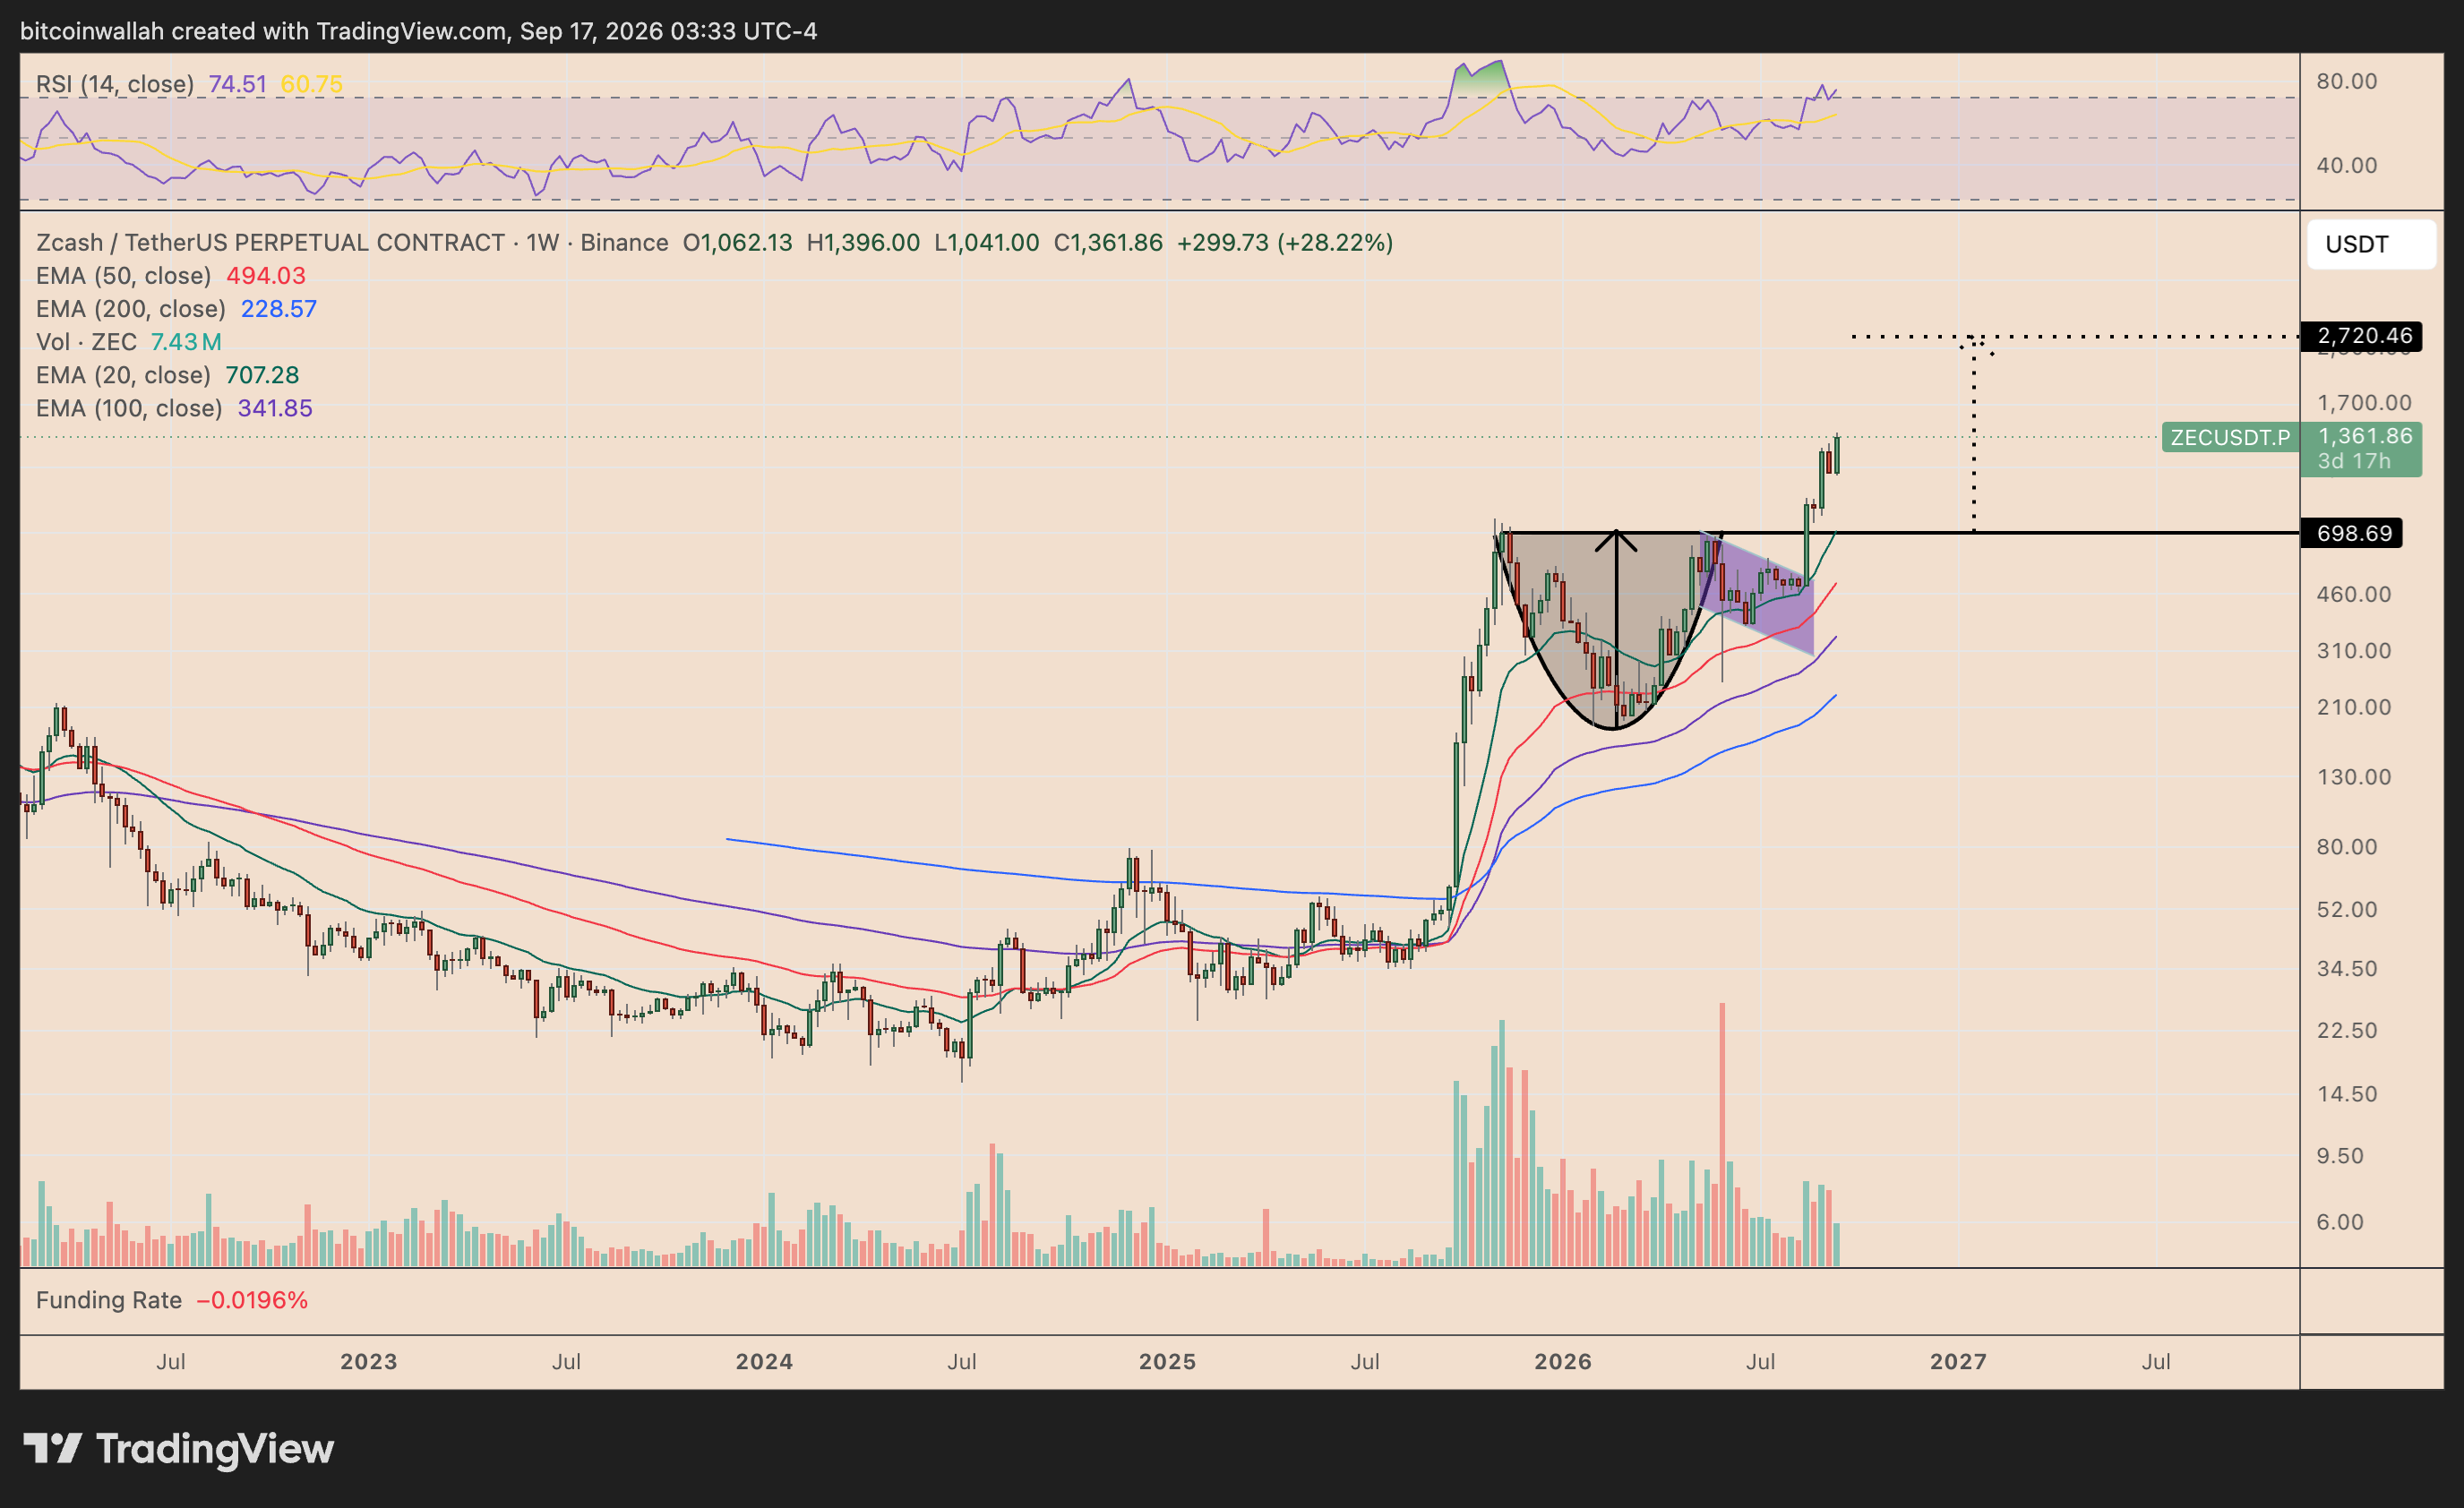
ZEC has now broken decisively above the pattern’s $698-$700 neckline, turning the former resistance zone into potential long-term support.
Based on the cup’s depth on the logarithmic chart, the breakout points toward approximately $2,700-$2,720 as its broader technical target. That would represent nearly 100% upside from ZEC’s current price near $1,360.
However, the weekly RSI has climbed above 74, putting Zcash in overbought territory. That raises the possibility of an interim pullback or consolidation before the larger cup-and-handle target comes into play.