Silver Survives a Hawkish Fed and Bounces
The Fed gave silver bears everything they needed Wednesday and the market did not break. Warsh raised rates, stayed hawkish on inflation, left another hike on the table and watched the dollar rally while yields pushed back toward 5%.
Silver dropped more than $2 from the session high to $62.31 and then stopped going down. Buyers came back overnight and lifted XAGUSD $1.45 off that low, recovering more than half of Wednesday’s $2.63 range. That is not the price action bears were looking for after a hawkish Fed.
At 07:43 GMT Thursday, Spot Silver (XAGUUSD) is trading $64.37, up $1.39 or +2.21%. On Wednesday, Spot Silver settled at $62.99, down $0.70 or -1.10%.

Wednesday’s Selloff Was Sharp but the Follow-Through Never Came
The Fed raised its benchmark rate 25 basis points to 3.75%-4.00%. Unanimous decision. First increase since 2023. The hike was priced. The pressure came from Warsh’s press conference. He said inflation had been too high for too long. Recent data had not shown enough improvement. The economy was stronger and geopolitical tensions had increased since July. Another increase remained on the table.
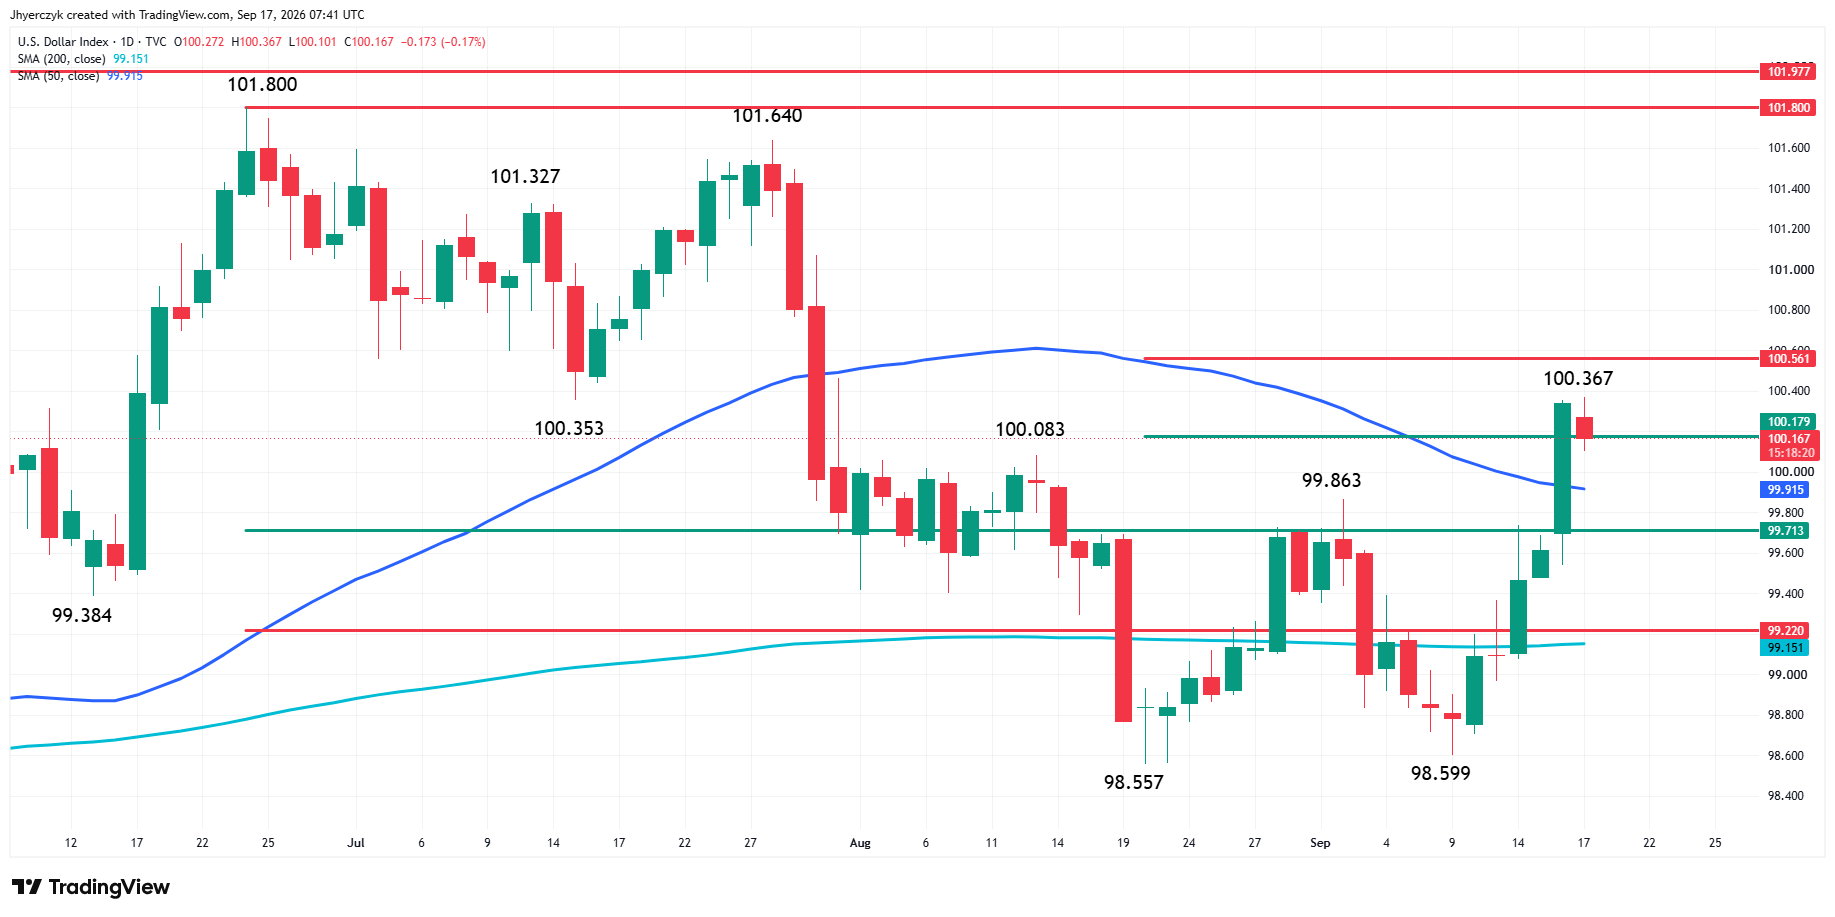
The dollar rallied. The 2-year yield pushed higher. The 10-year moved back toward 5%. XAGUSD dropped from $64.94 to $62.31 in the hours after the announcement. That is a $2.63 range in one session and most of it came on the downside after the statement.
Silver settled at $62.99. Well off the low. The sellers who had the hawkish Fed, the stronger dollar and higher yields behind them could not hold the metal below $63. That failure matters more than the $0.70 lower close.
The 5% Yield Was Not New Information
Silver had already been trading under the threat of a 5% 10-year yield before the Fed ever spoke Wednesday. The metal spent Monday and Tuesday absorbing rising rate expectations, a dollar at two-week highs and yields at 2007 levels. Buyers showed up on every test of the support zone near $63 and defended it.
Silver Price Forecast
Every new Silver analysis as it publishes, today's technical signal and key levels, live price — on one page.
See all Silver forecastsThe Fed made the trade more aggressive. It did not introduce a new one. Warsh reinforced the story silver traders had been dealing with all week. Rates going higher, inflation keeping the Fed on the defensive, the dollar firm. Wednesday’s hike was the confirmation, not the surprise. That is why the selloff produced a spike, not a trend change. The metal had already been pricing the worst case before the worst case arrived.
Thursday’s Bounce Says Sellers Have a Problem
XAGUSD is trading $1.45 above Wednesday’s low with the dollar no longer accelerating and yields backing off their post-Fed levels. Some of the buying is short covering after a $2.63 range day. That is mechanical. But the timing says more than that.
Buyers did not wait for Warsh to turn dovish. He did not. They did not wait for yields to collapse. They have not. They stepped in while the rate picture was still hostile and pushed the metal back above $63 overnight. That is not positioning for a policy reversal. That is demand underneath a market where the bearish case just got louder and prices did not respond.
Part of the floor comes from the same inflation Warsh is fighting. Persistent price pressure and the geopolitical risk driving oil above $100 keep a portion of silver’s longer-term investment bid alive. Higher rates create the ceiling. Inflation and supply risk create the floor. Neither side has taken control and Wednesday’s session proved both forces are real.
Daily Spot Silver (XAGUSD) Technical Analysis
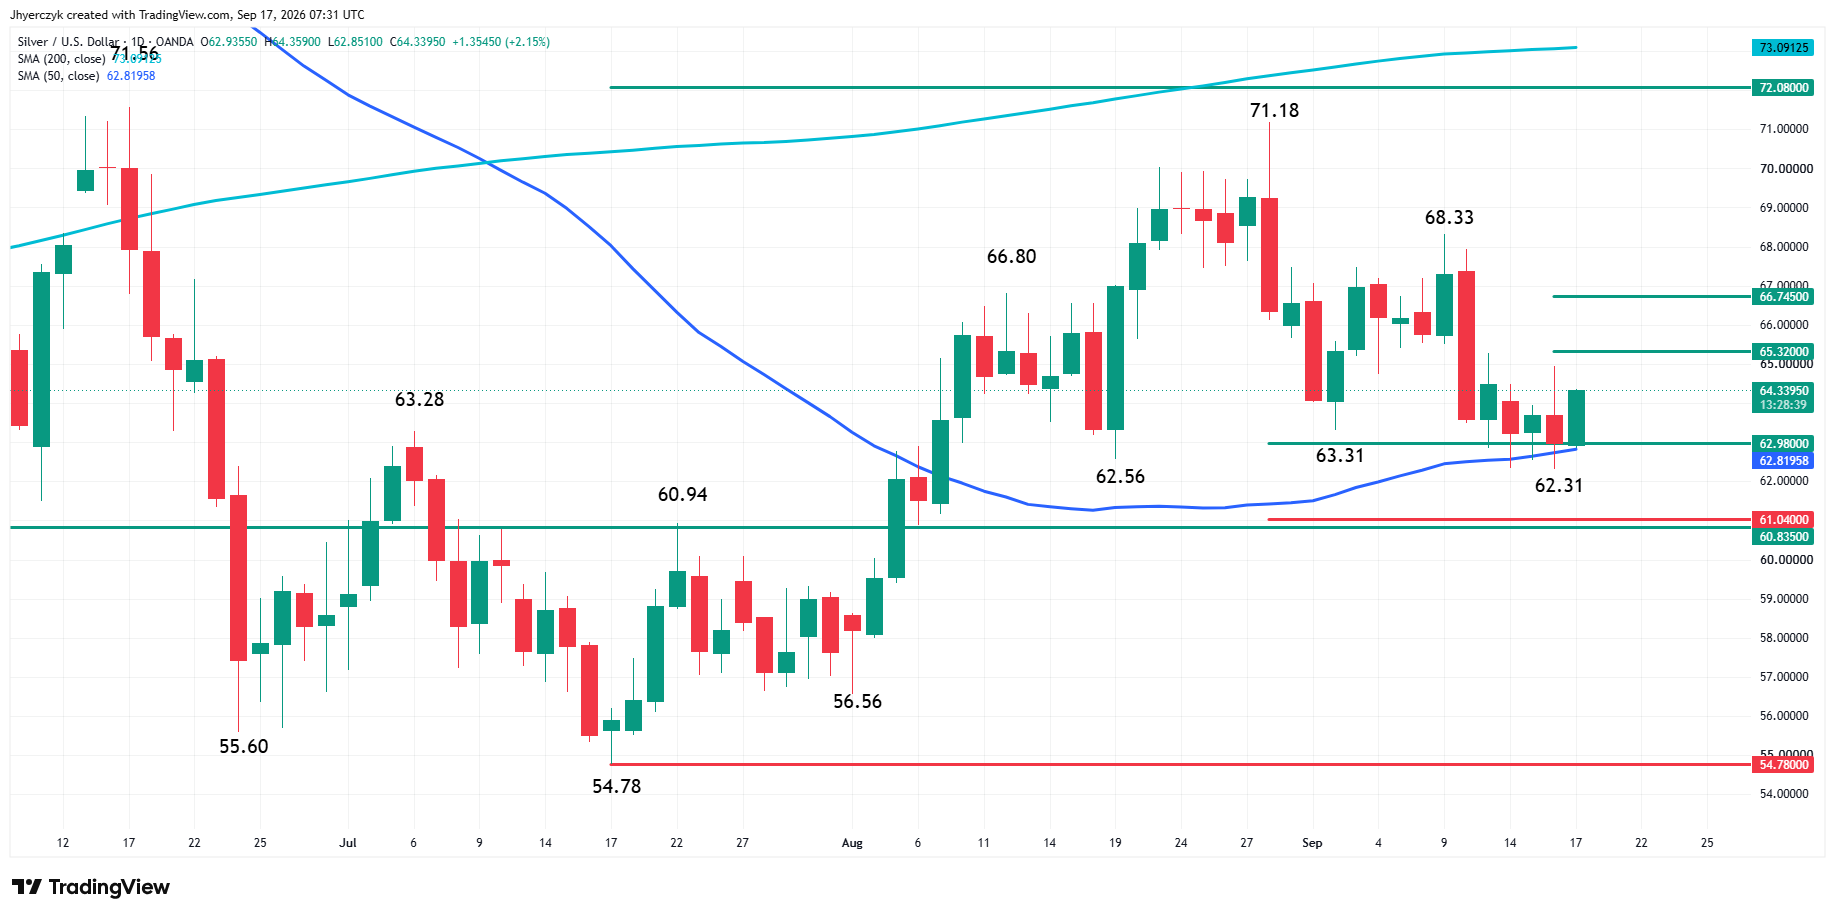
Spot Silver is edging higher early Thursday after posting its fourth straight successful test of the 50-day moving average at $62.81. The main trend is down according to the daily swing chart. For the second time this week, sellers reaffirmed the downtrend with a lower low at $62.31, however, the lack of follow-through pressure may have triggered today’s early short-covering rally.
A trade through $62.31 will once again reaffirm the downtrend. A trade through $68.33 will change the main trend to up.
The minor trend is also down. A trade through the minor top at $64.94 will change the minor trend to up and shift momentum to the upside.
The intermediate range is $54.78 to $71.18. Its retracement zone is $62.98 to $61.04. This week’s lows have all tested this zone successfully. The 50% level at $62.98 forms a support cluster with the 50-day moving average at $62.81. Thursday’s early low is $62.85.
Additional levels to watch include long-term 50% support at $60.835. On the upside, 50% levels at $65.32 and $66.75 are potential resistance.
What to Watch
Warsh answered his question Wednesday. The Fed is still raising rates and still worried about inflation. Now silver has to answer the other one. Can sellers actually break this market with that information? Four tests of the 50-day moving average this week and four failures. A hawkish Fed, a stronger dollar and yields near 5% and the low at $62.31 still held. If buyers keep defending the downside after absorbing all of that, the question stops being whether silver breaks lower and starts being what it would take to knock out the bid entirely.
The bias leans bearish with the main trend down on the daily swing chart and this week’s lower lows reaffirming the direction. The bearish case has a credibility problem though. The 50-day moving average at $62.81 and the retracement zone at $62.98 to $61.04 have stopped every selloff this week including the post-Fed flush to $62.31.
A push through the minor top at $64.94 flips the minor trend to up and puts resistance at $65.32 to $66.75 in play. Overcoming $66.75 gives buyers a clean path toward $68.33 and a trend change. On the downside, a break through $62.31 would finally produce the follow-through sellers have been unable to generate and opens the door to $61.04 and long-term support at $60.835.
More Information in our Economic Calendar.