


Bearish Pressure Breaks Key Support
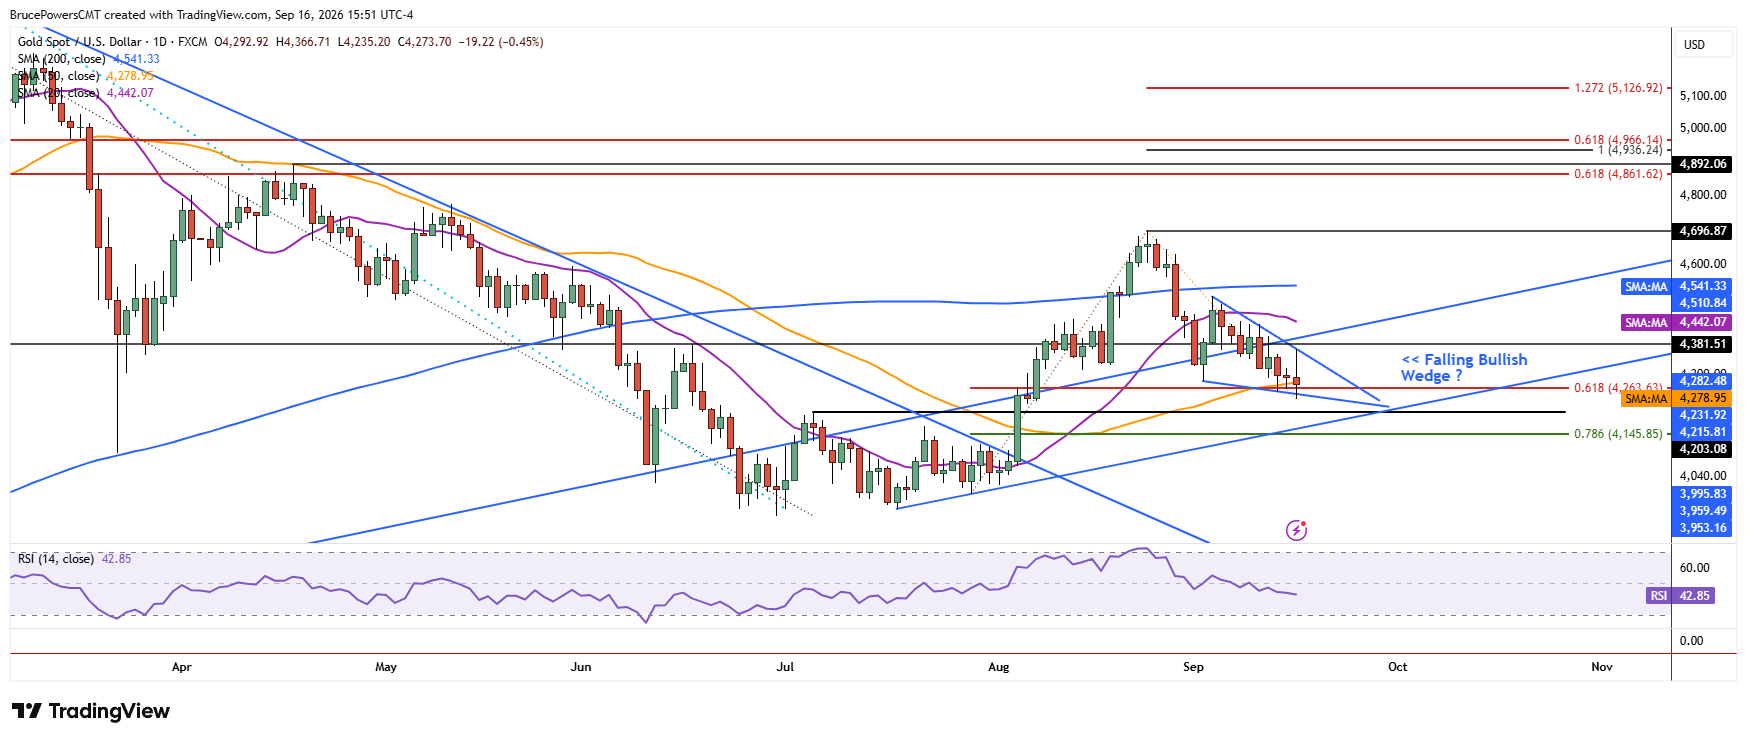
Gold is on track to complete a bearish outside day on Wednesday, following the U.S. Federal Reserve’s decision to raise interest rates by 0.25%. The 50-day moving average, which had held as support for the prior two days, failed, with gold reaching a new corrective low of $4,235 at the time of writing. Trading continues near the low of the day, with gold set to close below the 50-day moving average for the first time since an upside breakout of the downtrend line triggered on August 5.

WTI and Brent Forecast: Oil Pulls Back as Supply Fears Ease
Forecasts · Brent Oil · 2 min readFalling Wedge Keeps Bulls in Play
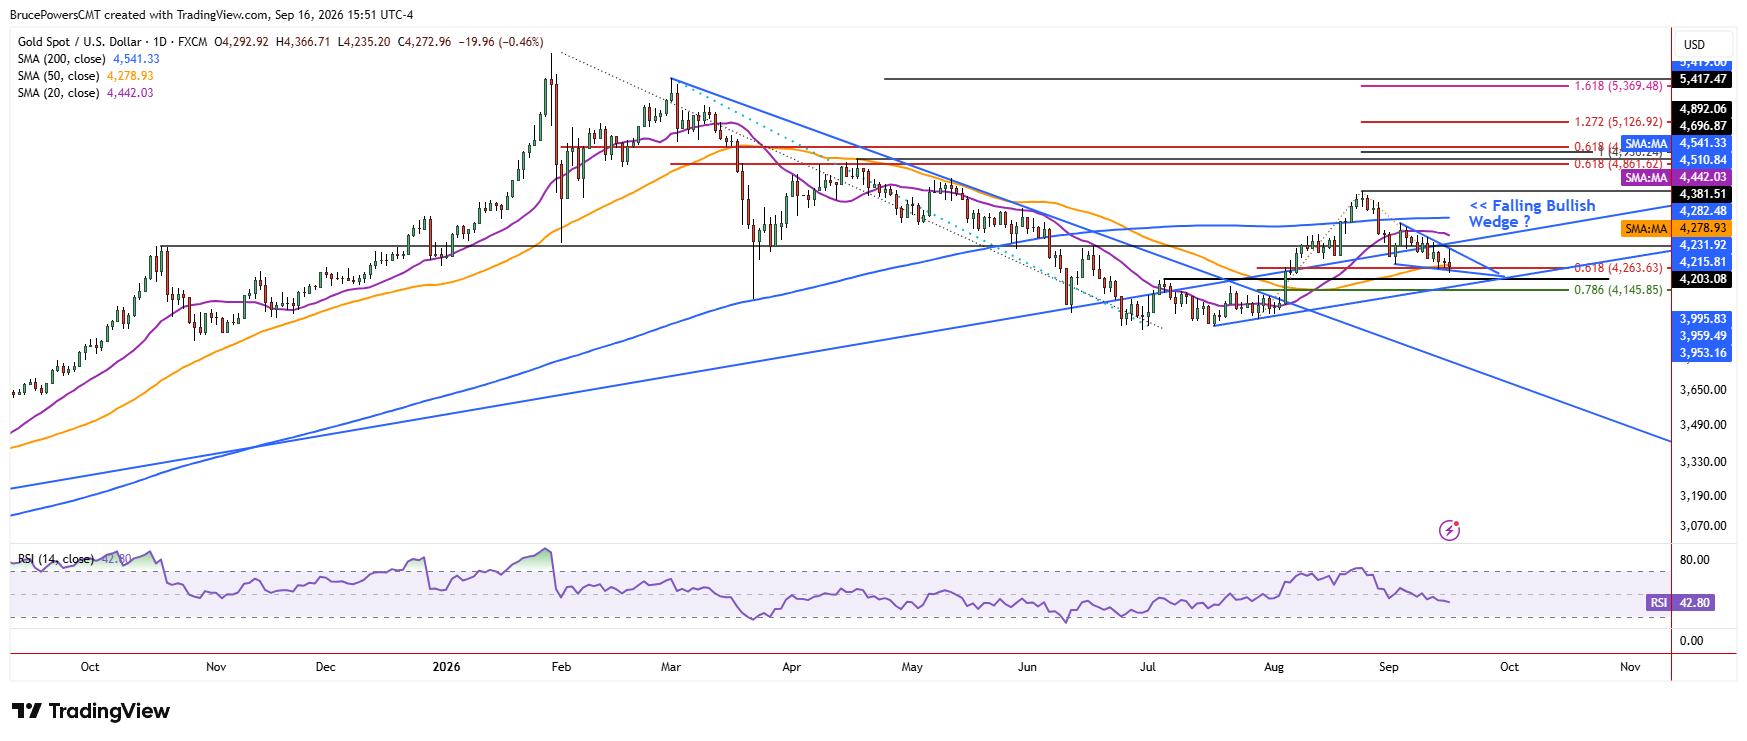
Although this short-term bearish behavior shows continued downward pressure on gold, which may lead to a test of support at lower levels, a potential bullish pattern has also formed. A small falling bullish wedge pattern has formed, which reflects slowing bearish momentum. The potential bullish pattern may remain relevant if price continues to trade inside the boundaries of the formation. In this instance, the wedge is a trend continuation pattern rather than a reversal pattern, which is where it may also be seen.
Gold Price Forecast
Every new Gold analysis as it publishes, today's technical signal and key levels, live price — on one page.
See all Gold forecasts$4,203- and $4,146-Mark Lower Support
There are two lower potential support levels that may be tested if sellers remain in control, signaled by a decisive decline below Wednesday’s low. A lower swing high and top of a bottom consolidation range is at $4,203. That was a key level that provided a bullish reversal signal of the prior declining trend. Then there is the 78.6% Fibonacci retracement of the prior advance at $4,146.
$4,367 Holds Breakout Trigger
Given the current formation of the falling wedge, an upside breakout is confirmed on a rally above Wednesday’s high of $4,367. As the wedge continues to form, other structure resistance levels may provide a tighter signal nearer to the upper boundary line of the pattern. If an upside breakout occurs and it sustained, the recent lower swing high of $4,511 is the first upside target, followed by the more significant swing high at $4,697.


