Deep Correction Sets Up Recovery
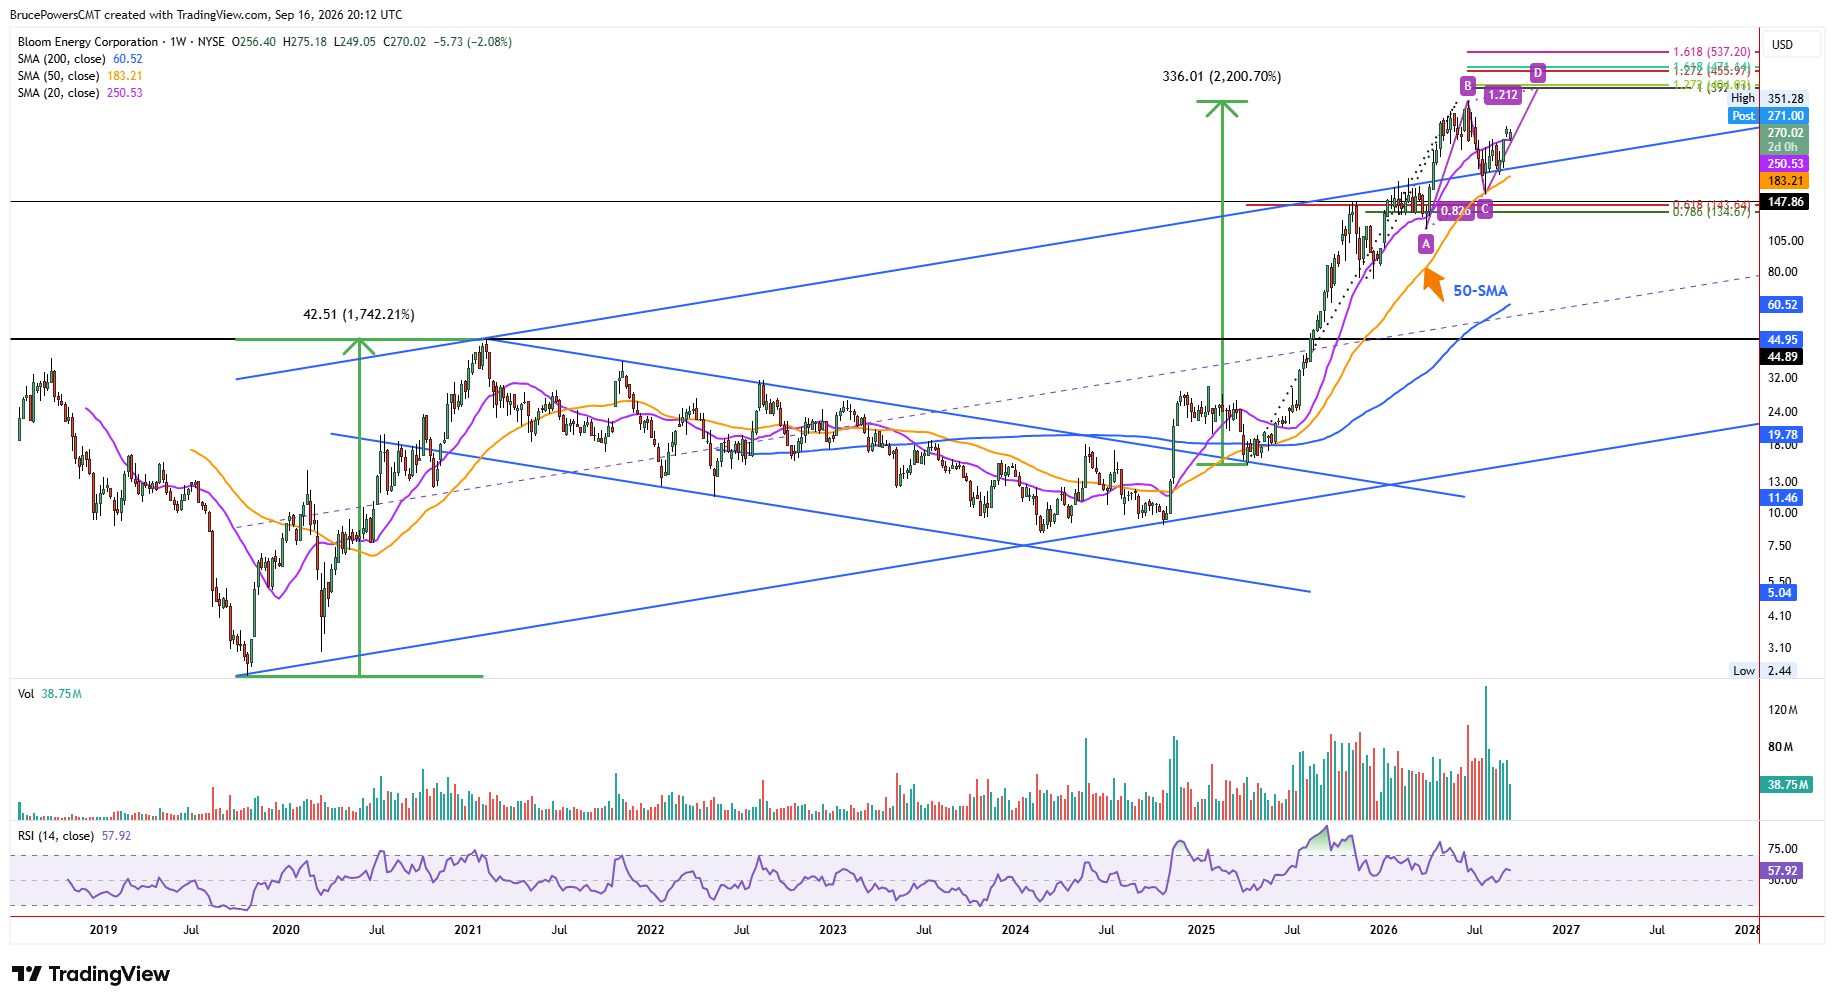
Bloom Energy Corporation (BE) has strengthened its technical outlook following a deep corrective decline, as the stock continues to benefit from demand for onsite power generation for AI data centers. The company builds solid-oxide fuel-cell systems for onsite power generation. Its stock established a corrective low of $157.33 in late July, thereby completing a 78.6% Fibonacci retracement of the prior advance from the June peak. That peak reached $351.28 in late June, with the corrective low coming after the release of Q2 fiscal 2026 earnings following the market close on July 28.

Moving-Average Support Reinforces Structure
Support for the broader bullish trend was reinforced by the 200-day moving average, which was quickly reclaimed after BE traded below it for less than two days. Also, the 50-week moving average was successfully tested as support during the decline for the first time since it was reclaimed in May 2025. Given the confluence of support indicators, along with the subsequent bullish reaction, the July corrective low appears increasingly likely to have marked the end of the decline, leaving further upside as the primary direction if support continues to hold.
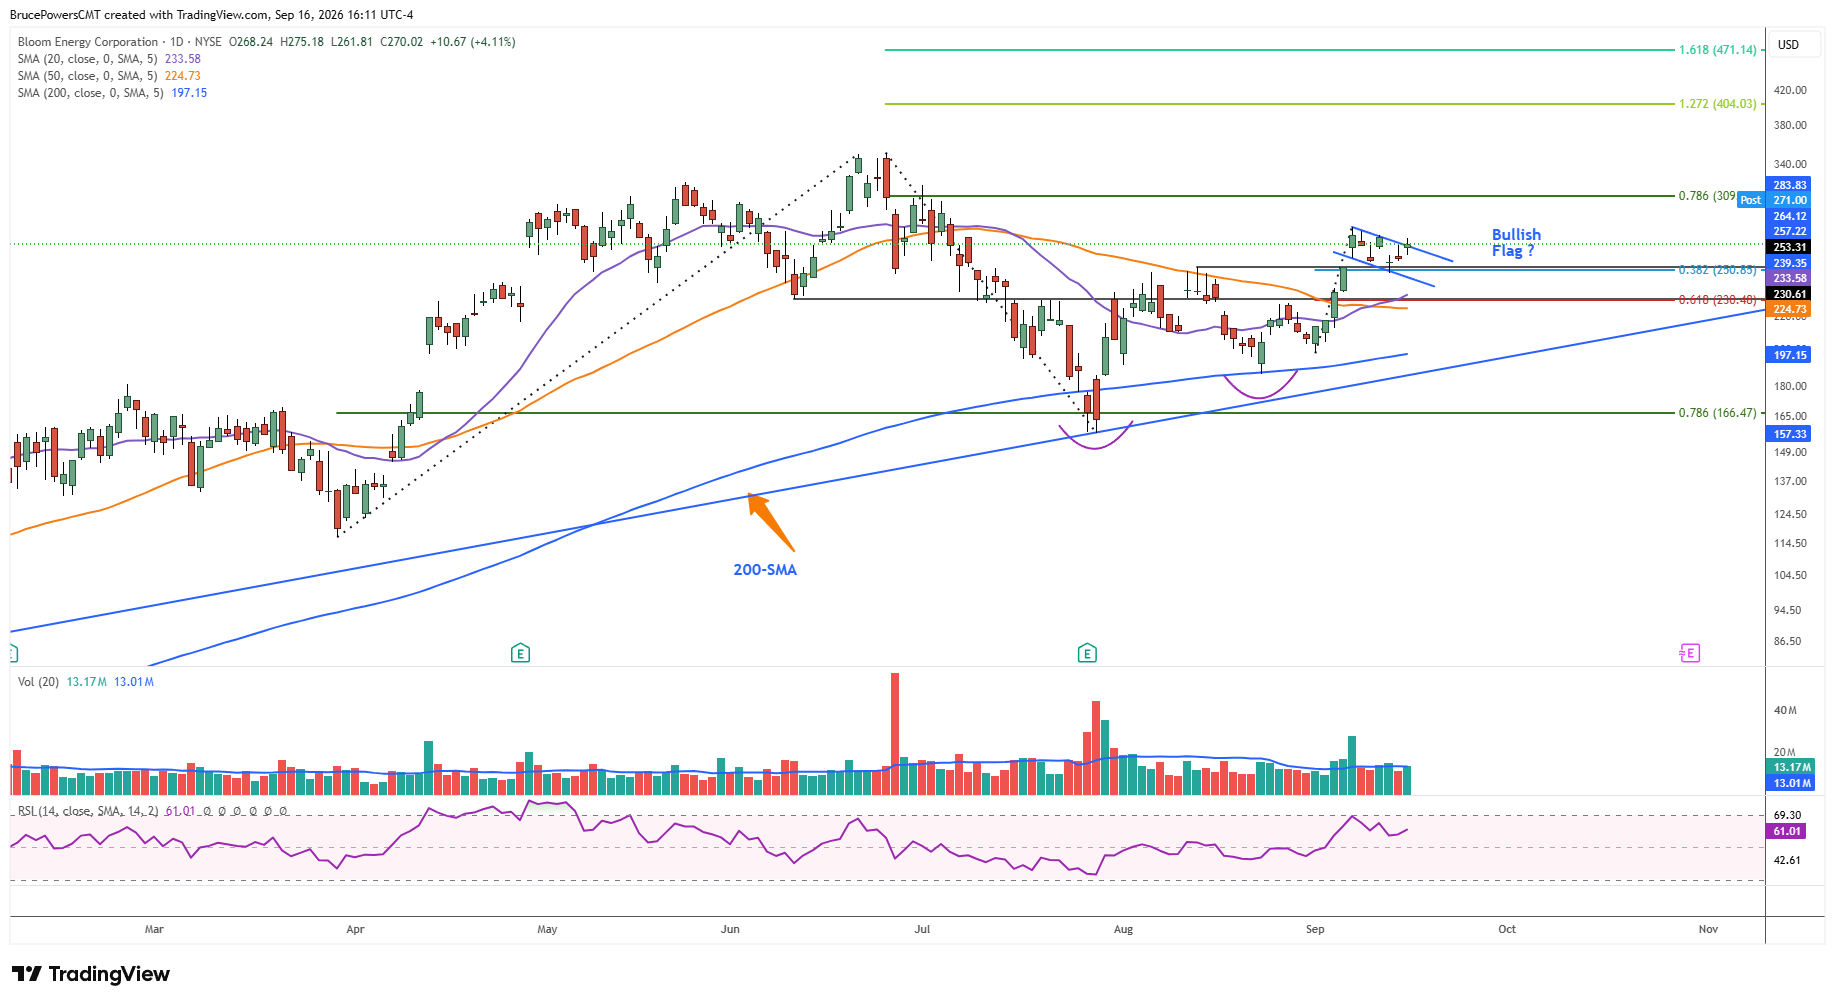
Strength followed the July low, resulting in a swing high of $253.31 in August and a successful test of resistance at the 50-day moving average. A pullback followed, leading to a higher swing low at $185.93 in August and another test of support at the 200-day moving average. The subsequent advance triggered a bullish continuation signal last week with a rally above the August high to a new high of $283.83 on September 8. During that advance, strength was reinforced by a reclaim of the 20-week moving average for the first time since mid-July.
Flag Formation Tests Recent Momentum
Since the new high last week, BE has consolidated in a tight range and completed a retracement to the 38.2% Fibonacci level, while establishing a higher swing low of $249.05 on Monday. A small potential bullish flag pattern has formed, which may evolve into a larger consolidation pattern before an upside breakout confirms continuation of the advance that began from the lower swing high of $197.50 in early September.
Nonetheless, if a deeper pullback occurs instead, key support is near the 50-day moving average at $224.65 and the 61.8% Fibonacci retracement of the prior advance at $230.48. Holding those support levels would help preserve the higher-low structure that has developed since July and keep the broader bullish setup intact.
If you’d like to know more about technical analysis and how traders use it, please visit our educational area.