AMZN Technical Analysis
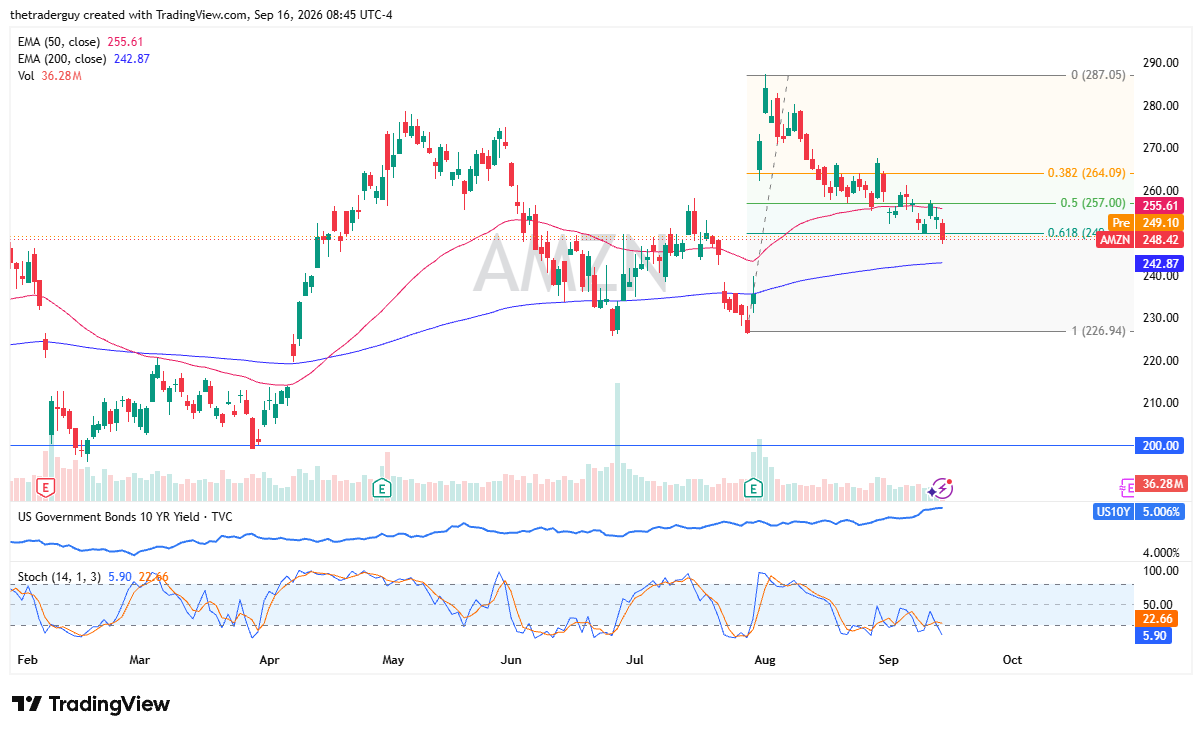
The pre-market for Amazon looks a bit bullish, although I wouldn’t call it overly bullish. We are in an area that should be interesting for technical traders, though, as the last earnings call produced a massive gap and we find ourselves at the 61.8% Fibonacci retracement level.
We are getting close to an oversold condition in the stochastic oscillator, and the 10-year yield is now at 5% again, so that has its own part to play here.
I do think we have a situation where traders continue to look at this as a potential value play, but it is also going to be heavily influenced by the U.S. consumer and how it is feeling. Interest rates rising and inflation rising are not good things, but so far it looks like we are at least finding some type of support.

WMT Technical Analysis
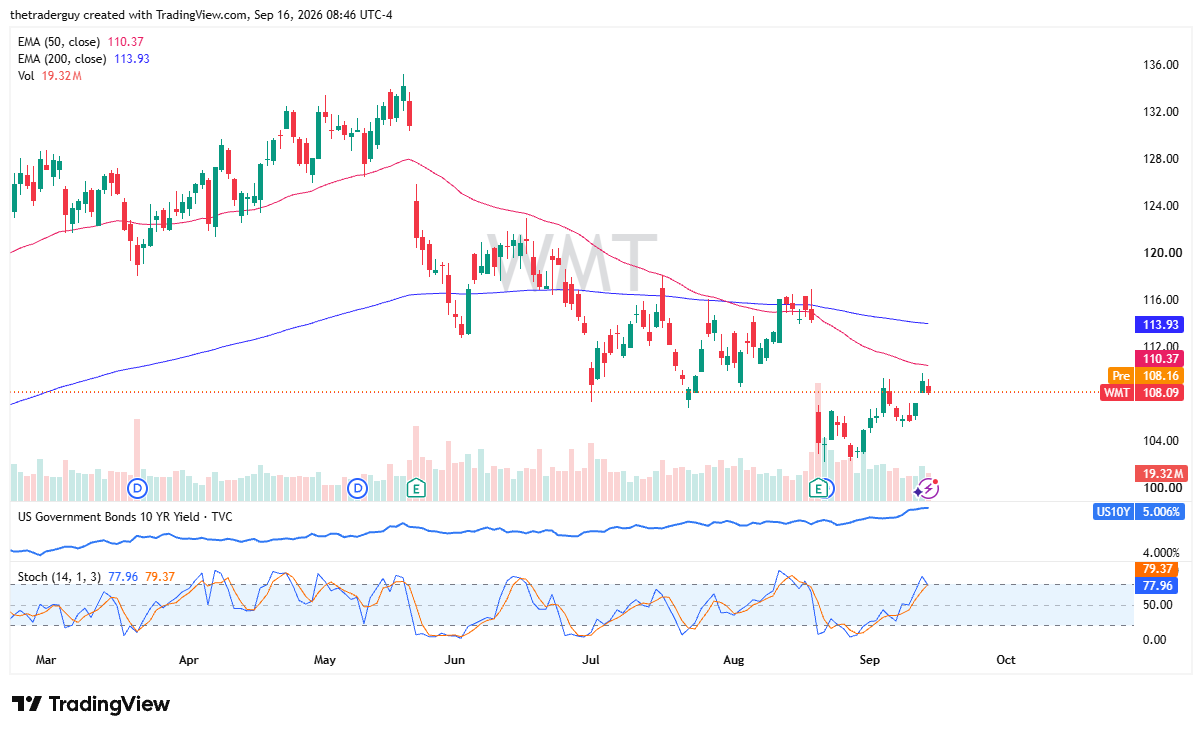
Walmart is doing very little in pre-market trading. It is currently finding the 50-day EMA as a potential barrier, and as a result, it might be worth looking at this through the prism of whether or not we can get above there. We are in the overbought condition in the stochastic oscillator, so maybe a little bit more consolidation. That would not be overly surprising because after all, most of the day is going to be waiting around for the Federal Reserve interest rate decision, and perhaps more important than that will be the press conference.
TGT Technical Analysis
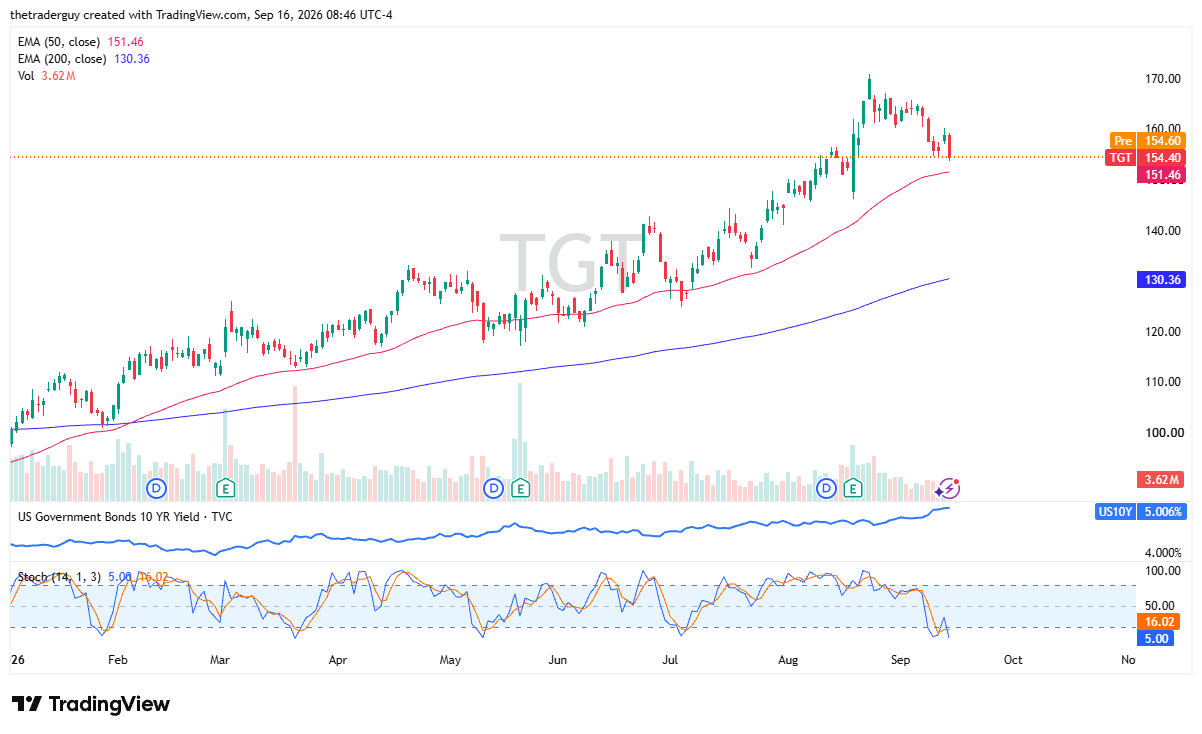
Target looks as if it is going to basically open up where it closed during the previous session, which was pretty ugly for Target. We are sitting just above the 50-day EMA, and it is in a nice uptrend. We are oversold in the stochastic oscillator now, so I’ll be looking for some type of bounce.
Hopefully, we get some type of bounce near the 50-day EMA. Then it becomes a technical play. It’s an uptrend; I have no interest in shorting it, and so far this year it has performed fairly well. Ultimately, this is just a hopefully nice continuation play waiting to happen here in a very strong retailer in America.
If you’d like to know more about technical analysis and how traders use it, please visit our educational area.