NASDAQ 100 Technical Analysis
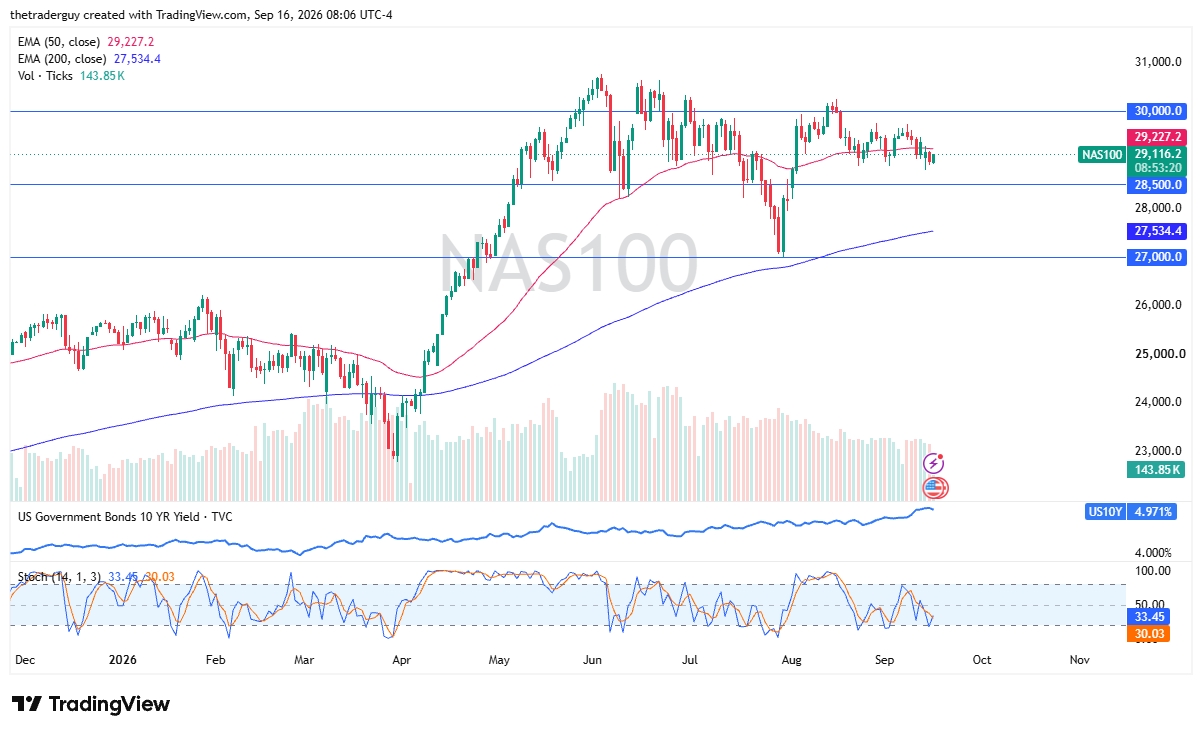
The Nasdaq 100 has rallied slightly to show signs of life as we head toward that crucial Federal Reserve interest rate decision later today. A hike of 25 basis points is expected. This is perhaps the market coming to terms with the new reality as we hold the consolidation.
The question will be whether or not Kevin Warsh sounds extraordinarily hawkish during this press conference, or if it is a situation where it is one and done. I think that probably comes into play here as well. Rates are backing off the 5% level in the 10-year at the moment, at least, but it is worth noting that the market has been extraordinarily resilient.

The Dow Jones 30 Technical Analysis
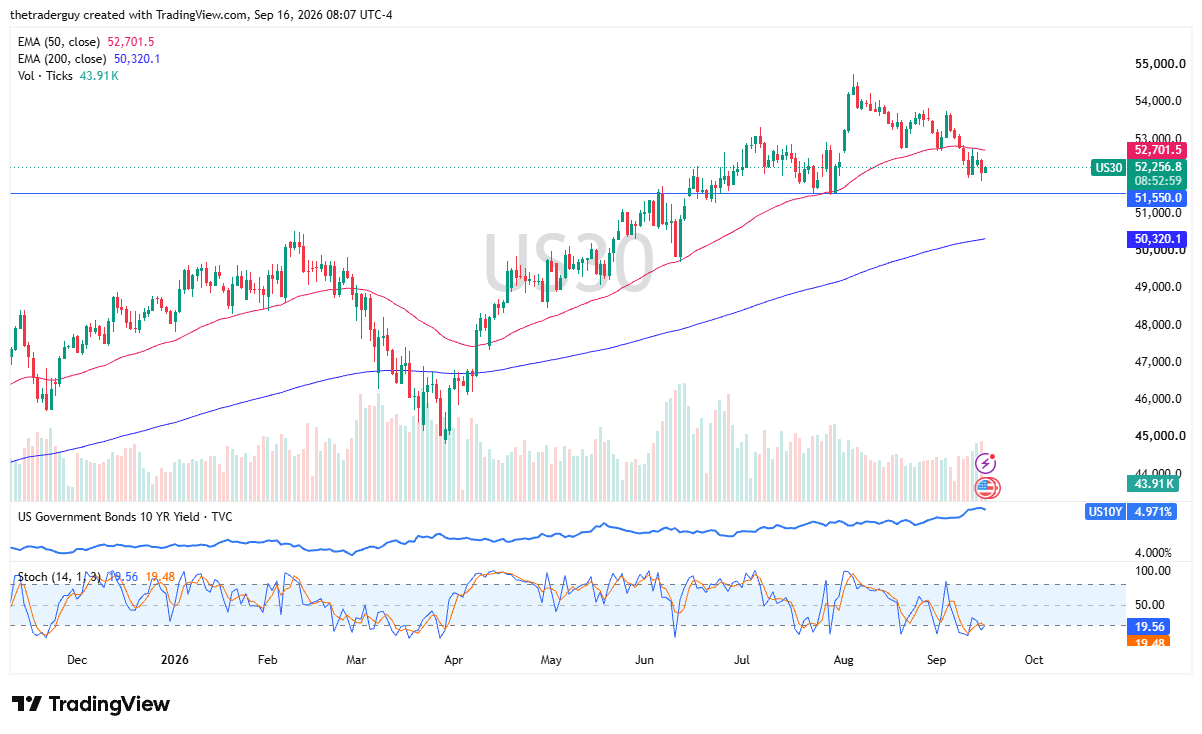
The Dow Jones 30 is rising a bit in the early part of the session as well. It is in the oversold part of the stochastic oscillator. It is kind of a messy look for the stochastic oscillator at the moment, but it is worth noting that the area right around 52,250 has been important and so far seems to be holding up. The 50-day EMA near the 52,700 level offers pretty significant resistance, so it could be worth watching.
S&P 500 Price Forecast
Every new S&P 500 analysis as it publishes, today's technical signal and key levels, live price — on one page.
See all S&P 500 forecastsS&P 500 Technical Analysis
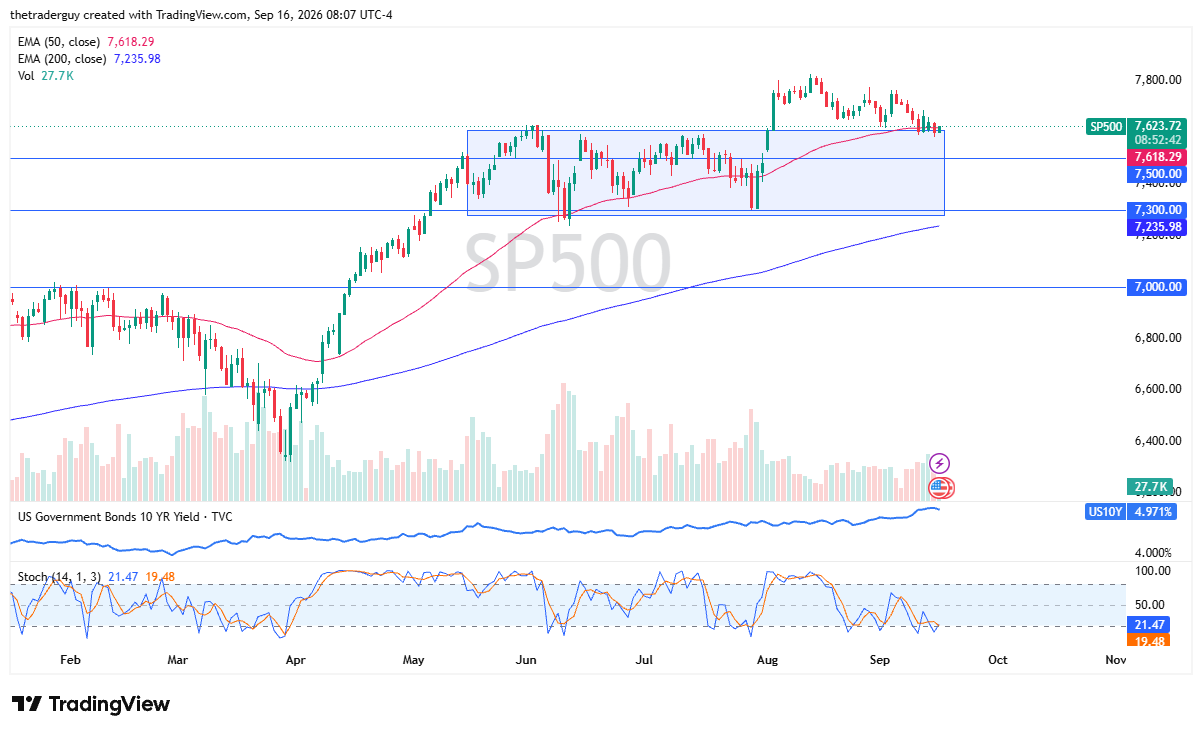
The S&P 500 continues to hang around the 7,600 level. That is an area that had previously been significant resistance and now is offering a significant amount of support over the last 4 or 5 trading sessions. We also have the 50-day EMA there as well. So, a bounce from here and a recovery just means more consolidation.
It will be interesting to watch how this plays out during that press conference. It could be a volatile and bumpy session, but ultimately, the stock market has been rather resilient. The earnings calendar treated us fairly well, and the resiliency of the U.S. economy continues.
If you’d like to know more about technical analysis and how traders use it, please visit our educational area.