
Have you ever wondered why a healthy trend suddenly stalls, moves back against you a little bit, and then resumes right where it left off, as if the market was simply taking a breath on its way higher?
That’s not chance, and it’s certainly not random.
In general, trends are anything but straight-line. Any trend worth taking seriously is typically composed of multiple surges and pauses, abrupt moves and then smaller moves back, periods of moving sideways, or even a brief counter-trend move. These minor moves in the opposite direction of the primary trend, which in technical lingo are called “retracements,” are not a flaw of the trend but an indication of how supply and demand behave.
One of the most interesting characteristics of retracements is that they occur in recognizable, repeating patterns in most markets, on almost all timeframes, across almost all asset types. 38.2 percent retracements. 61.8 percent retracements. They appear again and again, in equity, currency, commodity, and even cryptocurrency markets. That’s not to suggest any mystical powers at work here but simply the recognition that the underlying human dynamic that makes any market work is the same.
Let’s dive into the discussion of what actually is taking place, and how Fibonacci retracements can form a practical tool set for reading these moves.

Why the Market Retraces in the First Place
To get a grip on retracement ratio analysis, it is useful to get an idea of why retracements happen at all.
A few things are usually occurring:
- Profit-taking is often at play. Traders who are already long will sell as they see their trades in a large profit, putting upward counter-trend pressure on price. This also happens in a short trade as traders take profit.
- New traders are waiting for a better price. Buyers in a long trade or sellers in a short will often be willing to buy or sell only at lower prices, causing a brief pause as they wait to see a pullback.
- A re-balancing of supply/demand occurs. When an initial impulsive move occurs, prices tend to become overstretched. Pullbacks in the opposite direction allow market participants to step in and help bring equilibrium back to the relationship between supply and demand.
The important point to understand is that a retracement sends a signal back to market participants as a feedback loop. After a substantial move in a particular direction, the retracement serves to help market players determine if the prior imbalance is still in effect.
One way I like to frame these retracements is the following:
- Shallow retracements are a strong indication that the primary trend is in control.
- Moderate retracements are a temporary balance and signal a deeper uncertainty between buyers and sellers.
- Deeper retracements indicate a growing trend that will likely not reverse, but is facing some opposition.
By using these retracements as a feedback mechanism, it is possible for a trader to determine how sound a particular trend is and how deep any pullbacks may be. When the primary trend is pulling back from retracements of the smaller variety, you can assume that it is the prevailing trend that is in control and that trend should continue to progress. When a particular trend pulls back to the deeper variety of retracement levels and then resumes to higher (or lower) prices, it may still continue, but with more potential volatility and a higher probability that it may fail to continue.
What Are Fibonacci Ratios Actually Measuring?
Fibonacci ratio analysis determines a relative retracement in a market that has occurred over a prior directional move. The focus is on the proportion, not the arithmetic.
Begin with the impulse move. This is a clear advance in price in an uptrend or a clear decline in price in a downtrend. In an uptrend, you measure the impulse from swing low to swing high. In a downtrend, you measure from swing high to swing low. The ratios then determine support or resistance levels based on how far price will retrace a portion of the impulse.
I know what you’re asking. Isn’t this just me drawing a line on the chart and hoping price respects it?
That’s part of the reason these levels are popular. Discretionary traders, algorithms, desks, these are some of the many people who also look at these levels. That’s a large part of why they work.
I have to say here: these aren’t price levels. Markets don’t respect exact prices. Fibonacci retracements can provide you areas where supply and demand may begin to favor. Use these as a framework rather than a precise price level.
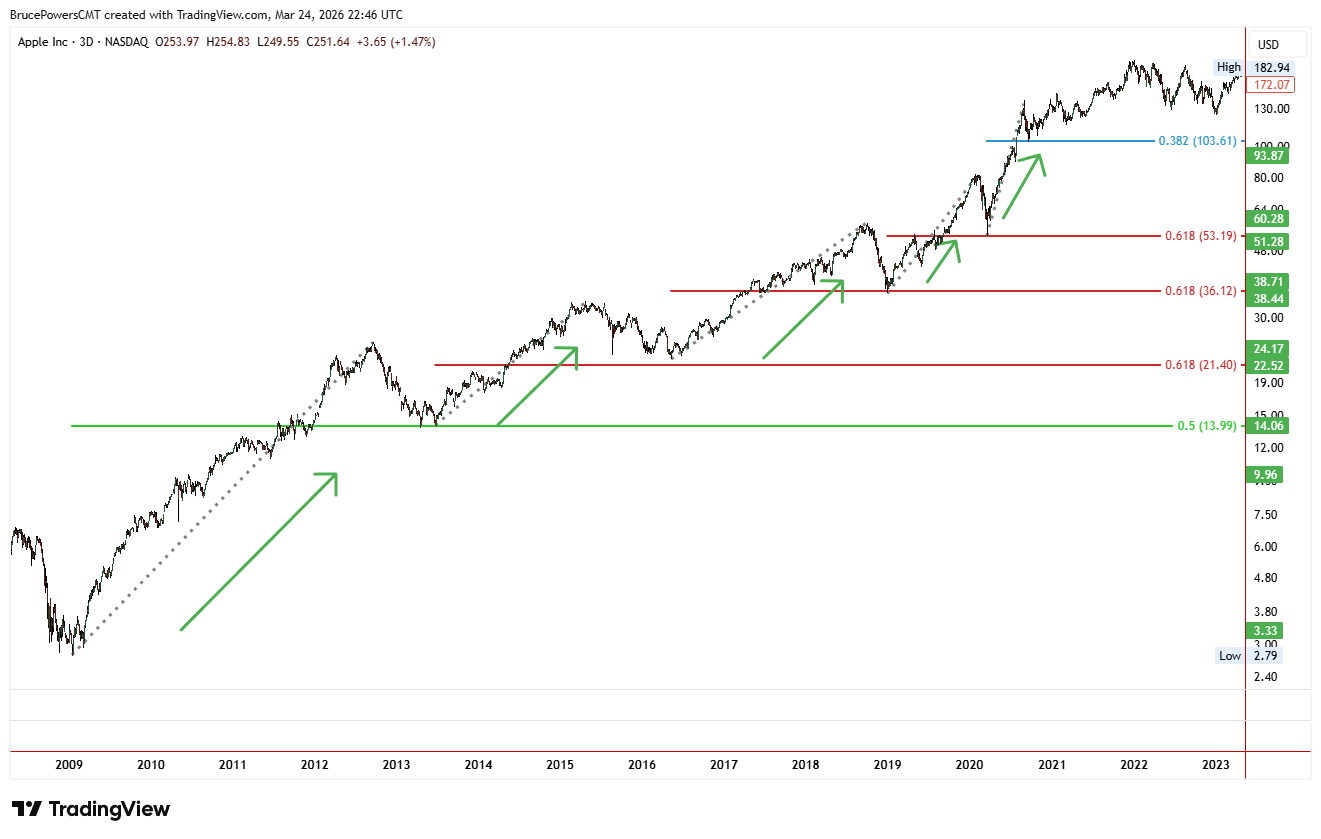
Fibonacci Retracements in an Uptrend — AAPL
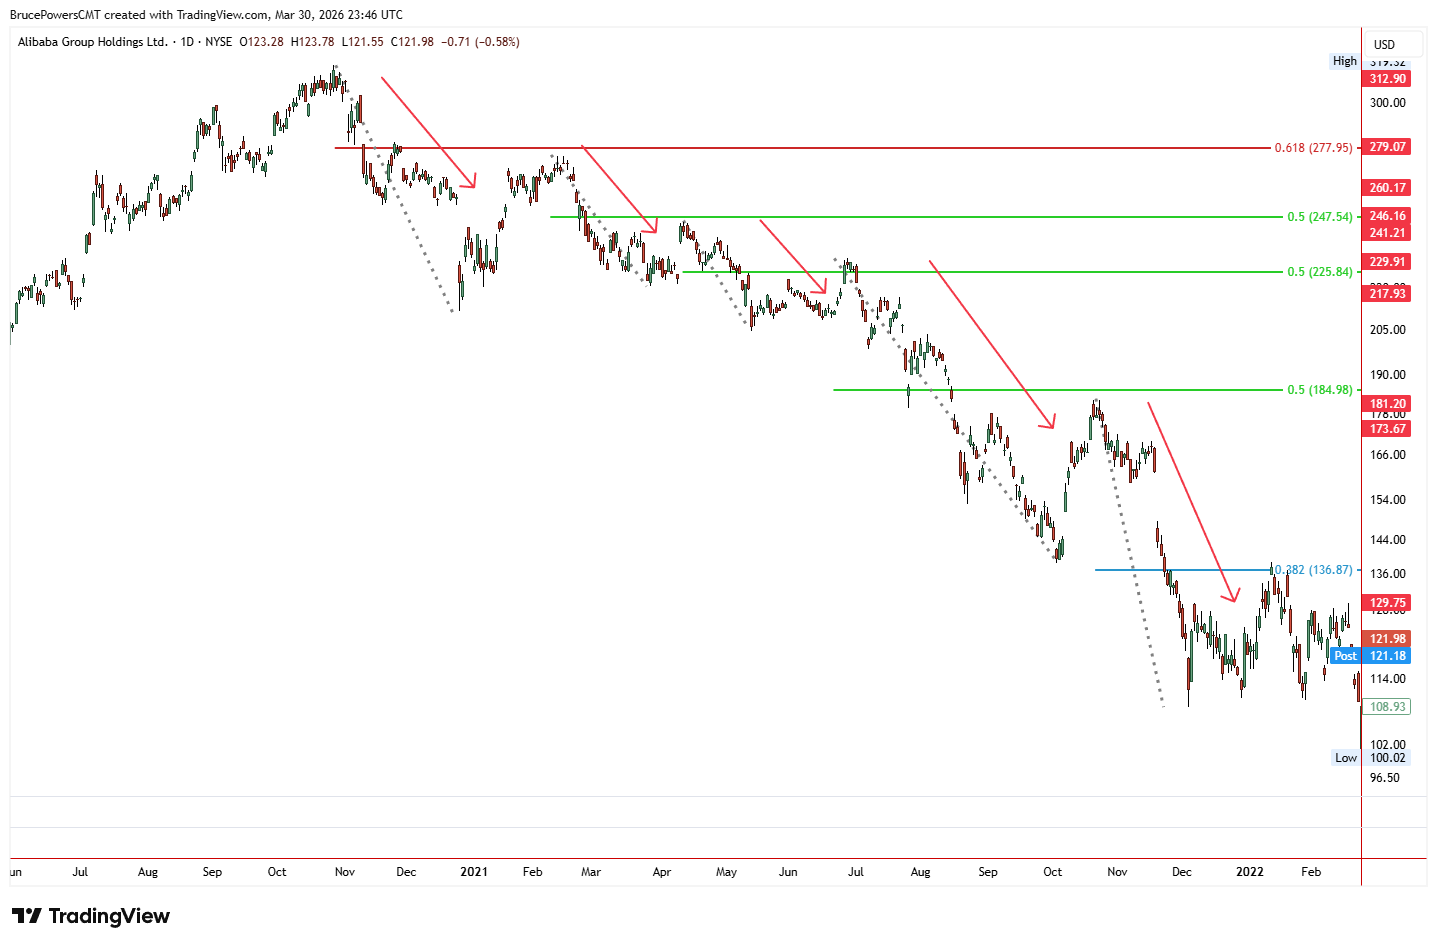
Fibonacci Retracements in a Downtrend — BABA
How to Draw Fibonacci Retracements Properly
This is another area where many newer traders get tripped up by drawing their Fibonacci retracements on the wrong swings, then asking me why the Fibonacci levels don’t work.
The key to this tool is drawing it properly. Here’s a few reminders as you draw:
- Look for a clear swing high and swing low that form an impulse leg. An impulse leg is a clear move with minimal overlap.
- In an uptrend, draw your tool from the low to the high. In a downtrend, draw from the high to the low.
- Don’t confuse an impulse leg with a corrective leg. An impulse leg is in the direction of the larger trend, a corrective leg moves against the larger trend. Only use the impulse leg as the basis of your Fibonacci ratios.
The most common error I see here is using an impulse leg that is too minor or simply not clearly defined. Another is changing the levels based on price. If you keep redrawing your Fibonacci tool until you feel the levels on the chart are “right,” that is a problem.
Another important thing to take notice is that if a market is choppy or moving on the basis of news events, or the market is simply trading range-bound, these tools simply won’t work. If there is no impulse leg, you don’t have a clear trend line to draw these levels.
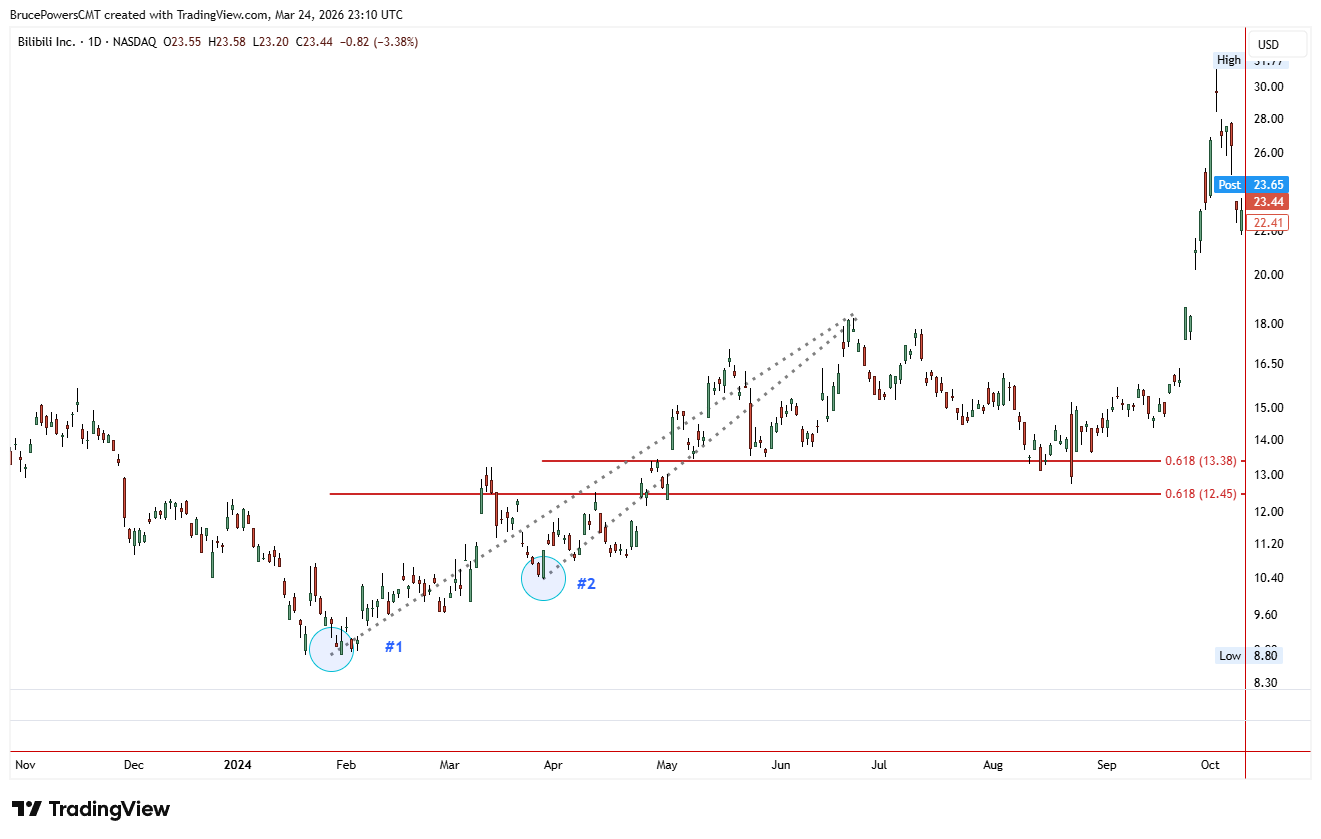
Two Different Measures — BILI
The chart above demonstrates two ways to apply the ratios. The first uses the full upswing in August to the first point where the price fell back and became bearish. The second uses an internal swing within that upswing. These different Fibonacci retracements offer different potential support or resistance levels.
These are both valid tools. Which one is more useful depends on what time frame you’re trading.
The Key Levels Traders Actually Watch
Now, here are the numbers. The most common Fibonacci retracement levels I hear from traders are 23.6%, 38.2%, 50%, 61.8%, and 78.6%.
That said, there is no “one size fits all” here. So let’s break them down:
- 23.6% and 38.2% are the shallow retracements. In a trend that has some legs, the first place you see price support (on a bull market, anyway; or resistance if bearish) is 38.2% of the way down (or up). This is also a good confirmation that the trend still has some strength.
- 50% isn’t even a true Fibonacci level, but it is commonly included in these ratios because this marks a 50% retracement of the move, which is a common psychological level for traders and algos.
- 61.8% is also known as “the golden ratio” and it is arguably the most important ratio of all. When you see price come out from this level and head in the direction of the trend, a lot of traders see that as a signal for a continuing trend. If it gets rejected at this level, it’s more indicative of a counter-trend move.
- 78.6% retracement means the price has retraced 78.6% of the initial move. If the market bounces out of this level and back into the trend direction, we have to say that a continuation is highly probable. If the price breaks below the 78.6%, a reversal becomes much more probable.
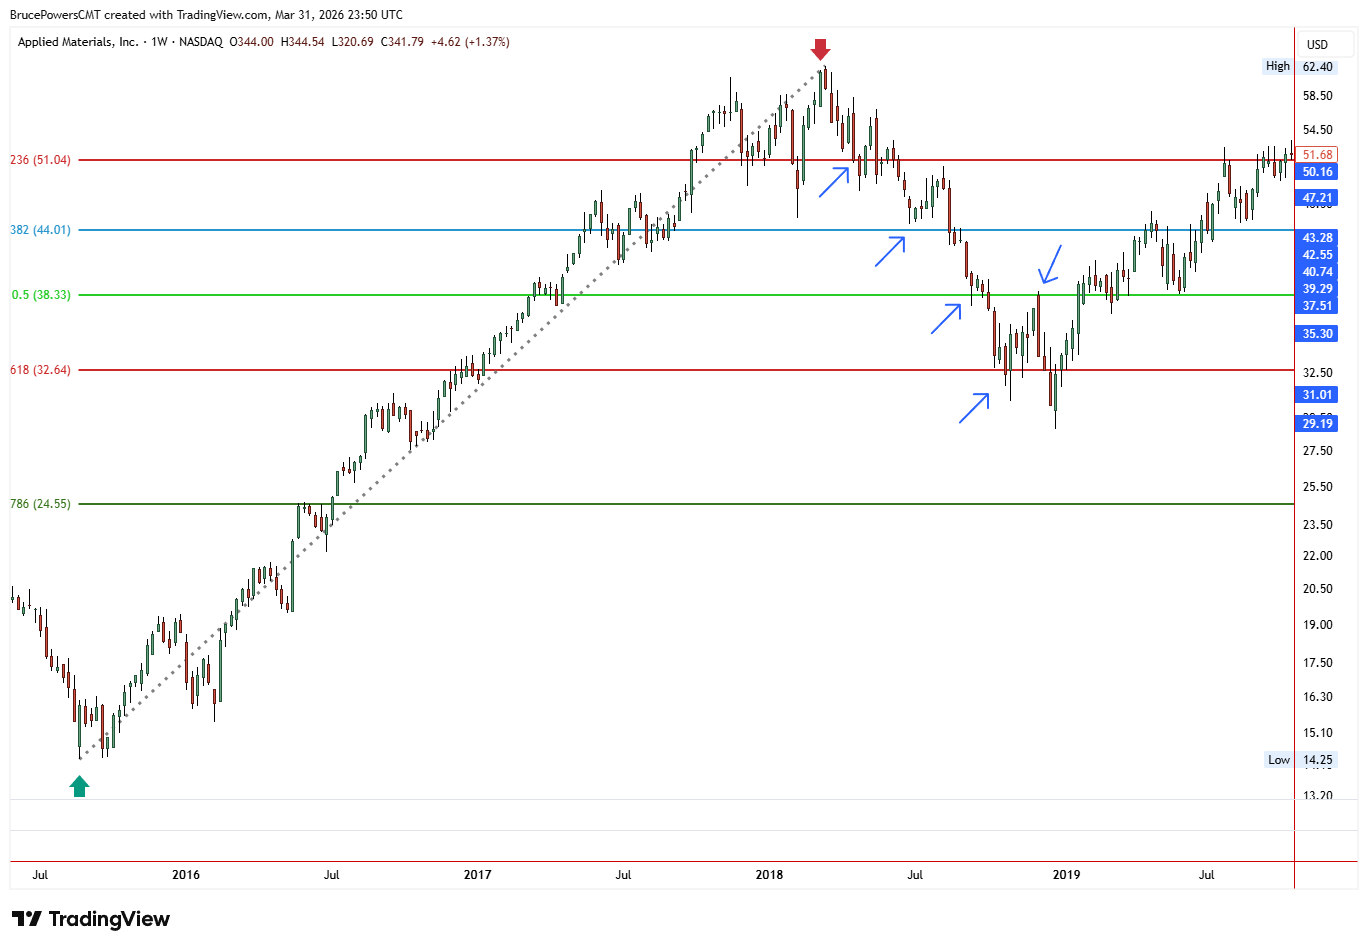
Fibonacci Levels in an Uptrend — AMAT
As you can see in the daily chart for Applied Materials (AMAT) above, a retracement to all 5 Fibonacci levels before bottoming around the 61.8% level and bouncing back up is a pretty textbook example. However, I’ll be the first to tell you that they don’t always work out that clean. At times the price can go right through one level as if it isn’t there, and sometimes it might bounce off of one level, say the 38.2% level, and never even get close to another level, the 50% level.
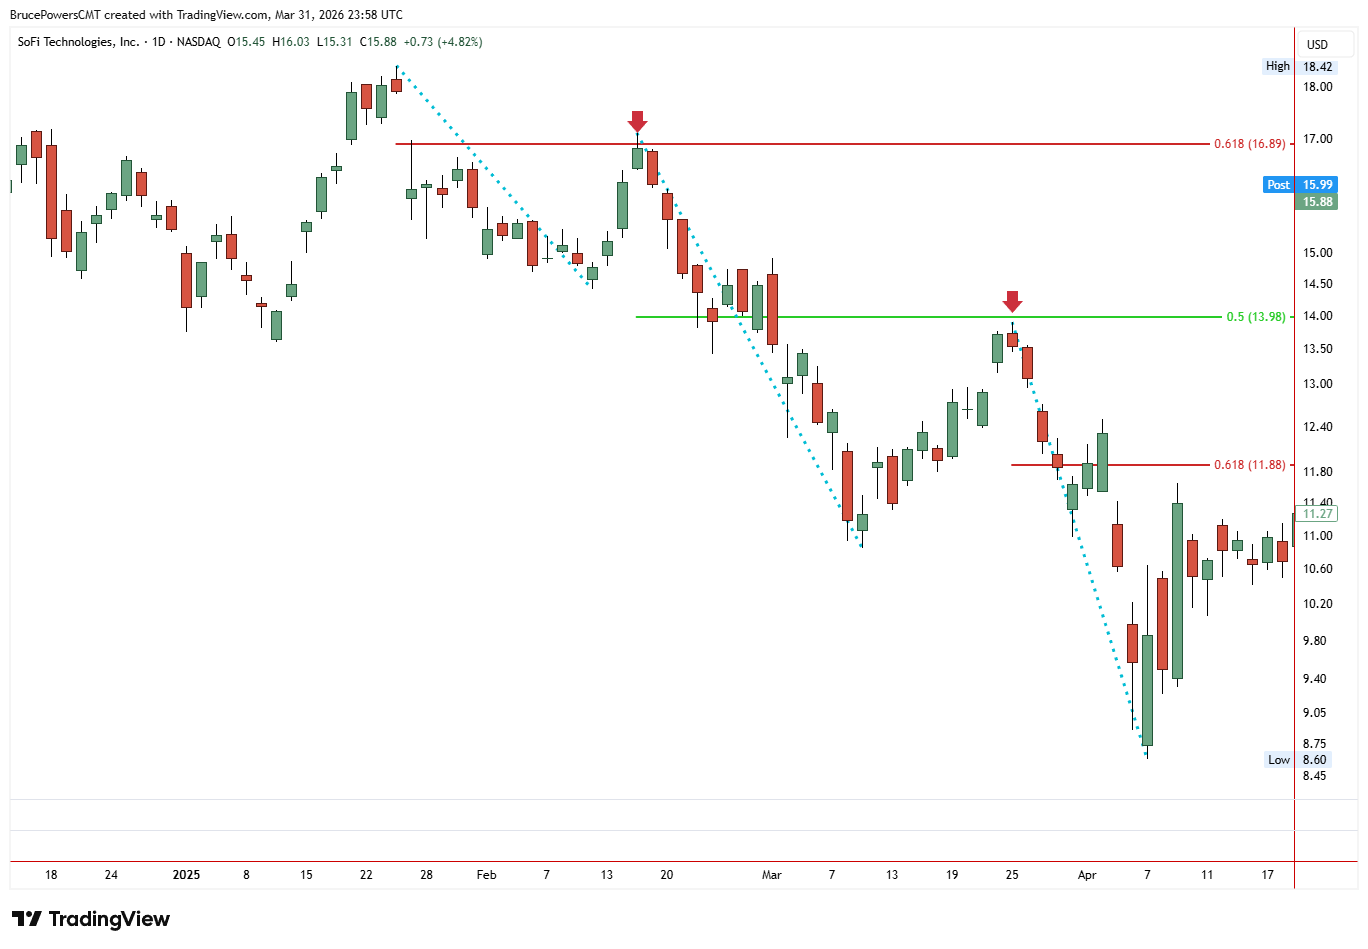
Fibonacci Levels in a Downtrend — SOFI
Fibonacci Extensions: Using Them Beyond the Normal Highs or Lows
A retracement tells you how far the price retraced from the beginning of a price move. What do you do when the price goes beyond the previous high (or low) of a move? If a stock breaks above its all-time high and keeps going higher, how do you know where its next target may be?
Extensions give you the ability to determine the probable price targets when price breaks beyond a price range and enters a price discovery phase. You begin using Fibonacci extensions when the price of a security moves:
- Above the price of a previous high in an uptrend, or
- Below the price of a previous low in a downtrend
When that happens, the price will move into a price discovery phase where there is little to no price structure. Fibonacci extensions are used to determine the most probable continuation zones for these new moves.
One common mistake that many retail traders make, particularly those who have been taught to “use the tool, and use it correctly, and don’t forget that it will always work,” is to treat Fibonacci extensions as if they are actual price targets. Extension levels are zones that may indicate a pause, a profit-taking opportunity, a consolidation area, or a loss in momentum, but they are not targets or destinations.
When it comes to Fibonacci extensions, I prefer using them as guidelines for what the likelihood is, not what the probability is.
- 127.2%: This is the square root of 1.618, and it is often the first extension level to be reached once price breaks out. This level typically indicates that the momentum is not as strong and may lead to a small pullback once price reaches it. This is a common level for weaker or smaller continuation trends.
- 161.8%: The golden ratio again, this level often marks the first sign of the continuation trend slowing down, and is also often a common area for consolidation or a small pullback.
- 223.6%: This level is related to the square root of 5.00, and it may show up on stronger, more extended continuation trends. It can be a mark of later-stage momentum or exhaustion.
In a weaker trend, price may have trouble getting past 161.8%. In a stronger trend, it can blast past 161.8% very fast, and continue to move past this level toward 223.6% before any significant resistance forms.
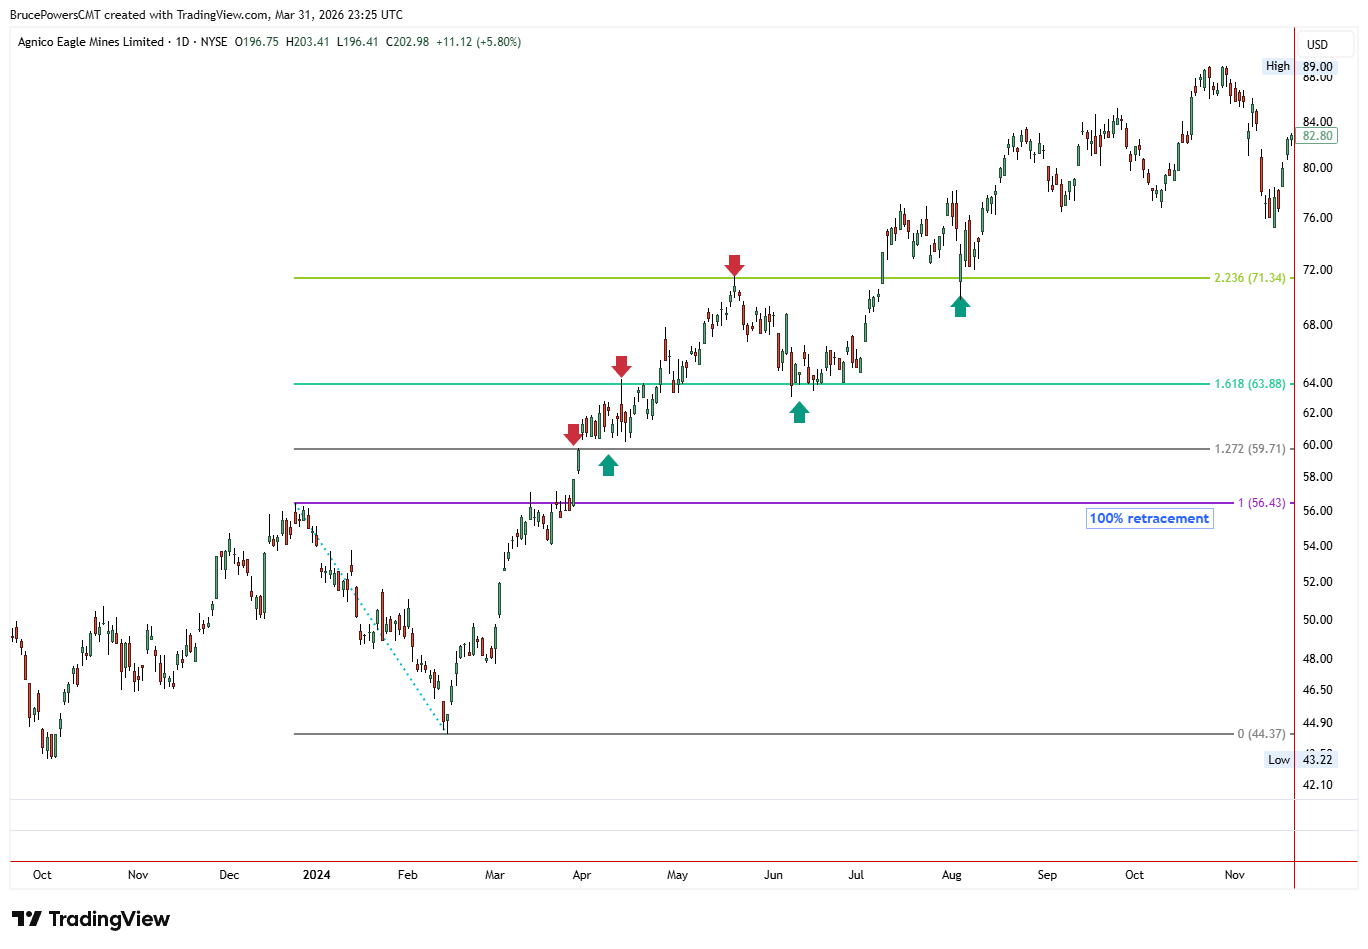
Fibonacci Extensions — AEM
Notice, in the chart of AEM above, that extensions were measured from the swing high (2023) to the swing low (2024). Every extension area was first observed by the stock as resistance and later as support. Confirmation of support is not needed, but, when we do observe the confirmation, it adds strength to our conviction.
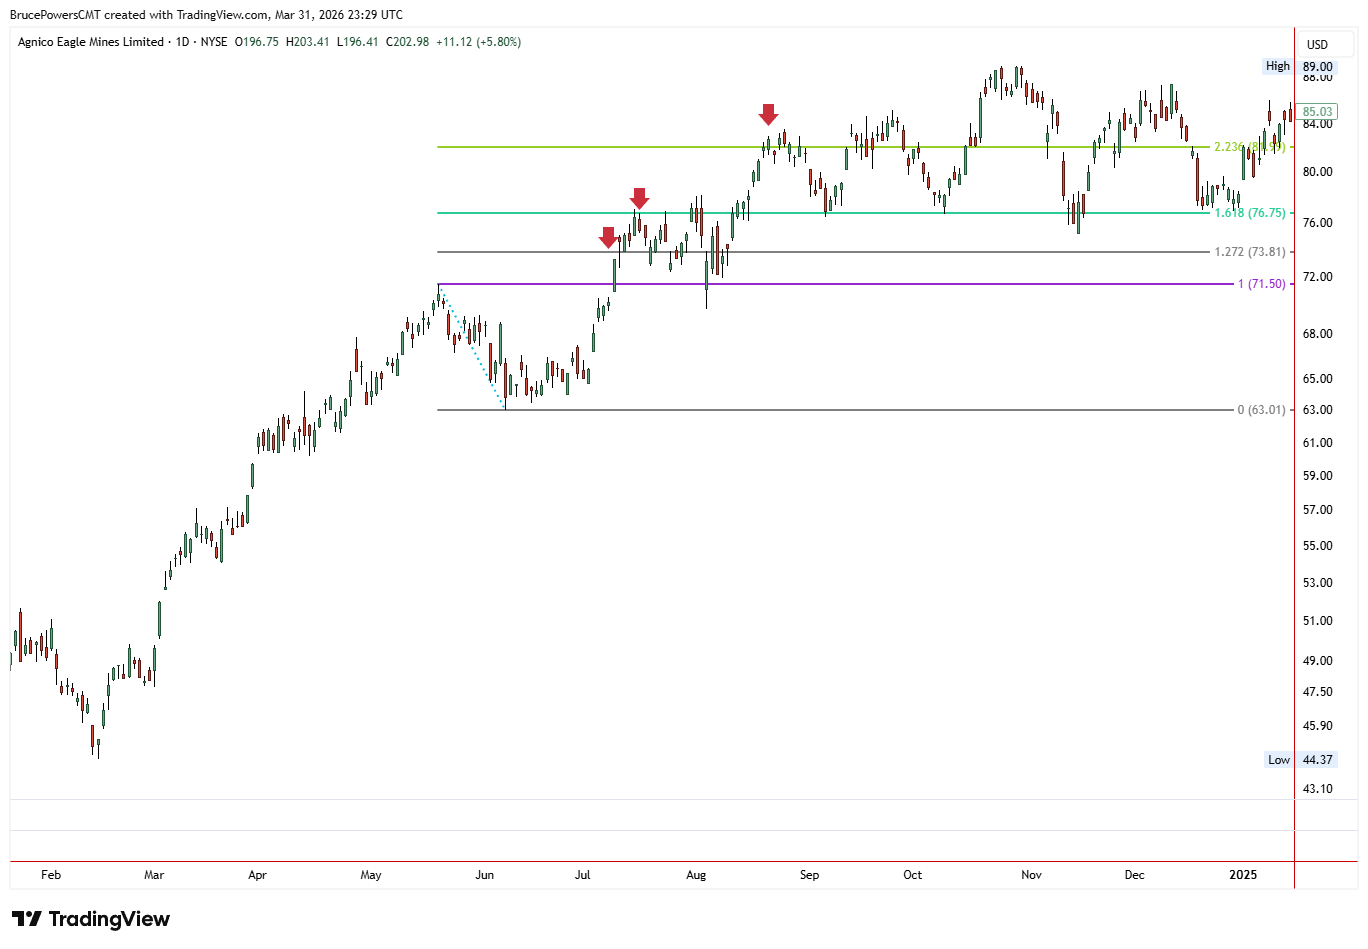
New Extension Measurements as the Trend Progresses — AEM
As the trend of AEM moved higher, we drew new extension measurements. Note the reaction of each extension area.
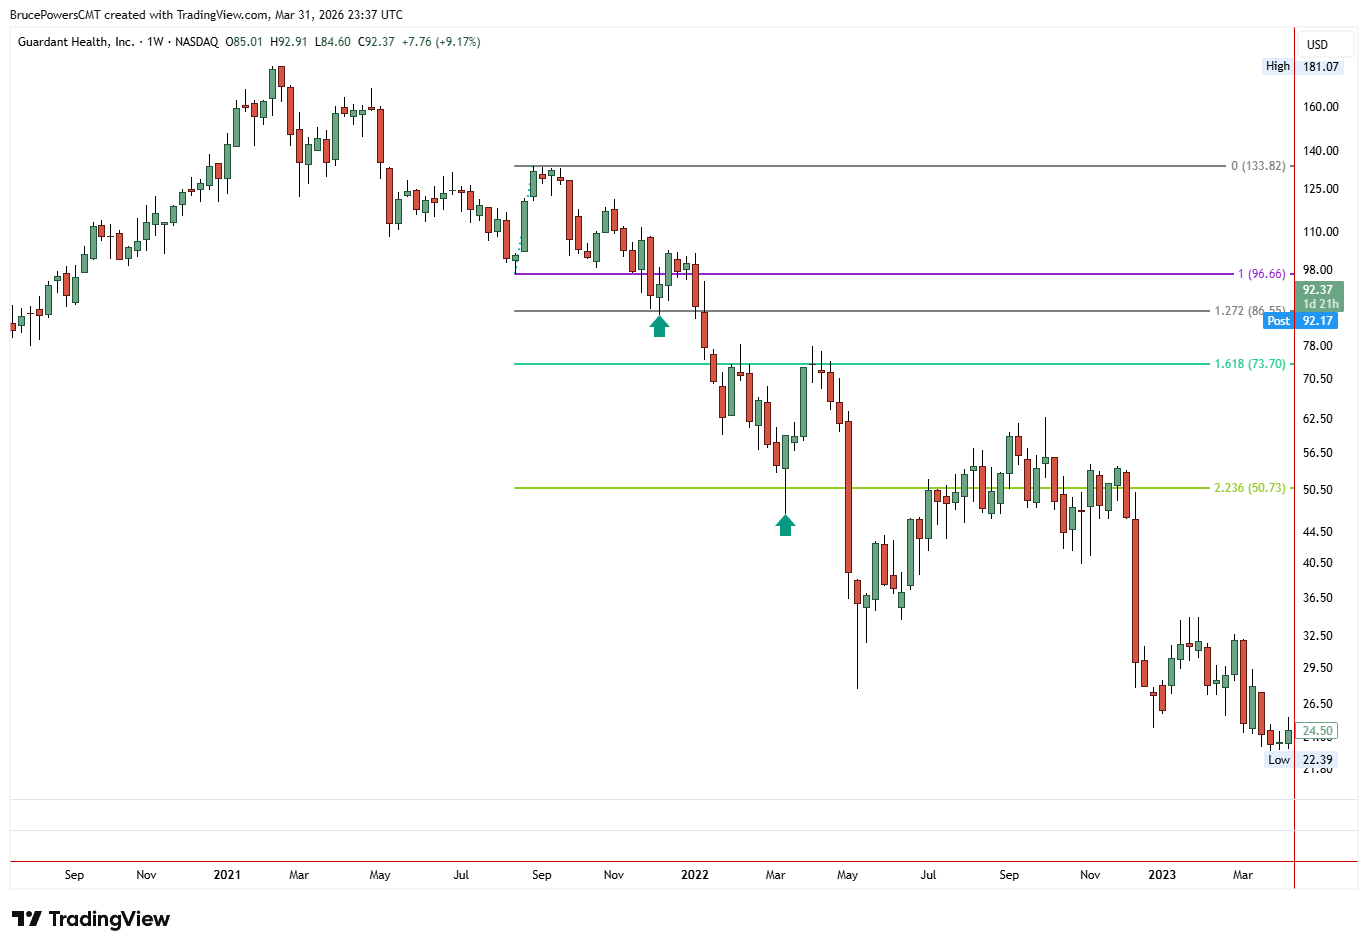
Extensions in a Downtrend — GH
This is an example of a downtrend: swing low to swing high. The fact that the 161.8% extension area was broken very quickly was a bearish sign. A price move that slices through any significant extension area in short order is a signal we’d like to know about.
Confluence, Context, and Confirmation
This is where it all comes together, which is really where we get the edge.
Fibonacci levels need to be viewed in context and combined with other technical factors to be valuable. On their own, retracements and extensions only show us where a likely reaction may take place. There’s no guarantee. However, they become much more reliable if two or more signals overlap. That’s called confluence, and it is probably the most important concept.
This occurs when a Fibonacci level coincides with one or more of the following:
- A different Fibonacci level (such as the 61.8% retracement of one swing overlapping with the 38.2% retracement of a larger swing)
- A prior swing high or low
- A trendline or channel boundary
- A moving average or anchored VWAP level
A confluence of supporting factors in an extension or retracement area makes it much more likely that a reaction will be significant. An isolated level with nothing to support it can be passed through by the price as though there’s nothing there.
Context is important, too. In a trending environment, a 61.8% level is much more likely to serve as a continuation zone. In a ranging market, that same level may only be the place where a shallow bounce occurs. Extensions that were formed with a lot of momentum are probably more likely to be met with a pause/consolidation than an outright reversal.
Confirmation is the final piece of the puzzle. The behavior of price, momentum, and volume, as we observe them during a retracement or at an extension, provides the confirmation we need to decide if the market is about to continue in the current trend direction, consolidate, or reverse. Use the Fibonacci levels in combination with context and you’ll get confirmation; turn ratios into insights.
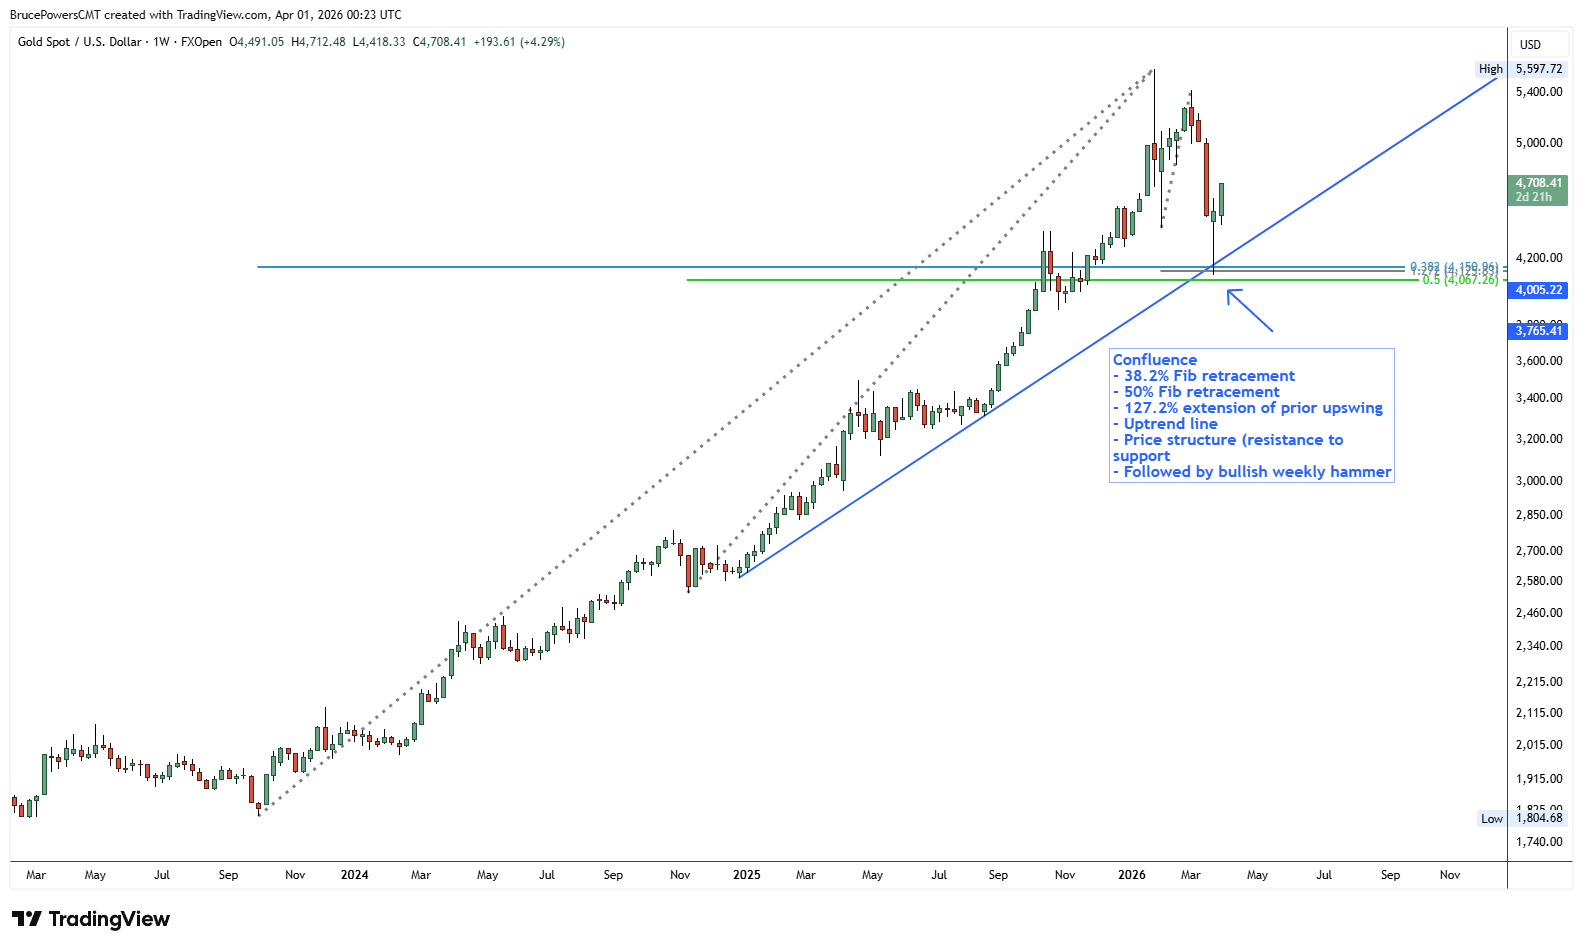
Confluence — Multiple Technical Signals Converge — XAU/USD
The Bottom Line
Fibonacci retracements and extensions aren’t about making precise predictions; they are a way of quantifying the uncertainty.
Key Fibonacci levels of 38.2%, 61.8%, 127.2%, and 161.8% are only reference points. Their value really comes into play when they are combined with market structure, the broader context, and some form of price/volume confirmation. Look for confluence; that is where you are most likely to find higher probability setups.
In this manner, these levels can be flexible tools, useful for both trending and counter-trend trades. They allow us to identify trend behavior and zones of interest in a meaningful way and give us a structure in which to consider entry, exit, and risk.
So here are a few nuggets to remember:
- Pullbacks are not a sign that you’ve done something wrong. They’re simply the market’s way of telling you how the trend is performing. If pullbacks are shallow, that suggests the trend is in good shape; if they’re deep, that could signal a change in the trend.
- Rather than treating a level as an exact line on a chart, think of a level as a zone. Don’t obsess about the exact number. Focus on the percentage.
- A single Fibonacci level will help but won’t give you a signal. A Fibonacci level combined with an indicator, like a moving average, or a previous swing high will help confirm a signal.
- The ratio means nothing without understanding the market context. The 61.8% retracement ratio means very different things when it occurs in a trend compared to a range.
Whenever you see a retracement happen, don’t immediately assume the trend is done. The trend is taking a break, so to speak. It’s catching its breath and recharging, to a point. And Fibonacci levels allow you to see this.