


Oil Rebounds. PCE Decides the Rest.
June E-mini S&P 500 Index futures dropped 0.2% early Thursday. Nasdaq 100 futures fell 0.3%. Dow Jones Industrial Average futures slipped 62 points. Wednesday’s record closing high on the Dow is already fading because West Texas Intermediate crude oil climbed 1.8% back above $90 a barrel and Spot Brent crude oil rose close to 2% above $96. One session of relief on diplomatic progress with Iran and the market gave it all back on reports of additional U.S. military strikes targeting an Iranian military facility.
Will the PCE Report Confirm the Fed’s Worst Fear?
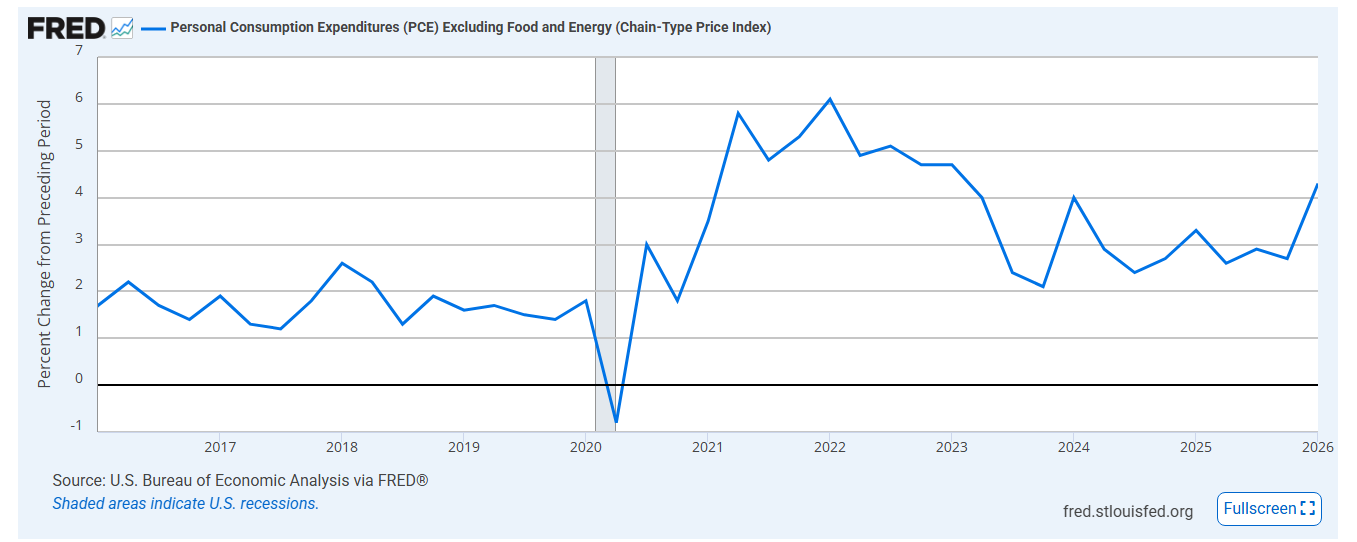
The April Personal Consumption Expenditures index drops Thursday morning and this is the first major inflation reading under new Federal Reserve Chair Kevin Warsh. The report matters more than usual because traders are trying to figure out whether Warsh’s Fed will lean harder on rates than the market expects.
Economists surveyed by Dow Jones expect the headline Personal Consumption Expenditures index to rise 0.5% month-over-month and 3.8% year-over-year. Core Personal Consumption Expenditures, which strips out food and energy, is expected at 0.3% monthly and 3.3% annually. Those are not soft numbers. A 3.8% headline with oil back above $90 tells the Fed that inflation is not cooperating. A hotter print pushes the 10-Year U.S. Treasury yield higher, strengthens the U.S. Dollar Index, and puts direct pressure on growth stocks and rate-sensitive sectors.
A cooler reading is the only thing that gives this market room to run. Without it the record high on the Dow from Wednesday looks like a ceiling, not a floor.
Did the Iran Rally Just Die in One Session?
Wednesday’s strength had a simple explanation. Secretary of State Marco Rubio said discussions with Iran were moving forward and the administration preferred a negotiated solution. Iranian state television reported that Tehran planned to restore commercial shipping through the Strait of Hormuz within a month if an agreement was reached. Oil dropped. Stocks rallied. The Dow closed at a record.
Dow Jones Price Forecast
Every new Dow Jones analysis as it publishes, today's technical signal and key levels, live price — on one page.
See all Dow Jones forecastsThen Thursday happened. The U.S. military struck an Iranian military facility overnight. President Donald Trump said Iran would not be allowed to control the Strait of Hormuz under any agreement. The White House rejected reports of a memorandum of understanding and called them false. West Texas Intermediate crude oil jumped 1.8% and everything that worked on Wednesday stopped working. The diplomatic window is not closed but the market is no longer trading it as a certainty. Oil back above $90 means inflation pressure stays elevated and that is the problem heading into this morning’s data.
Who Won and Lost on Earnings?
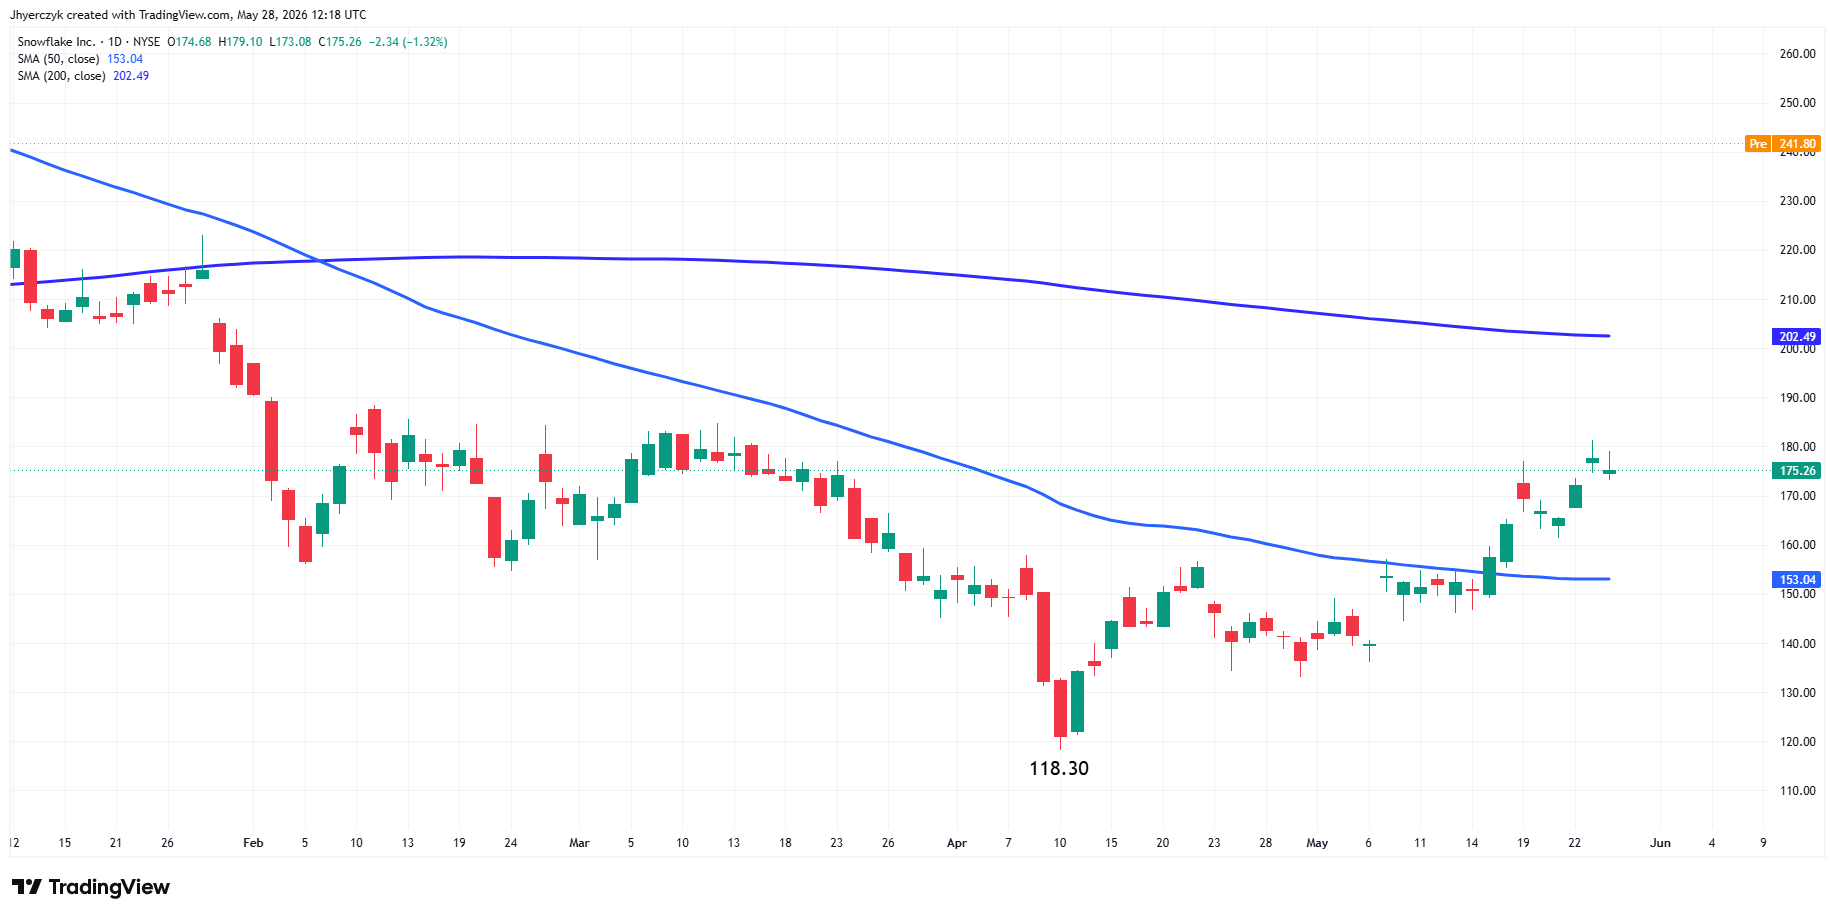
Snowflake jumped 37% and the rest of the software sector followed. A $6 billion deal with Amazon Web Services over five years was the headline. Earnings and revenue both beat. ServiceNow and DataDog caught the updraft before the bell even rang.
Dollar Tree climbed more than 11%. Beat on earnings. Beat on revenue. Raised guidance. Then announced a DoorDash partnership for same-day delivery on top of it. Best Buy gained almost 8% because gaming, computing, and mobile phone demand pushed comparable sales higher than the Street expected. Kohl’s posted a smaller loss than analysts had penciled in and jumped nearly 11%. Agilent Technologies raised profit guidance and gained 9%. Hormel Foods beat and rallied.
The losers were more interesting. Marvell Technology issued an upbeat forecast and still fell nearly 3%. Valuation after a strong run this year. Salesforce raised full-year earnings guidance and slipped 1% because revenue guidance missed by a hair. Braze dropped 10% on margins. Everpure beat on both lines and lost more than 10% anyway. Four stocks that delivered good numbers and went lower. That tells you where expectations were sitting before any of them reported.
Daily June E-mini S&P 500 Index Futures Technical Analysis
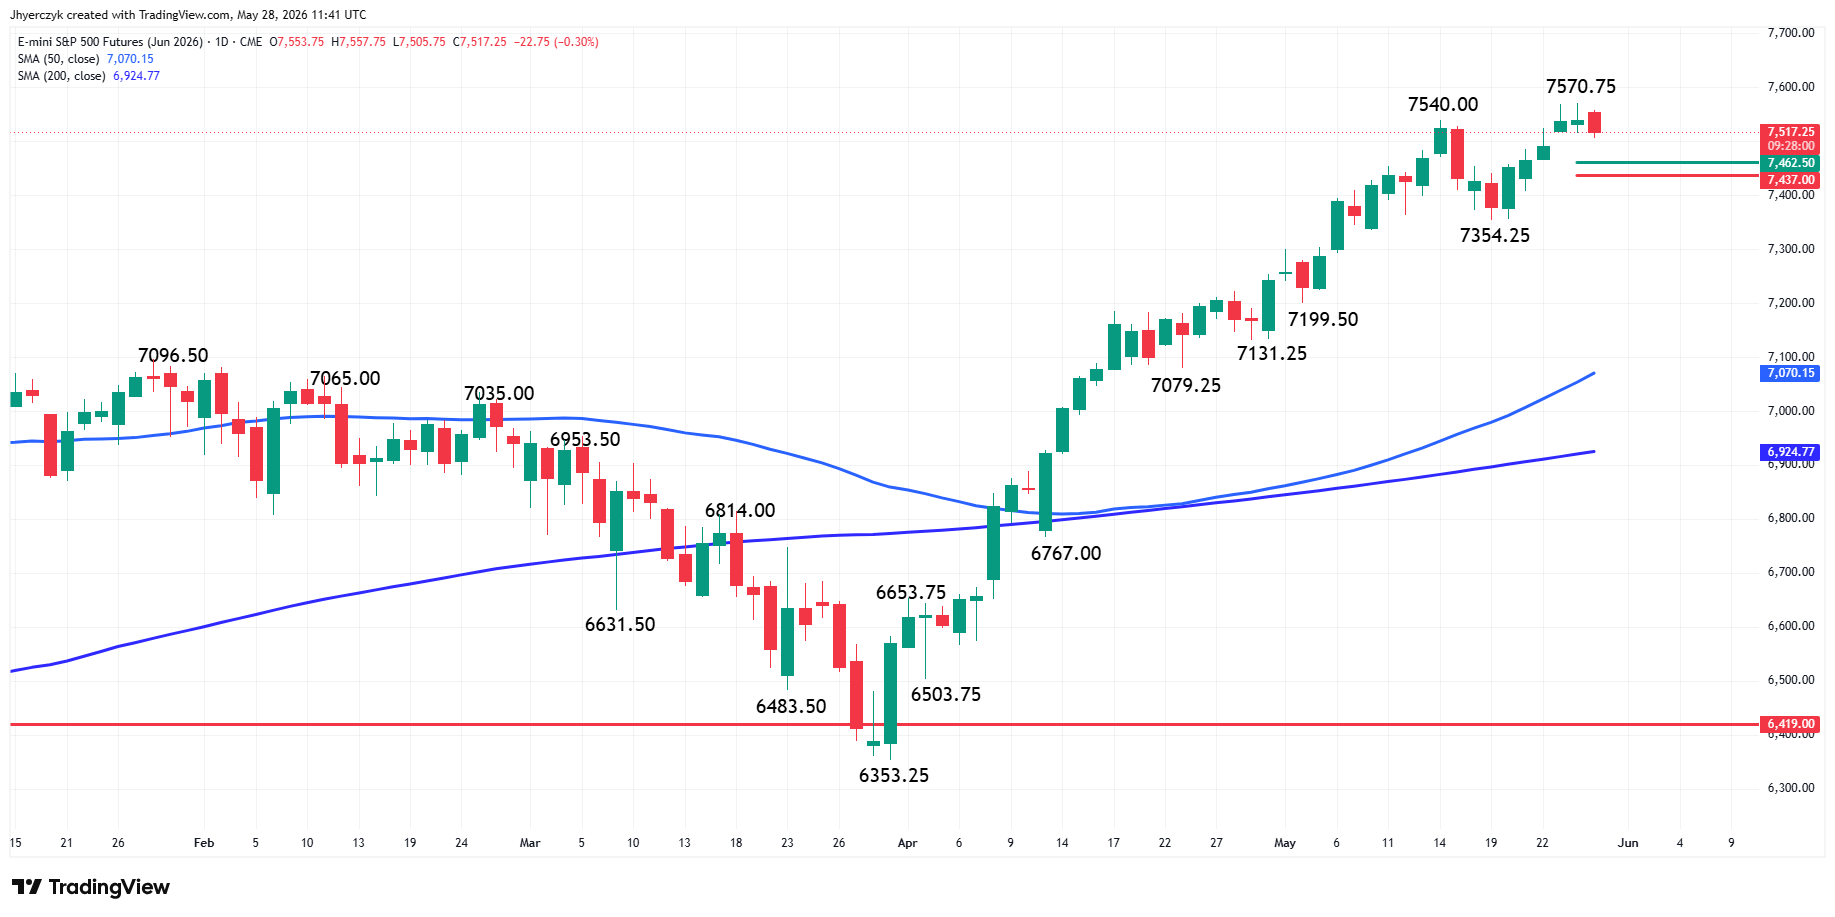
June E-mini S&P 500 Index futures are trading lower on Thursday but holding inside the weekly range of 7570.75 to 7505.75.
The main trend is up according to the daily swing chart. A trade through 7570.75 will signal a resumption of the uptrend. The main trend will change to down on a trade through 7354.25.
The main range is 7354.25 to 7570.75. Its retracement zone at 7462.50 to 7437.00 is the first downside target. Since the main trend is up, look for buyers on the first test of this area. If it fails, we’re headed to 7354.25 and a potential change in trend.
The first major intermediate target is the 50-day moving average at 7070.27. The first major long-term target is 6924.80.
What Happens if Oil Stays Above $90?
West Texas Intermediate crude oil is back above $90 a barrel. The Personal Consumption Expenditures report drops this morning. Those two things together decide whether Wednesday’s record on the Dow holds or breaks.
A hot inflation number with oil at these levels keeps the Federal Reserve locked in place. The 10-Year U.S. Treasury yield goes higher. Growth stocks lose their bid. The Iran diplomacy that drove Wednesday’s strength is already falling apart after overnight strikes and the White House calling the memorandum reports false. Oil is not pulling back and that means the inflation picture is getting worse heading into the print, not better.
The retracement zone at 7462.50 to 7437.00 on June E-mini S&P 500 Index futures is the first place buyers have to show up. That zone holds and the uptrend survives. It fails and 7354.25 is next with a potential trend change attached to it. The Personal Consumption Expenditures number picks the direction. Oil picks how far it runs.
More Information in our Economic Calendar.