US stock market remains at extreme levels, and the next move may not be easy. The strong demand for artificial intelligence continues to support the technology stocks that keep the S&P 500 and Dow Jones elevated. But the tariff driven price increases, higher oil prices and the risk of another Federal Reserve rate hike may keep the uncertainty high. At the same time, the extreme market valuations have little room for weak earnings or negative economic surprises. The technical outlook still points to higher levels but investors may face greater volatility before the Dow Jones and S&P 500 reach their next targets.

Tariffs Keep Inflation and Fed Rate Hike Risks High
According to new research from the Federal Reserve Bank of New York, many businesses have fully passed the costs of tariffs to their customers. Almost half of the firms that paid tariffs still plan to raise prices. Some of these firms expect to raise prices for next six months or longer. This means that tariffs may have longer impact on inflation than markets currently expect.
Some price increases have been postponed due to practical considerations. Some firms were not allowed to change prices immediately due to existing contracts. These companies can now increase prices when they enter into new contracts. Other companies are hiking their prices gradually to avoid a sudden shock for their customers. This slower process may spread the inflation pressure for several months.
The survey covers the businesses in New York, Connecticut, New Jersey, Puerto Rico and the U.S. Virgin Islands. This does not fully represent the national economy. New York Fed President John Williams is also convinced that the effect of the tariffs might be close to its limit. But the delay in the price increment is still a risk. The Federal Reserve could keep interest rates higher or may have to raise them in September if inflation is high.
AI Stock Rally Faces Fed and Iran War Risks
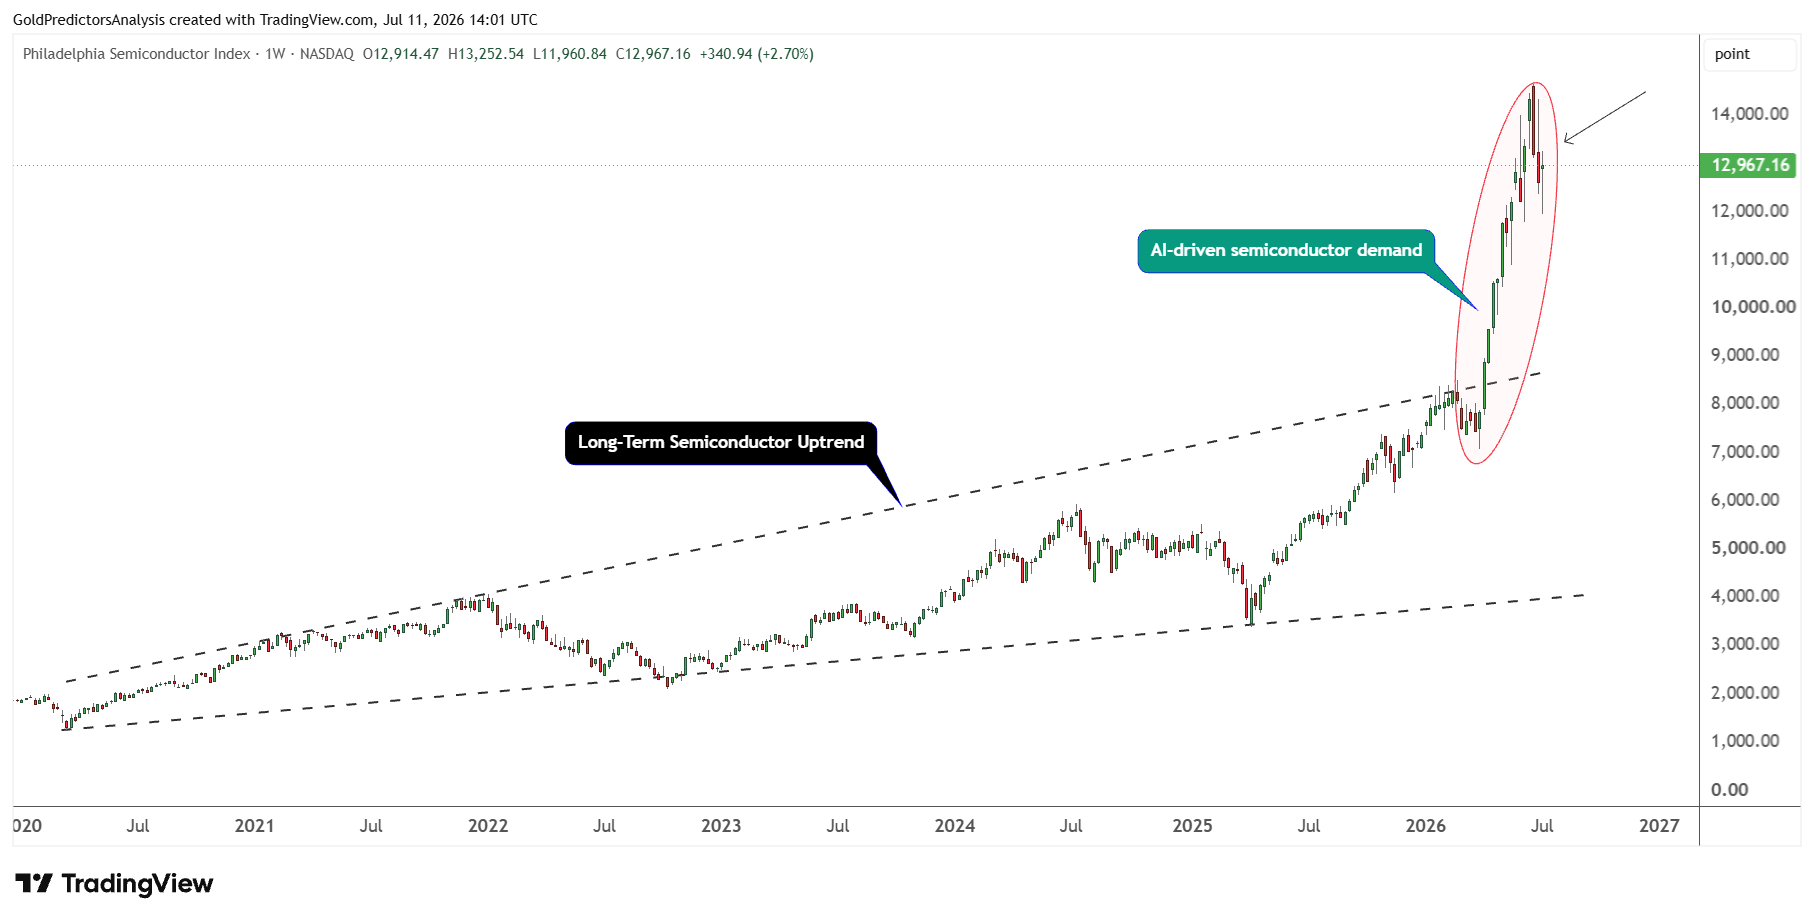
The technological stocks continue to lead the US stock market. U.S. stocks are being led by technology issues. The Philadelphia Semiconductor continues to form a bottom after a strong drop from the 14,600 level.
S&P 500 Price Forecast
Every new S&P 500 analysis as it publishes, today's technical signal and key levels, live price — on one page.
See all S&P 500 forecastsThe chart below shows that the Philadelphia Semiconductor Index forms a strong bullish price action. The index produced a reversal candle. A break above 13,500 may continue the next rally. This will likely push the technology stocks further higher.
Micron Technology shares have rallied since it announced plans to invest over $250 billion in the U.S. through 2035. The company wants to capitalise on the growing demand for memory chips in AI systems. Other stocks with strong gains included Applied Materials and Sandisk.
AI stocks continue to lift the S&P 500. Meta Platforms is supported, as it has announced it will start manufacturing AI chips in September. AI infrastructure and computing power remain key long term investment opportunities. Demand for chips, data centres and cloud services might keep technology earnings rolling.
But the market outlook will depend on the oil prices and interest rates. The renewed tensions between the US and Iran could drive the energy costs higher. That would be additional source of inflation when business costs are affected by the tariffs. The Fed failed to raise rates at its June meeting but a few members were thinking about it. As per the FedWatch tool, the market expects a 25 basis point increase by September with over 50% of probability. This could push up borrowing costs and may pressure growth stocks that are trading at higher valuations.
S&P 500 Valuation Signals Rising Stock Market Correction Risk
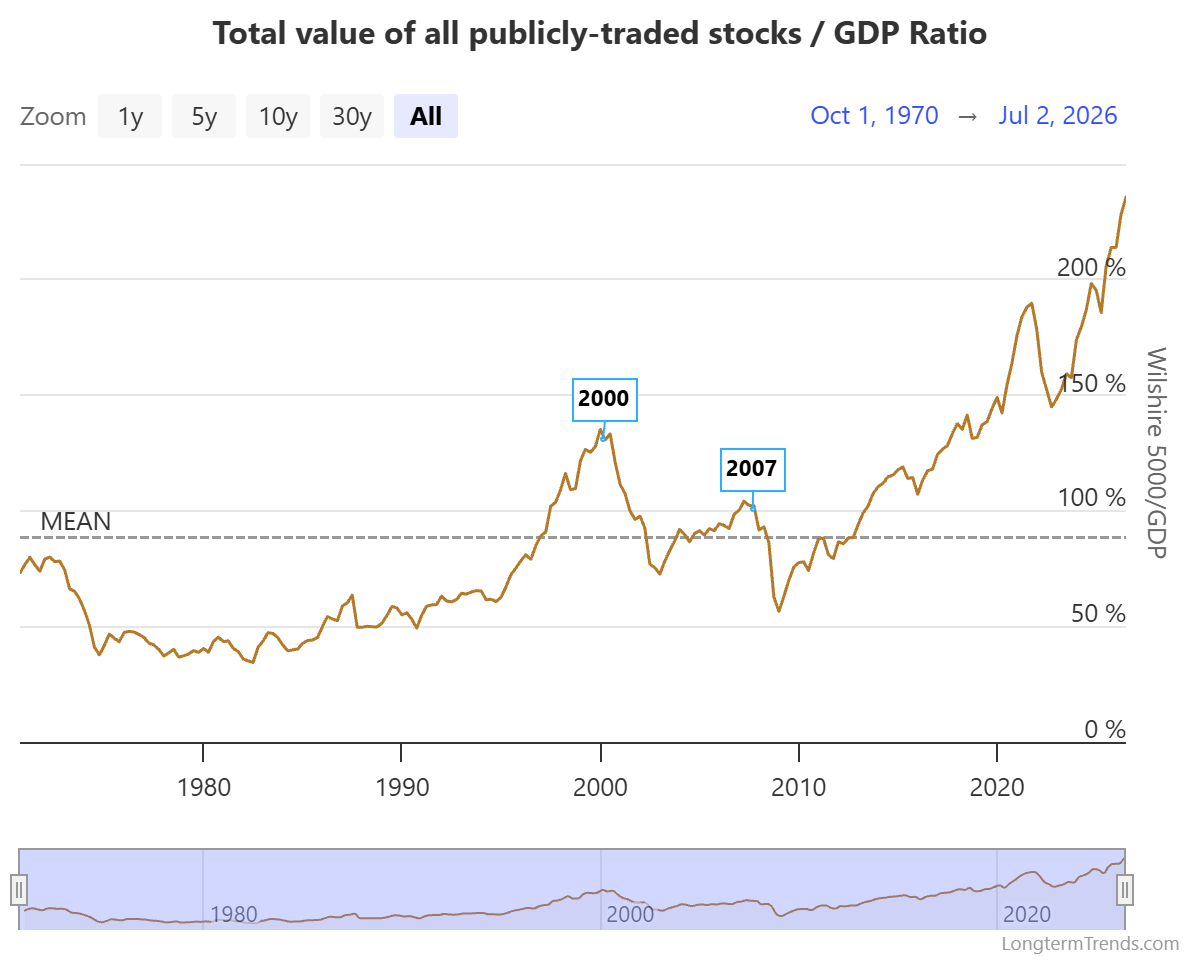
Despite escalating inflation and interest rate risks, U.S. stocks are very expensive. The Buffett Indicator reached a new record of over 235% as seen in the chart below. This is well above its long-term average. This indicates that stocks have grown much faster than the growth in the economy. This does not mean that the correction will develop immediately. But this leaves the market more vulnerable to any negative economic surprise.
Investors are paying high prices for stocks, as evidenced by other valuation measures. The Dow Jones price-to-sales ratio and the forward price-to-earnings ratio remain elevated. These ratios slightly decline in the short term but this does not change the broader picture. Both ratios remain elevated as the tariffs, energy prices and rising interest rates threaten profit margins of companies.
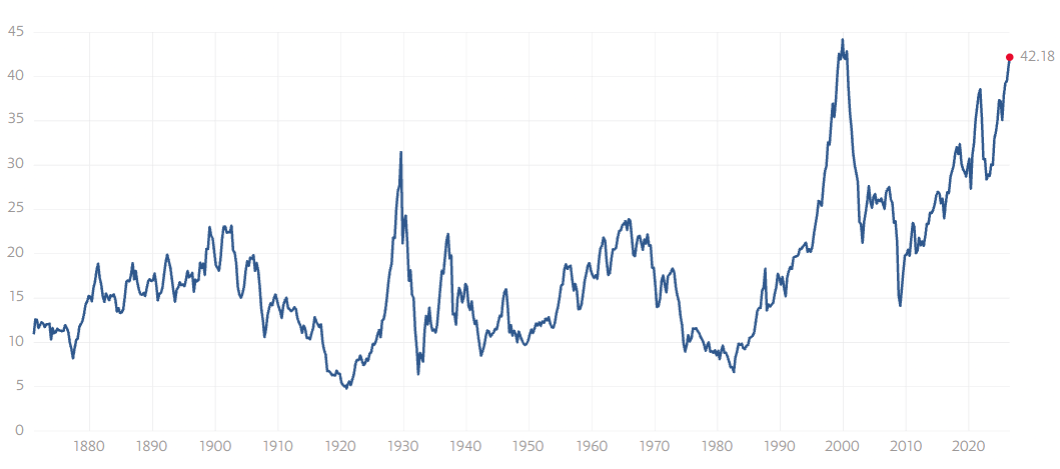
Over the long term, the S&P 500 also appears to be on the high end. The chart below shows that the Shiller CAPE ratio increased to 42.18 and reached near the Dot-Com bubble peak.
Based on forecasted trailing earnings, the S&P 500 P/E ratio also increased to 25.8, significantly higher than its long-term average. If the AI results are strong, this rally might continue in the short term. But the current valuations leave little room for disappointment. If the inflation remains the issue and the Fed keeps the focus on the higher interest rates, then the correction from these levels might be deeper.
Dow Jones Forecast: Bullish Momentum Targets 55,000
The Dow could benefit if the market rally continues to spread to other sectors such as industrial, financial and healthcare firms. But the Dow could be more directly impacted by tariffs than the technology heavy Nasdaq.
Many Dow companies depend on the global supply chains, imported materials and consumer demand. If businesses are unable to pass on these increased costs to their customers, then they could see a decline in their margins. On the other hand, an increase in oil prices or US Treasury yields may introduce some pressure.
From a technical perspective, the Dow Jones remains in a strong bullish trend and looks for further upside in the short term. The emergence of an inverted head and shoulders pattern from 2021 to 2023, followed by the wedge pattern from 2024 to 2026, indicates that the Dow Jones is moving toward 55,000.
The wedge pattern defines this target. The V-shaped recovery patterns in April 2025 and March 2026 indicate that the momentum remains strong.
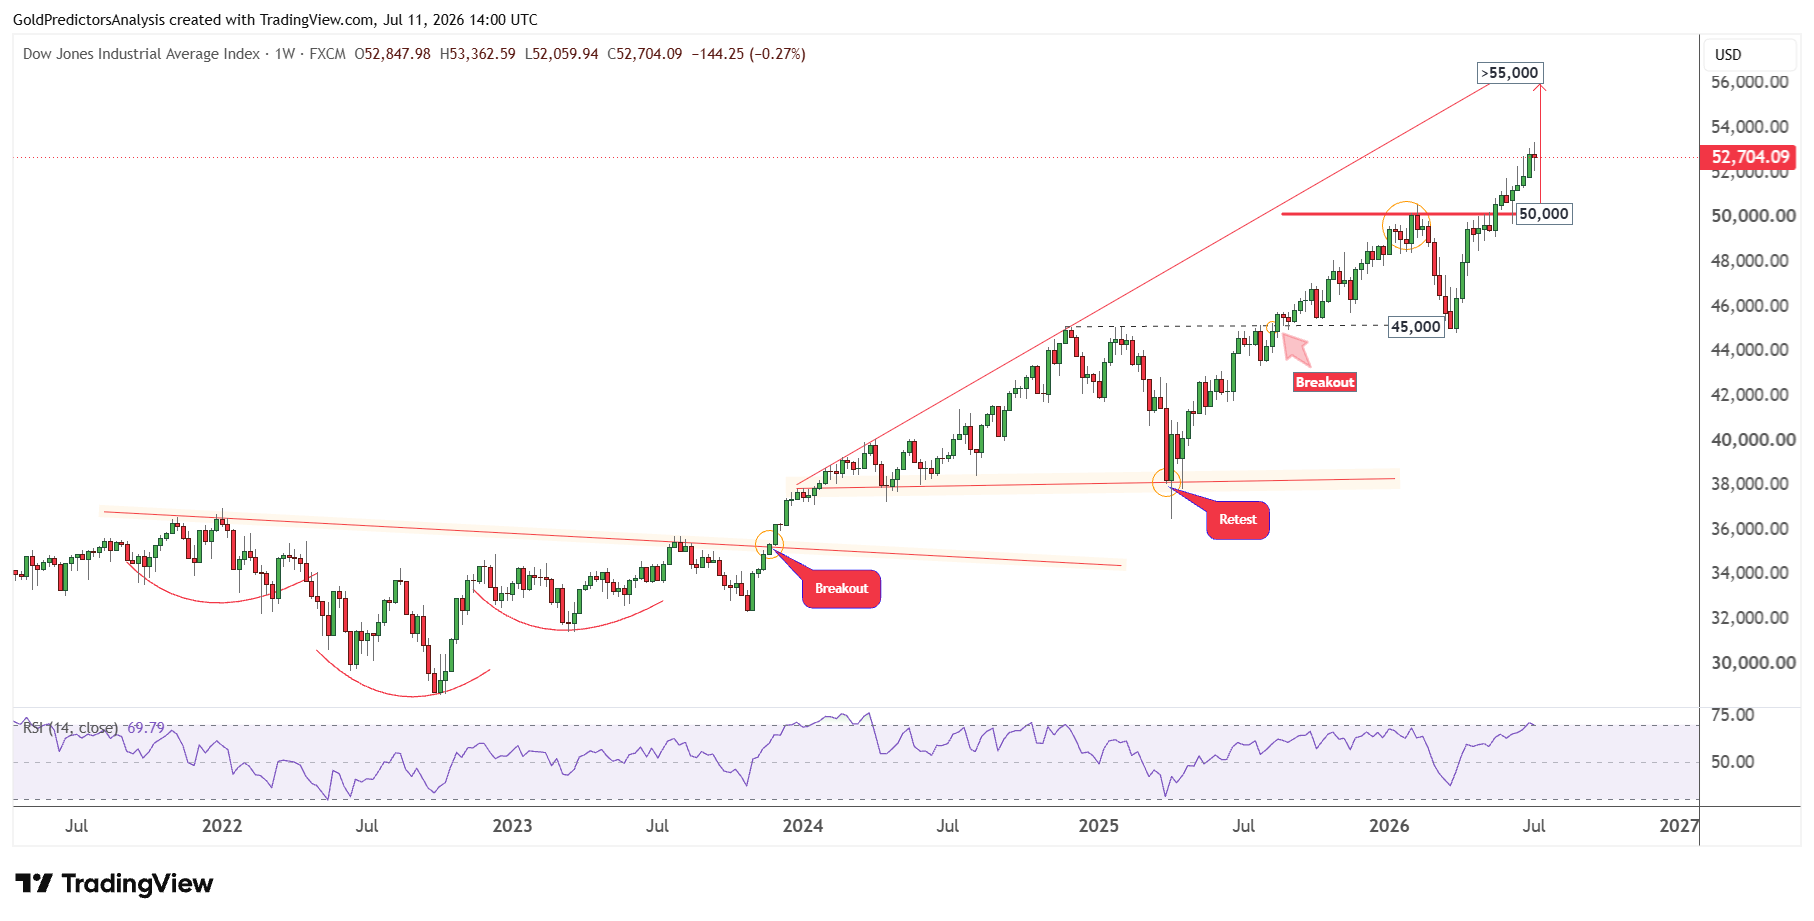
The next target for the Dow Jones remains 55,000 as long as the 50,000 support level holds. But the RSI has reached the overbought level in the short term, which may trigger a correction. However, any correction may find support at the 50,000 level and may initiate the next move higher.
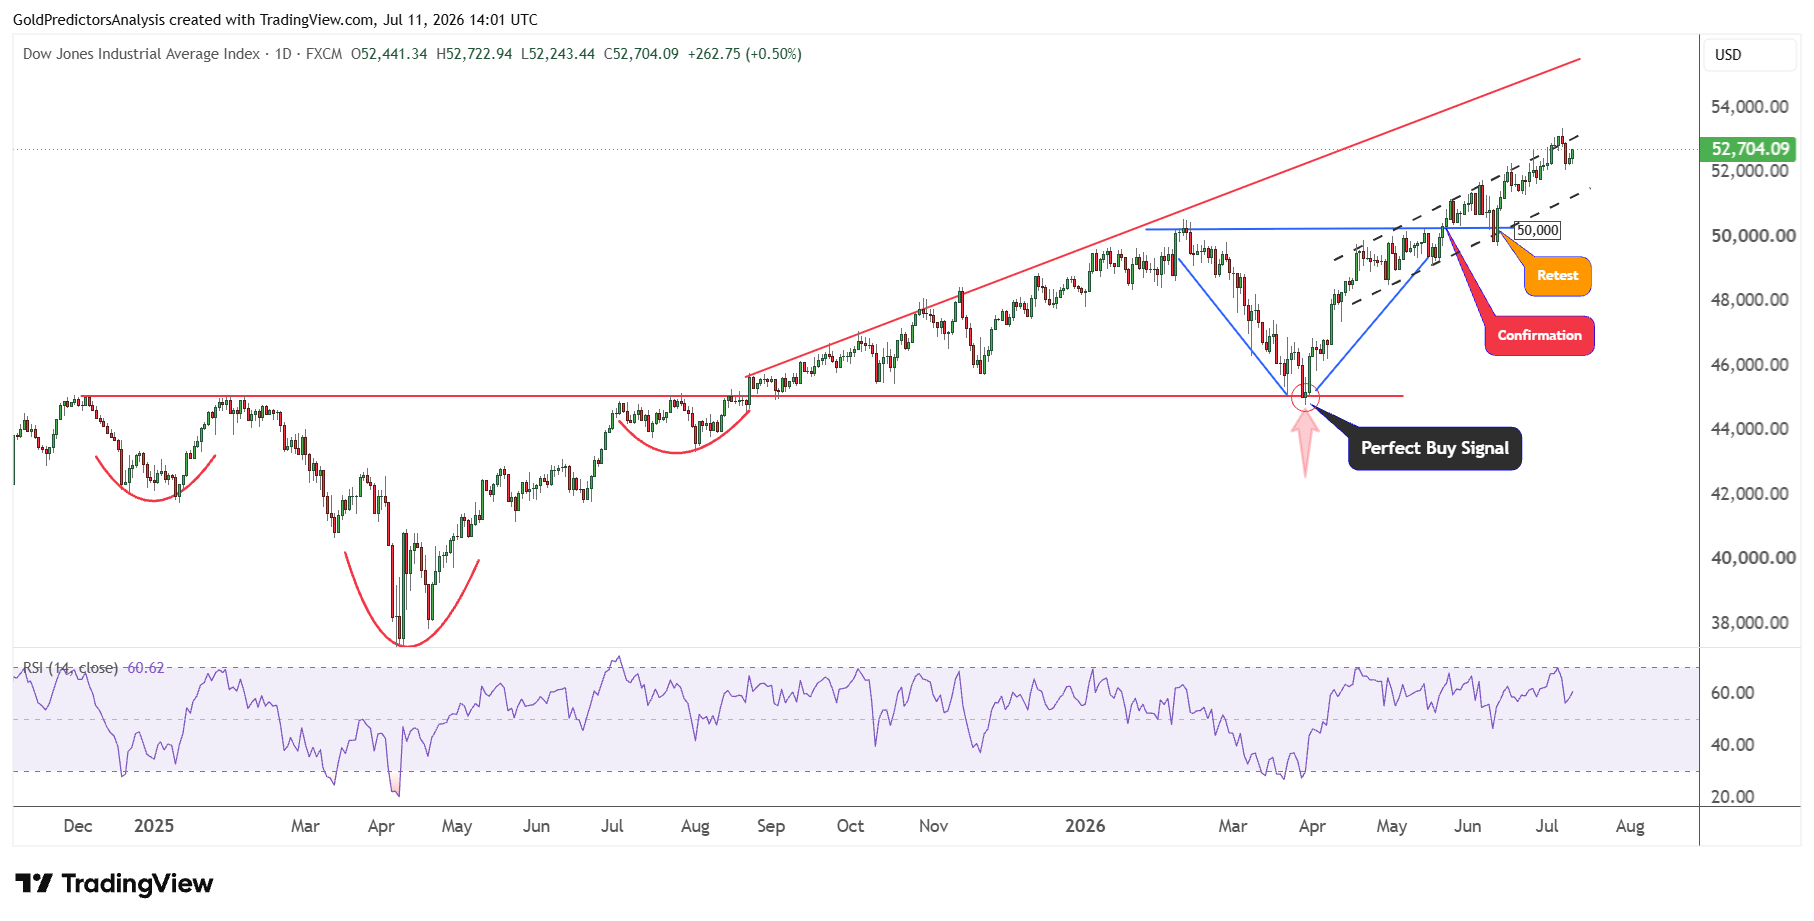
The daily chart for the Dow Jones also points to the same strength in the index. The index formed a V-shaped recovery pattern and initiated a perfect buy signal in March 2026 at 45,000. The index has now broken above 50,000 and has remained within an ascending channel pattern since April 2026. But the momentum is accelerating, which indicates that the short term peak may develop soon.
S&P 500 Forecast: Bullish Breakout Targets 8,000
The rally in the S&P 500 depends on the earnings of the AI-related companies. The volatility from oil prices and the inflationary pressure from tariffs may keep the index volatile. But the broader trend still points to higher levels in the index.
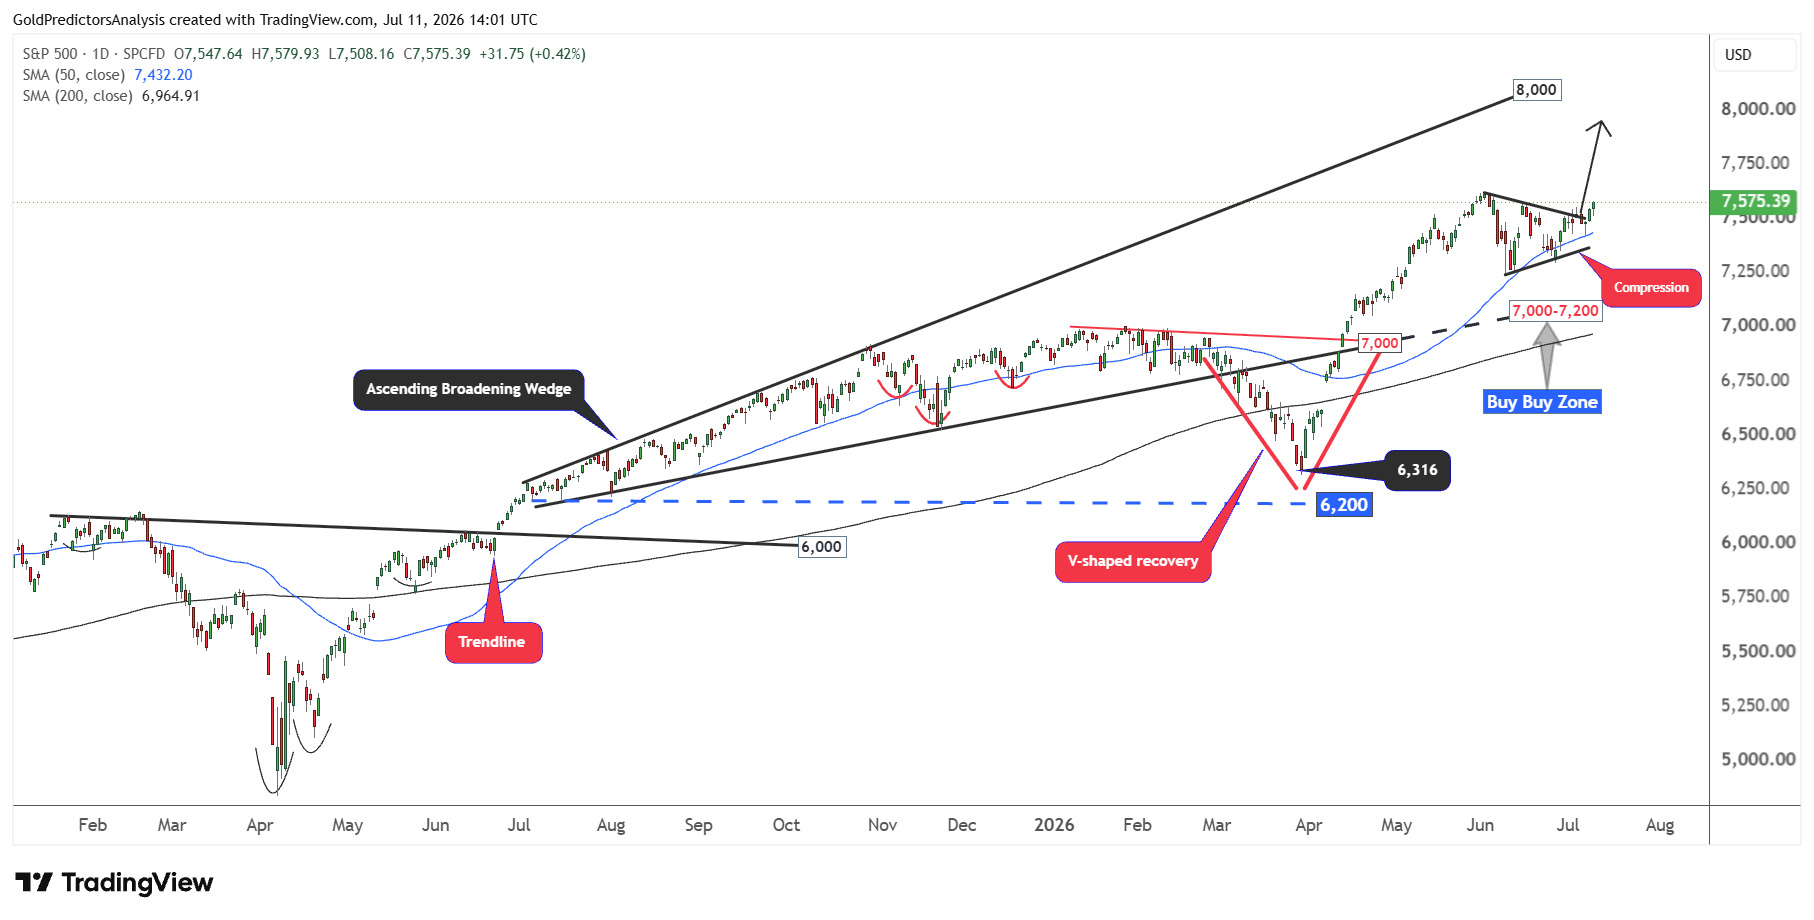
The daily chart for S&P 500 also highlights the bullish trend. The emergence of inverted head and shoulders pattern is followed by an ascending broadening wedge pattern from July 2025. This indicates that the index is moving toward the 8,000 zone.
The index has now broken out of the compression pattern as discussed in the previous article. This compression pattern formed due to the formation of the triangle pattern from the June 2026 peak.
The breakout above this triangle pattern at 7,500 suggests that the rally in the S&P 500 is poised to move toward 8,000. The index also remains above the 50-day and 200-day SMAs which indicates that the short term momentum remains strong.
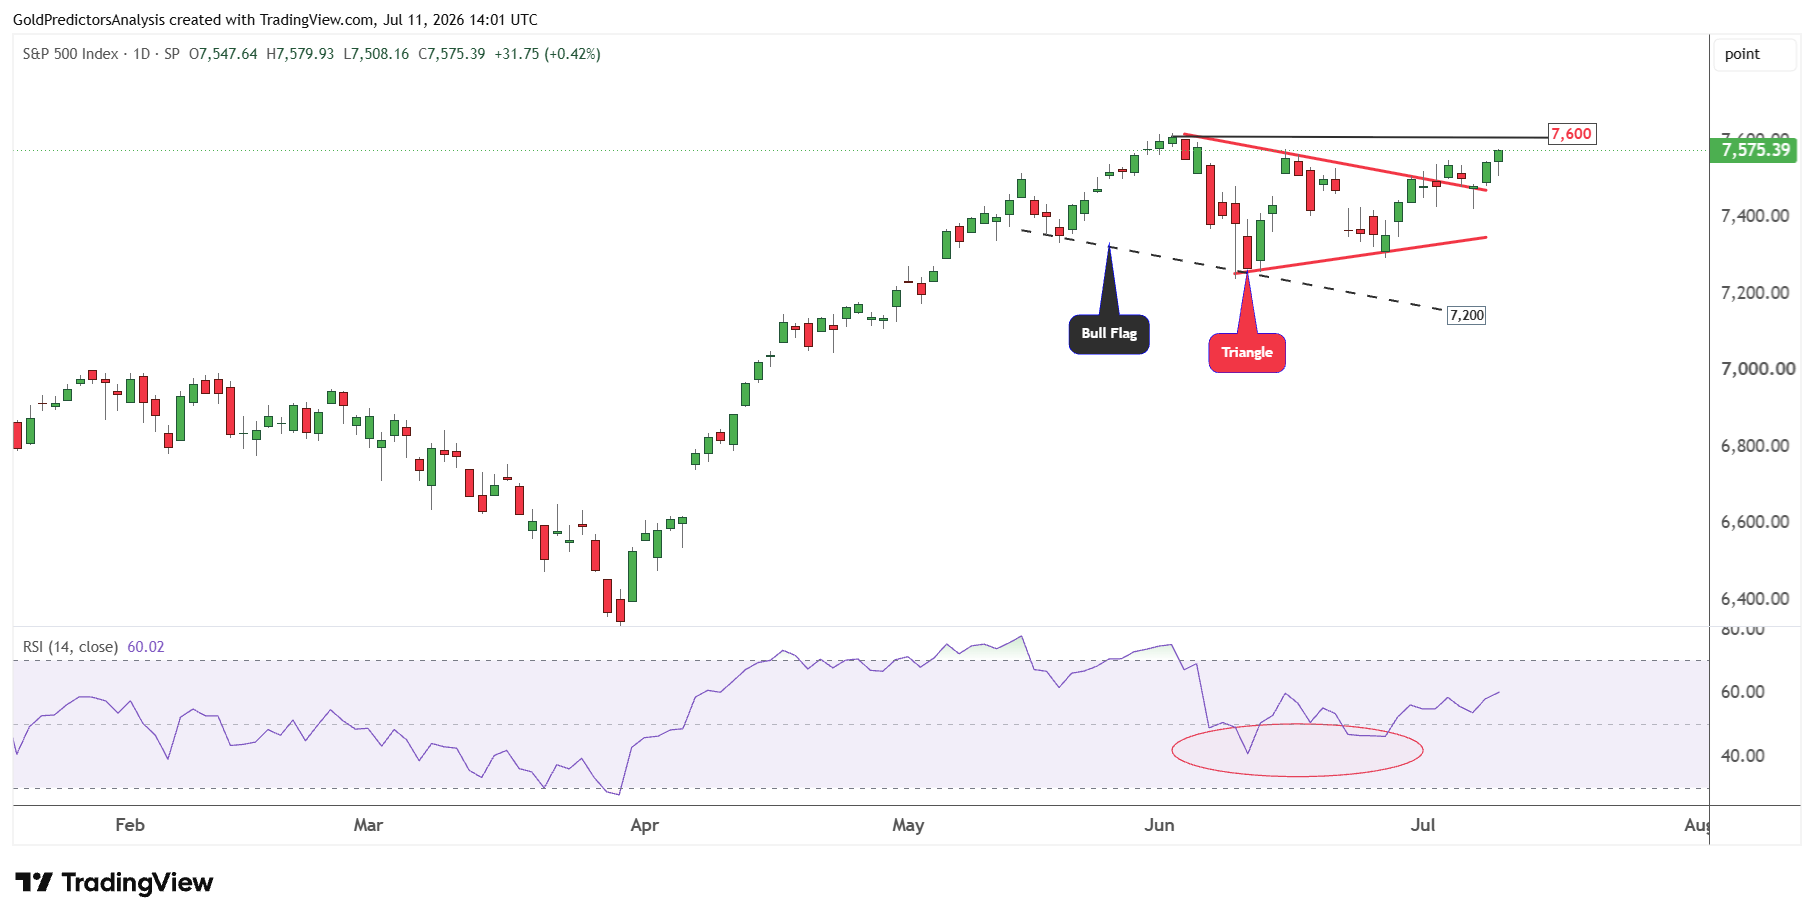
The daily chart also shows the emergence of a price compression pattern in the S&P 500. The similar patterns can also be treated as the bull flag pattern. Both patterns have broken out and the price is moving toward the 7,600 level in the short term. But the strong momentum will likely break this resistance. This suggests that the S&P 500 may gain further upside over the next week.
Bottom Line
Dow Jones and S&P 500 remain in a strong uptrend. AI demand, robust earnings and positive technical momentum could drive further rallies in both indexes. The targets for Dow Jones and the S&P 500 remain 55,000 and 8,000, respectively. But the momentum is overextended which may trigger corrections. These corrections may offer better entry to target their respective targets in both indexes.
The key risks for the stocks remain the tariffs, oil prices, inflation and potential Fed rate increases. The extreme valuations also have little margin of error for weak earnings or negative economic surprises. The key support levels for Dow Jones and S&P 500 remain 50,000 and 7,000, respectively.
Read more: Tariffs Test Rally as Dow Targets 55,000