Support Emerges Near Key Downside Target
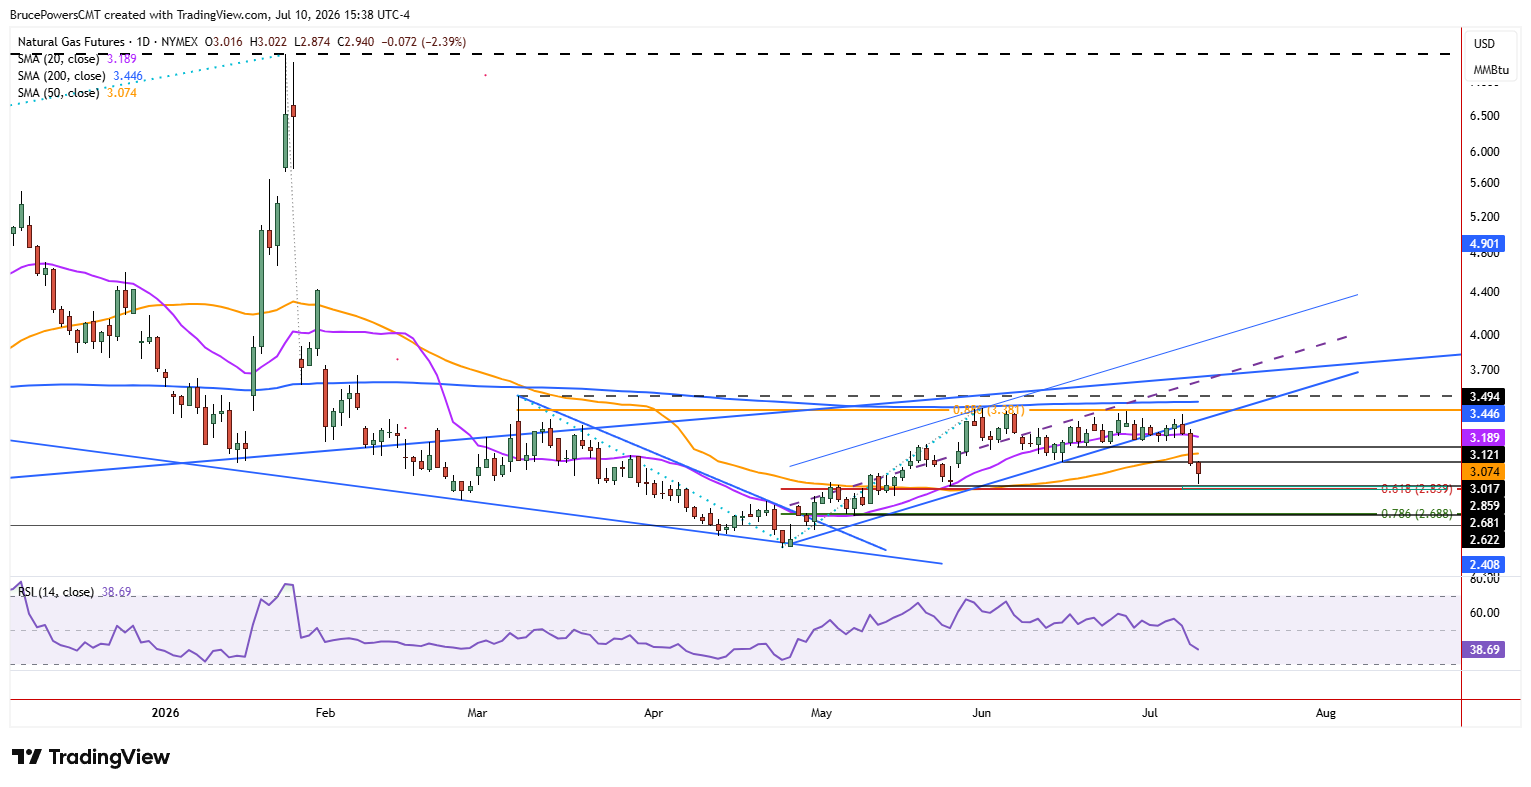
Natural gas almost reached its next lower target zone on Friday, which is near the higher swing low of $2.86 and the 61.8% Fibonacci retracement of the prior advance. The low for the session was $2.87, and that led to signs of support and an intraday bounce. Nonetheless, Friday’s decline broke below the 20-week moving average, which has defined a dynamic support zone for the previous five weeks, thereby confirming weakness on the weekly time frame.
Moreover, the week is set to end with the lowest weekly closing price in seven weeks, further showing selling pressure. Therefore, although support emerged near the next downside target zone, the broader weekly structure continues to favor sellers unless key resistance levels are reclaimed.

Lower High Reinforces Bearish Structure
This week’s decline confirmed the establishment of a lower swing high at $3.40, thereby extending the bearish structure of lower swing highs and lower swing lows that has followed the $7.44 peak in January. The near-term bearish trend reversal signal takes on greater significance given the larger trend structure, since the bearish trend is showing signs of continuing. Therefore, at least initially, rallies are likely to be met by sellers and could lead to another leg down, at a minimum.
Former Support Levels Become Resistance
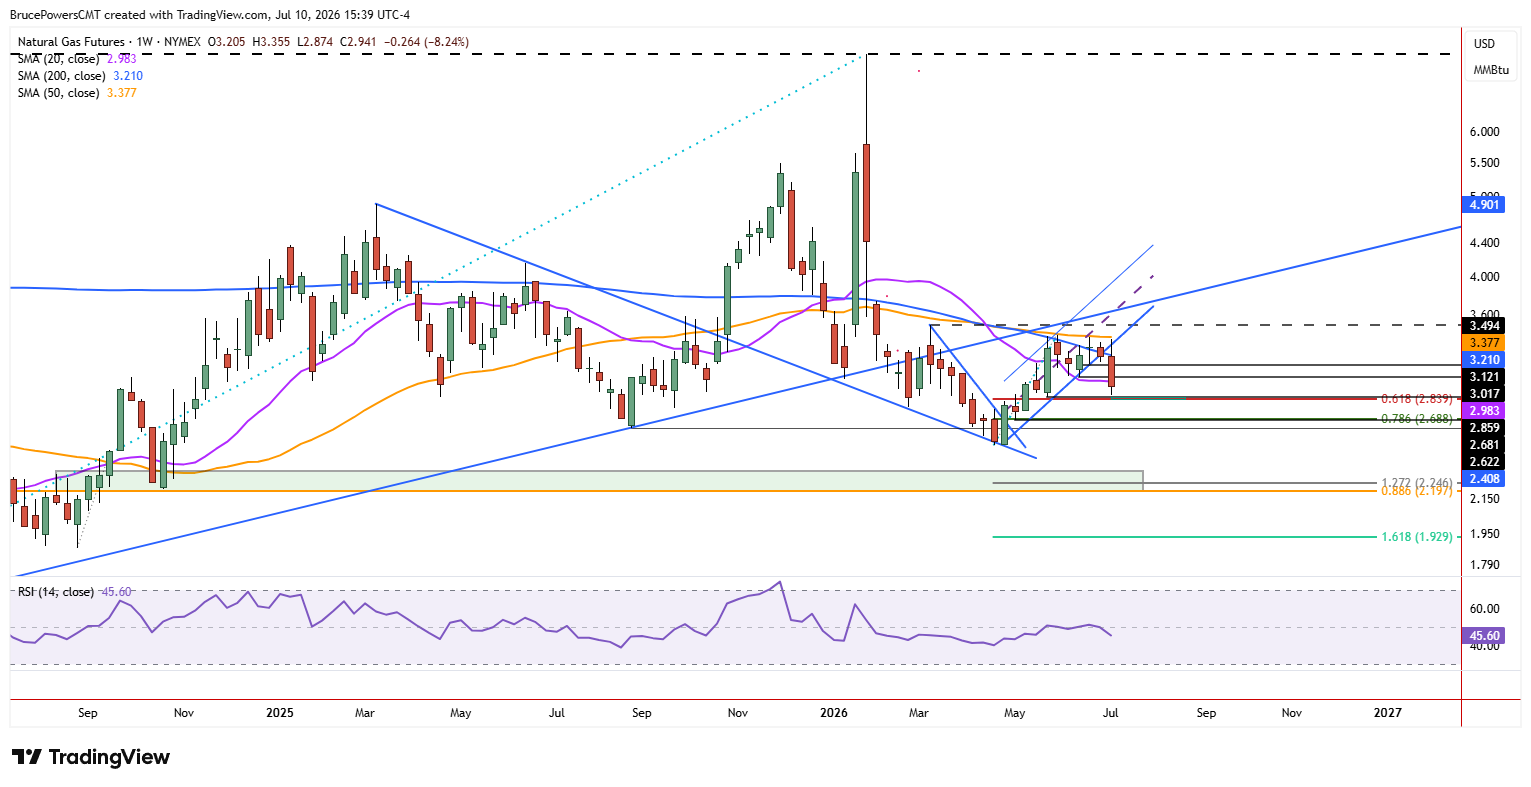
Adding to the bearish outlook is the completed test of prior dynamic trend support as resistance. The two trend indicators are a long-term rising trendline and the 200-day moving average. Support at the 200-day average broke in early February, and it was successfully tested as resistance during the recent advance with a high of $3.40. Regarding the uptrend line, it failed as support in mid-February and the first notable pullback towards that line also ended with the recent high of $3.40. Although the trendline was not touched as resistance, the same dynamic occurred. In both cases, former support areas failed to provide support after the recovery attempt, reinforcing the bearish technical structure.
Next Targets Come into Focus
Once prior significant support is successfully tested as resistance, and that move is followed by weakness and a new lower swing high, the larger bearish trend may be ready to continue. This puts the next lower targets in sight, including the 78.6% Fibonacci retracement at $2.69 and the trend low near $2.50. If a counter-trend rally occurs before a drop below the swing low of $2.99, key potential resistance zones include the prior swing low at $3.02, the 50-day moving average at $3.07, and an interim higher swing low at $3.12. Until those resistance levels are reclaimed, the recent support test near $2.86 remains vulnerable to another downside move toward the lower target zones.
If you’d like to know more about how to trade natural gas, please visit our educational area.