Gold Tests Resistance After Failed Recovery Attempt
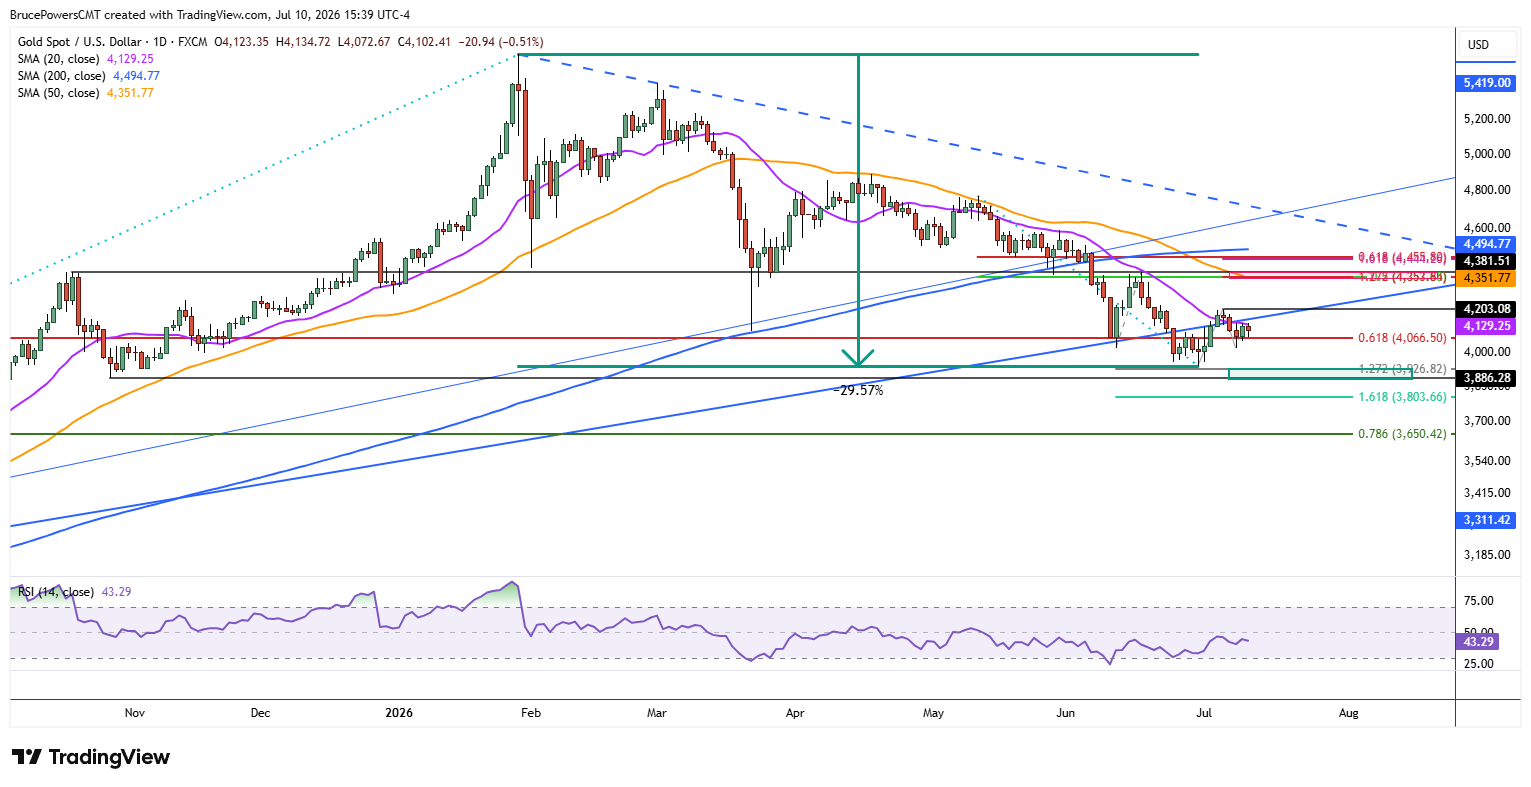
Gold is set to end the week testing key trend resistance at the 20-day moving average and the uptrend line. An attempt to recover both trend indicators occurred last Friday and Monday but by Tuesday gold had failed to advance further and instead weakened, falling back below the trend indicators.
This represented a failed recovery attempt and renewed downward pressure, as the highs from Wednesday through Friday’s session confirmed resistance at the 20-day moving average, slightly below the uptrend line. The inability to reclaim these key trend indicators leaves gold vulnerable to further weakness unless buyers can regain control.

Support Zone Determines Whether Bulls Can Recover
Nonetheless, the recent corrective low of $3,942 was near a potentially significant support zone defined by the higher swing low of $3,886 from October 2025. A decline below that level would provide another bearish reversal signal for the long-term uptrend. Therefore, there remains the possibility of another recovery attempt unless gold falls below the recent low. Holding above this support zone would keep the longer-term bullish structure intact and leave the door open for another attempt to regain momentum.
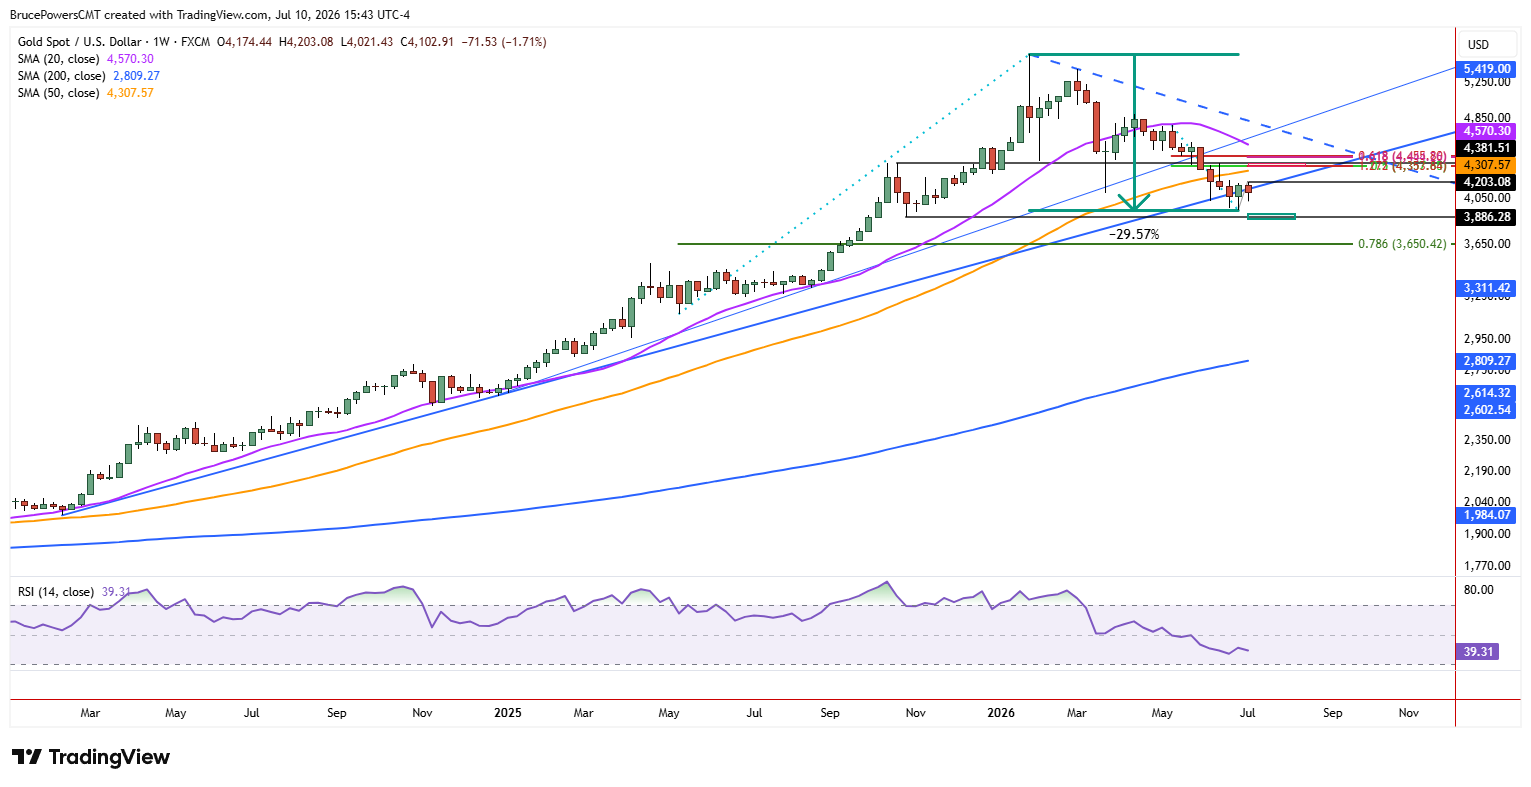
Otherwise, a decline below $3,886 would signal a continuation of the bearish correction and confirm a failure of support at the long-term uptrend line. That line has been in place for over two years, defining dynamic trend support. The other significant long-term trend support indicator, the 200-day moving average, failed as support in early June. That suggests that the trendline is vulnerable to failure as well. A breakdown from this area would therefore represent a significant deterioration in gold’s broader technical outlook.
Lower High Keeps Short-Term Pressure Intact
This week produced a new lower swing high for gold at $4,203, which is now a key component of the near-term bearish trend structure. By itself, that is a bearish indication since it suggests a potential continuation of the declining trend. However, since gold has already corrected by around 29.6% from the $5,597 peak and it remains in a potentially significant support zone, signs of strength could lead to a reclaim of the 20-day moving average and a bullish continuation signal above $4,203. Therefore, the next move will likely depend on whether buyers can defend support and reverse the developing sequence of lower highs.
Bullish Confirmation Requires Key Breakout
A decisive advance above the three-day high of $4,138 will confirm a higher swing low from Wednesday at $4,021 and a reclaim of the 20-day moving average near $4,129. Further signs of strength should follow leading to a continuation signal above $4,203. That would put gold on track to test higher targets, starting around the 50-day moving average at $4,352. Until then, the key question remains whether current support can hold long enough to allow the recovery scenario outlined at the beginning of this analysis to develop.
Gold Price Forecast
Every new Gold analysis as it publishes, today's technical signal and key levels, live price — on one page.
See all Gold forecastsIf you’d like to know more about how to trade gold and silver, please visit our educational area.