Recovery Builds on Strong Technical Support
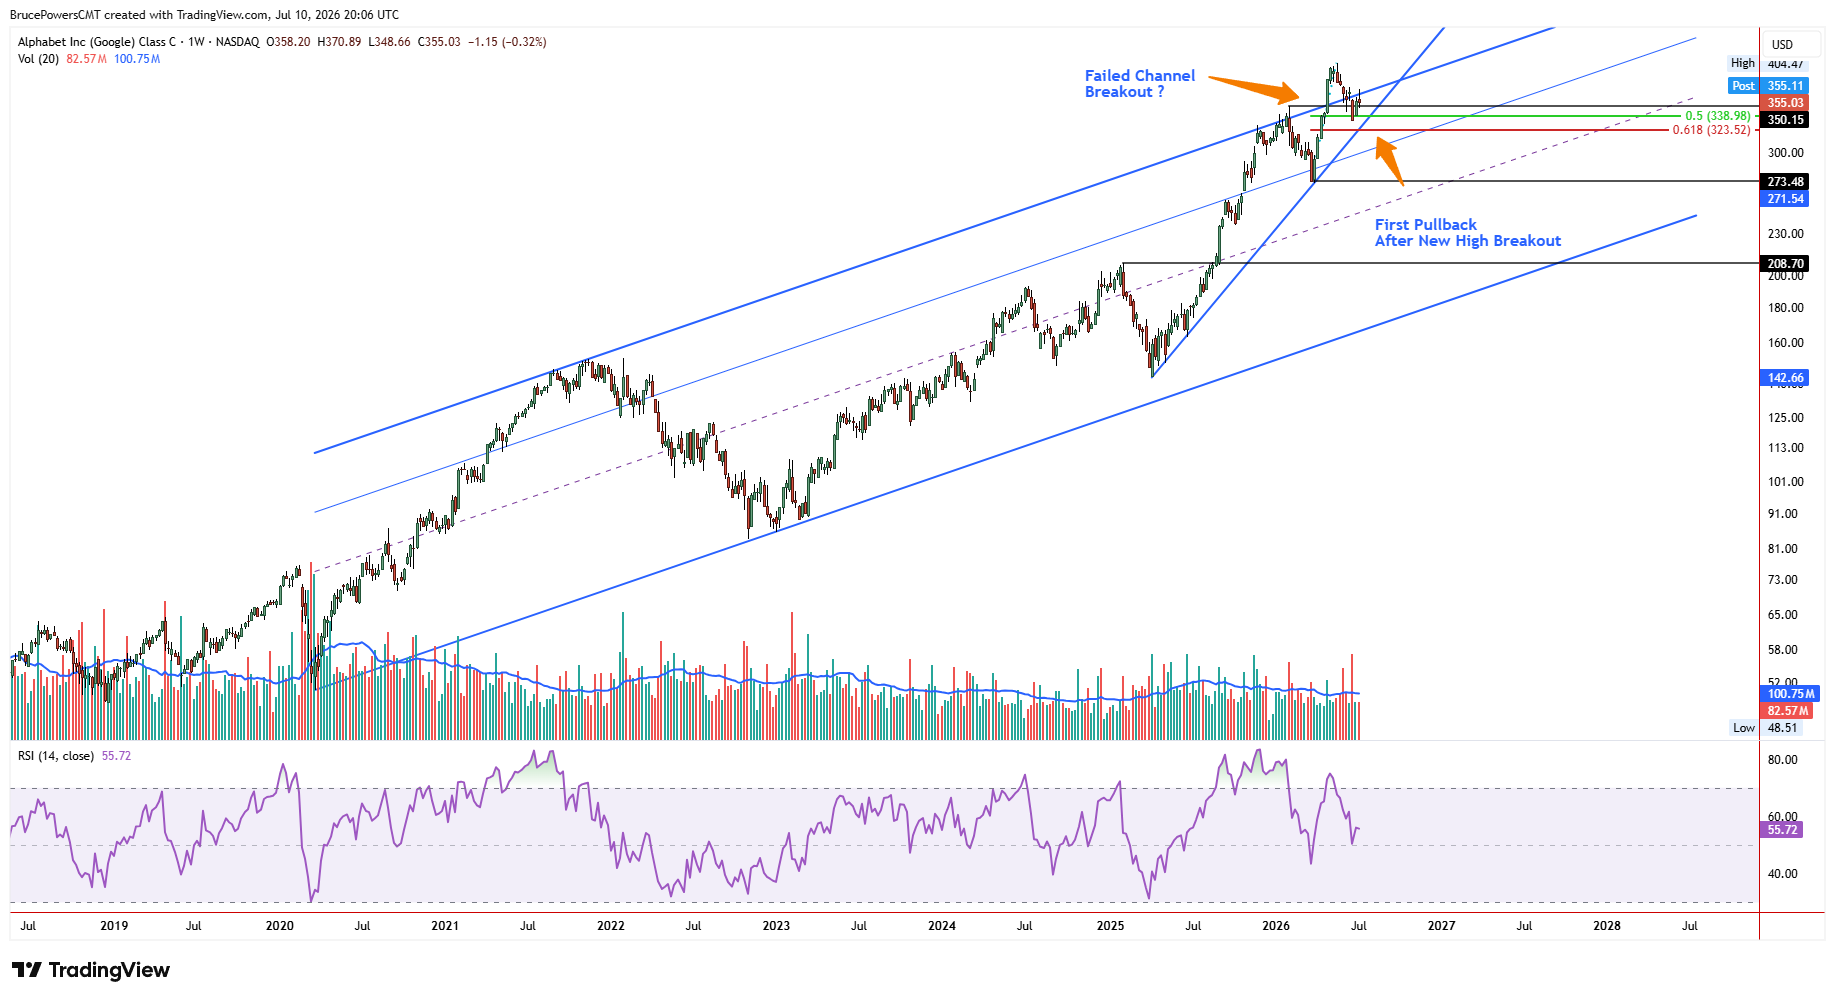
Shares of Alphabet Inc. (GOOG) remain in a bullish position and continue to recover after recently completing their first pullback following the record high of $404.47 reached in May. A higher swing low of $133.69 was established two weeks ago after the stock completed a 50% retracement of the prior advance at $338 while also successfully testing the 100-day moving average, currently near $340.04 and rising. That was the first successful test of support at the 100-day average since it was reclaimed in early April, reinforcing the longer-term bullish structure despite the recent correction.
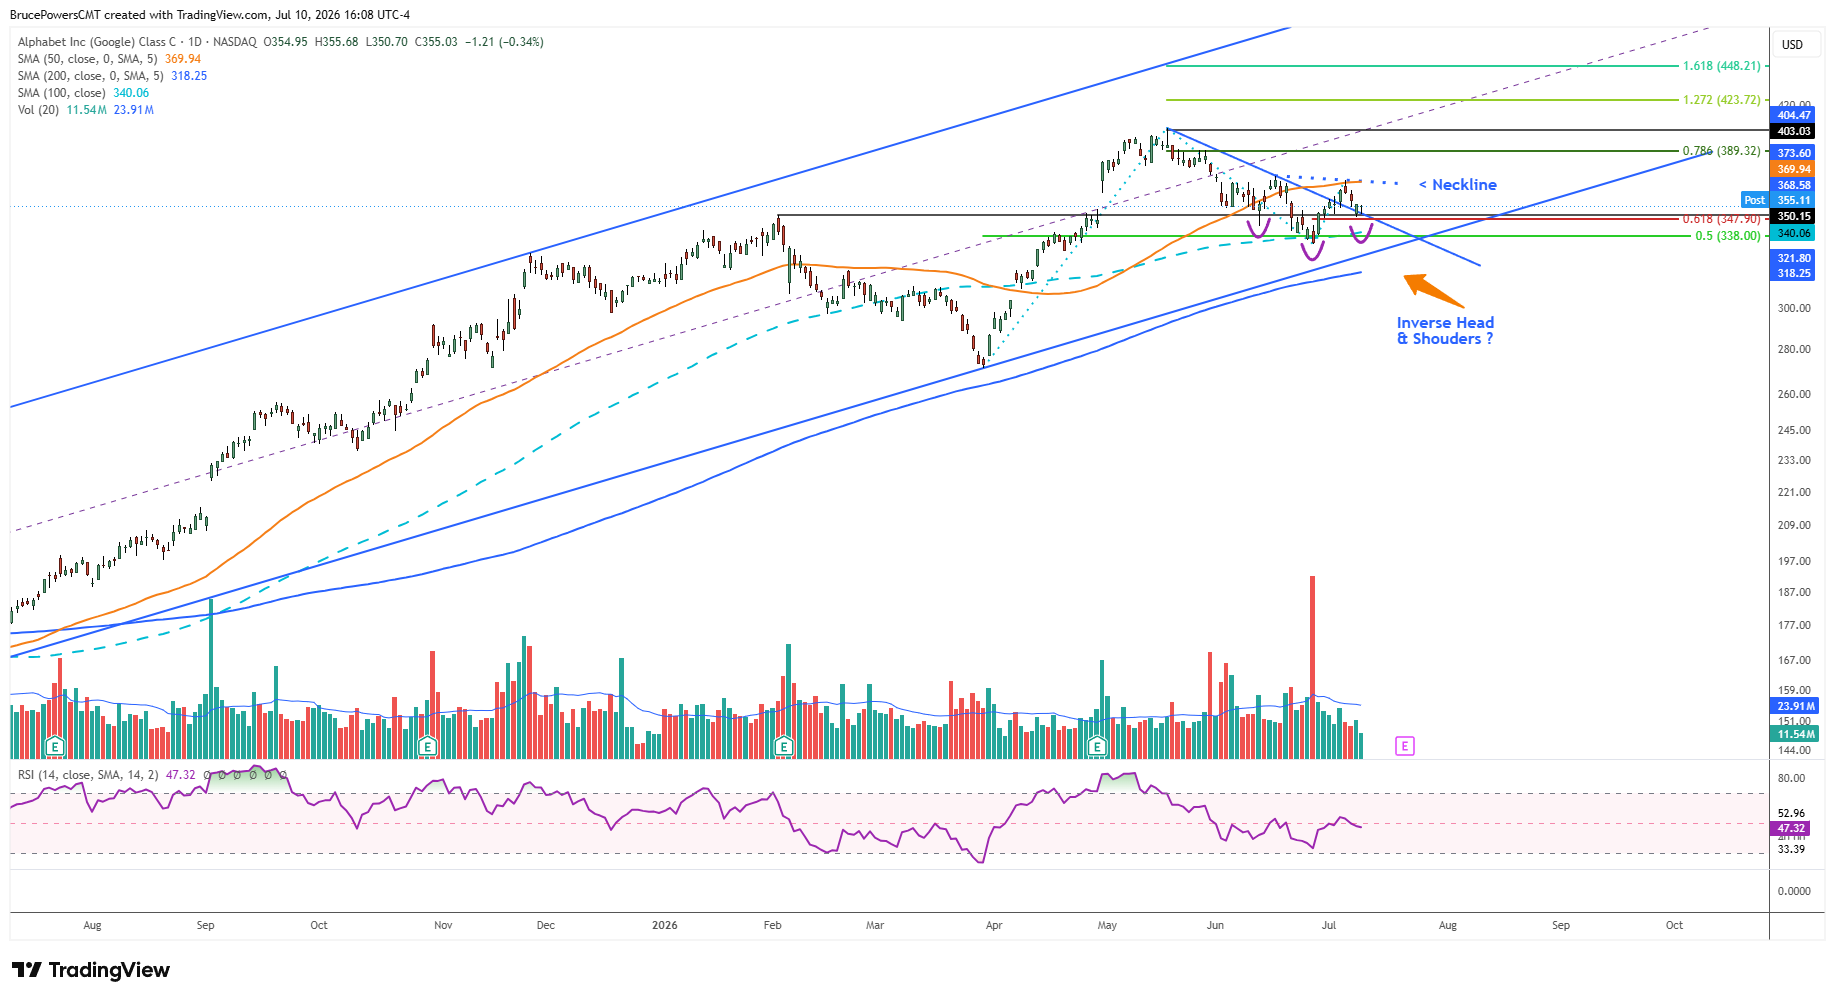
Strength followed the low, resulting in the reclaiming of the prior trend high of $350.15 from February and a breakout above the downtrend line. Resistance was subsequently seen at $370.89, where a slightly lower swing high formed, confirming resistance near the 50-day moving average.

Resistance Zone Holds the Key
The 50-day moving average continues to represent downward pressure, while the 100-day moving average reflects underlying buying pressure. A key confluence of resistance is noted from around $369.89 to $373.60, including the 50-day moving average near $369.89, the new lower swing high of $370.89, and the prior lower swing high at $373.60. The $373.60 level is particularly key, as a bullish trend reversal signal would be triggered by a rise above that level. That would provide additional confirmation that the recent correction has likely ended, and the bullish trend has resumed.
Inverse Head and Shoulders Setup Emerges
Until the 50-day moving average is reclaimed, followed by a recovery of the prior swing high, downward pressure remains and could result in another test of recent support. Nonetheless, there is also the potential for a small bullish inverse head and shoulders pattern to develop. The pullback from Tuesday’s high of $370.89 completed a 61.8% Fibonacci retracement of the prior advance, with a low of $348.66 reached Thursday. The pullback has also tested support near the downtrend line, which previously represented dynamic resistance.
If Thursday’s low is retained, followed by a rise above Thursday’s high of $356.73, a one-day bullish reversal will trigger from the confluence of trendline and Fibonacci support, while a new higher swing low will also be established. That would create a second shoulder of a potential inverse head and shoulders bullish reversal pattern, with a breakout above the neckline at $370.89 confirming the pattern.
Further, although a decline below $348.66 would lead to a deeper pullback, the inverse head and shoulders pattern would remain valid provided a higher swing low is subsequently established above the left shoulder low at $343.63. Whether the stock confirms that pattern or instead extends the correction will likely determine the next significant move, making the developing support zone important to monitor.
If you’d like to know more about technical analysis and how traders use it, please visit our educational area.