


The Nasdaq maintains its strength, but the rally now faces an important test. Liquidity conditions are still positive, credit remains available and softer jobs data has reduced the pressure for a Fed rate hike. These factors support growth and technology stocks. But the picture is not fully bullish. The wage pressure can keep the Fed cautious and weakness in technology stocks may limit the upside momentum. The index is now consolidating near key technical levels. The next breakout may decide whether the Nasdaq extends toward 33,000 or moves into a deeper short term pullback.
Christopher Tahir, Senior Financial Market Strategist at Exness commented:

The Nasdaq continues to reflect a balance between supportive liquidity conditions and uncertainty around the interest-rate outlook. While softer labor market data has eased expectations of further Fed tightening, wage growth and upcoming macroeconomic releases could continue to influence sentiment. As a result, market participants are likely to remain focused on economic data, elevated US Treasury yields, and leadership among large-cap technology stocks aside from the upcoming earnings season.
Liquidity Supports Nasdaq as Dollar Pressure Eases
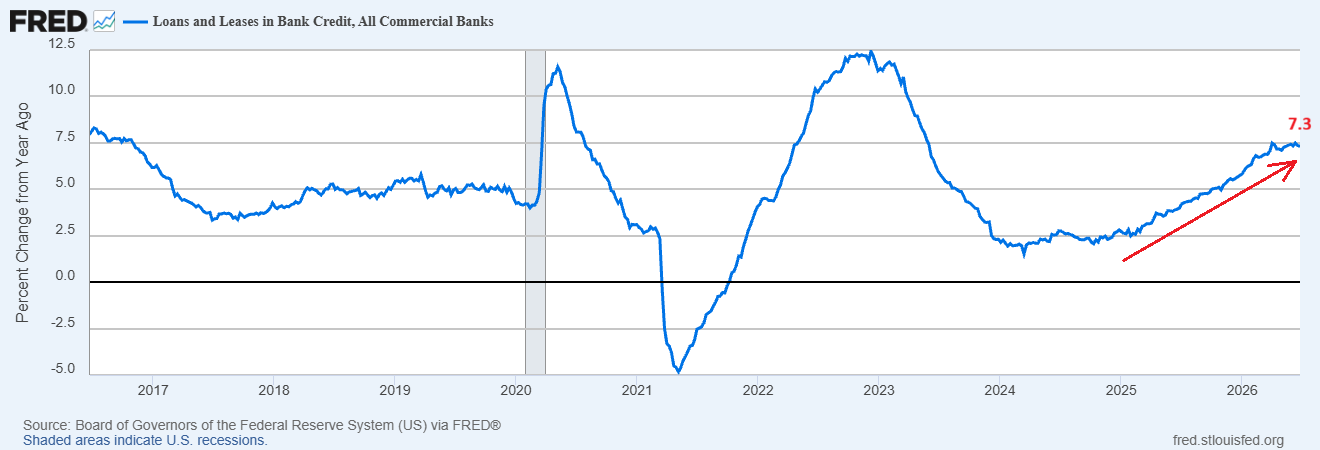
The liquidity in the US stock market remains broadly positive. The chart below shows that the loans and leases for banks in US are rising. This indicates that the credit is still available for businesses and consumers. This is significant for Nasdaq as growth stocks perform better during the times of easy liquidity and steady funding conditions.
Interbank financing is also liquid after several months of the Fed’s liquidity injections. This has helped ease tensions in the financial system. Investors take risks when the banking system is liquid. This environment supports the technology and growth stocks.
But the strength of the US dollar in June created some pressure. A strong dollar acts as a speed brake for global liquidity. It can lead to a decrease in dollar liquidity and make tighter financial conditions for global investors. This is important to Nasdaq because numerous large technology companies rely on international earnings and demand.
The good news is that the US dollar eased last week after the weak jobs data. This drop in US dollar reduces some pressure on the risk assets.
NASDAQ 100 Price Forecast
Every new NASDAQ 100 analysis as it publishes, today's technical signal and key levels, live price — on one page.
See all NASDAQ 100 forecastsWeak Jobs Data Lowers Fed Rate Hike Risk
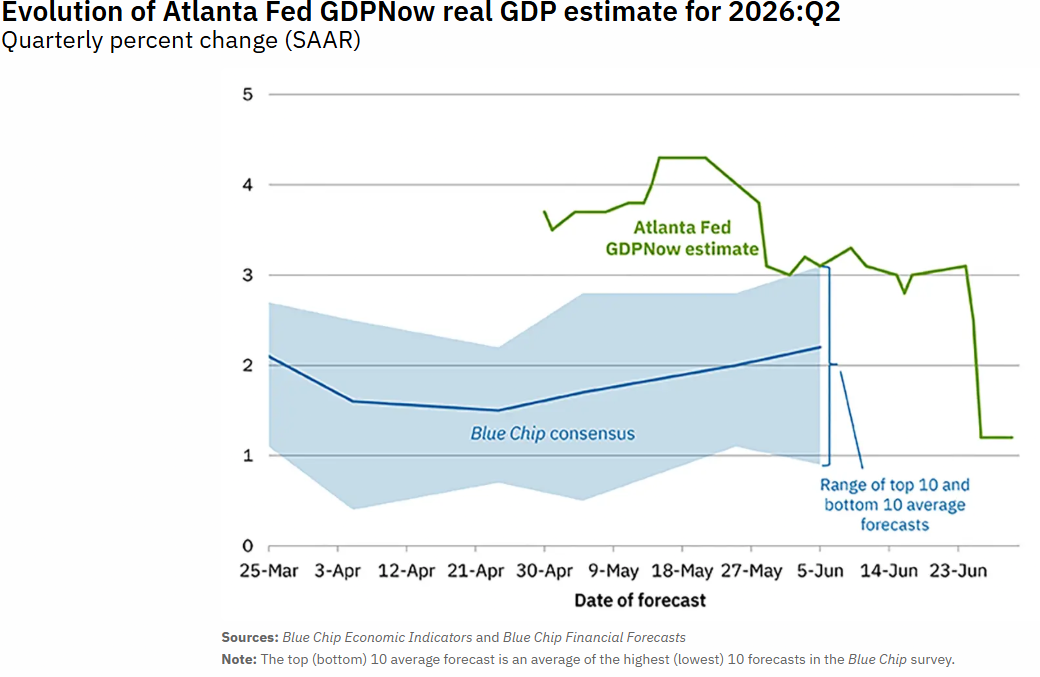
The U.S. economy is sending mixed signals. The Atlanta Fed GDP estimate for Q2 is down significantly. The main reason for this drop is weaker net exports. This does not necessarily represent the domestic demand. But this data indicates that the growth momentum has slowed in some areas.
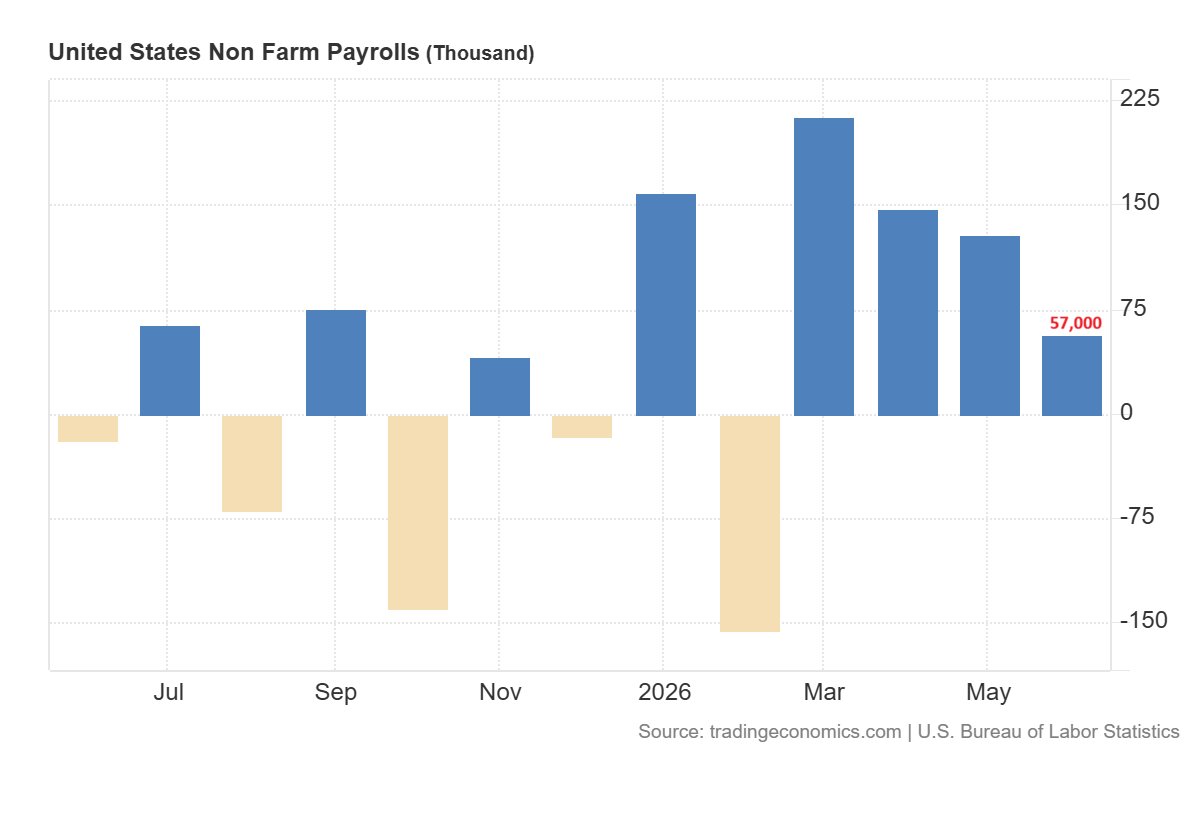
The labor market also looks weaker on the surface. The chart below shows that the job growth in June was disappointing as payrolls increased by just 57,000. This reduces the case for an imminent Fed rate hike in July. This also indicates that the economy is decelerating.
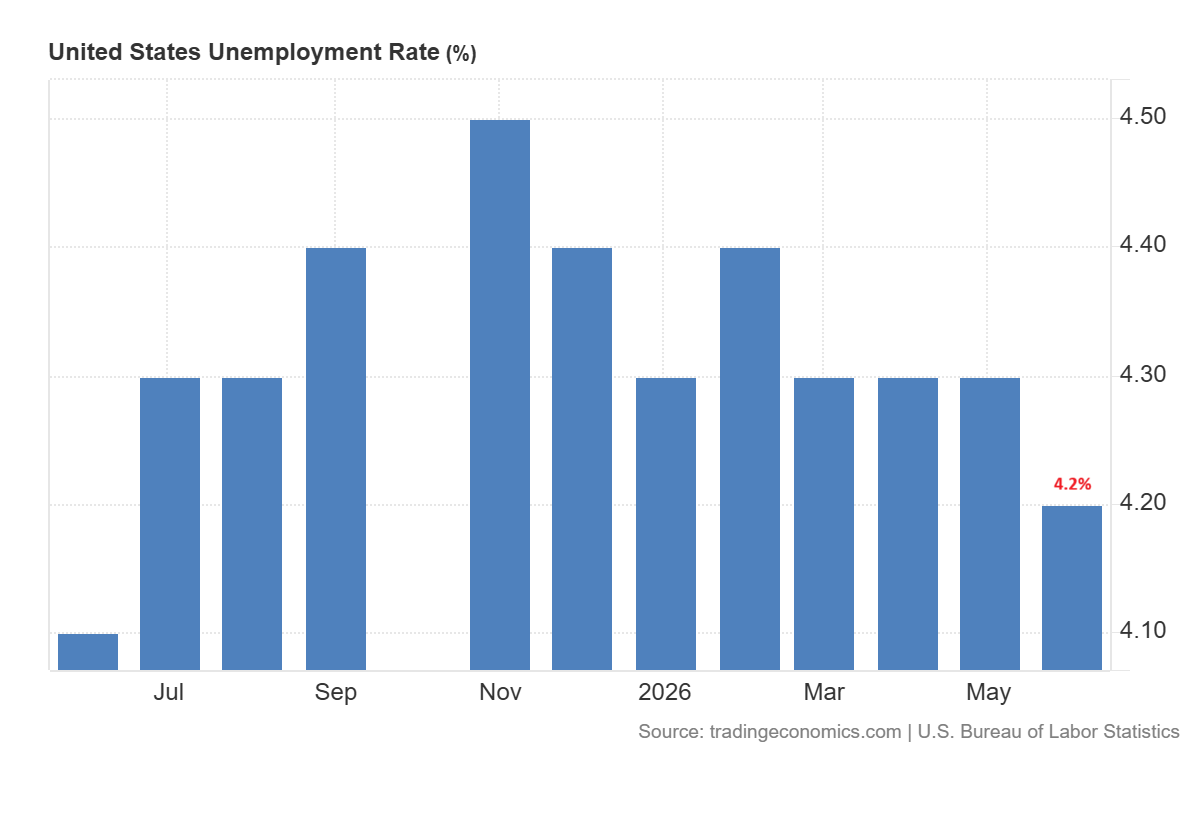
But the jobs market is not entirely weak. The unemployment rate dropped to 4.2%.
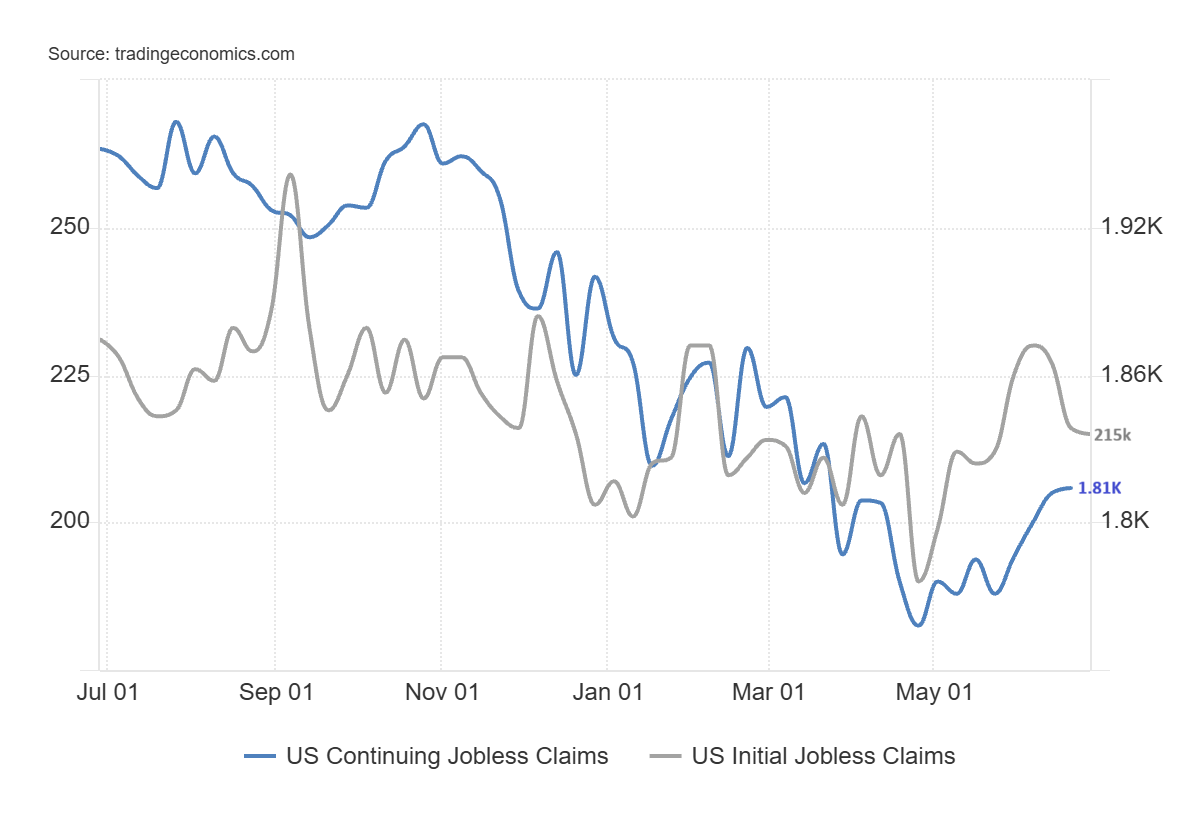
The number of initial jobless claims is still relatively low. But continuous claims are rising. This reflects a longer time for job seekers to secure employment after losing their jobs. That is a very early indicator of consumer spending and confidence in the market.
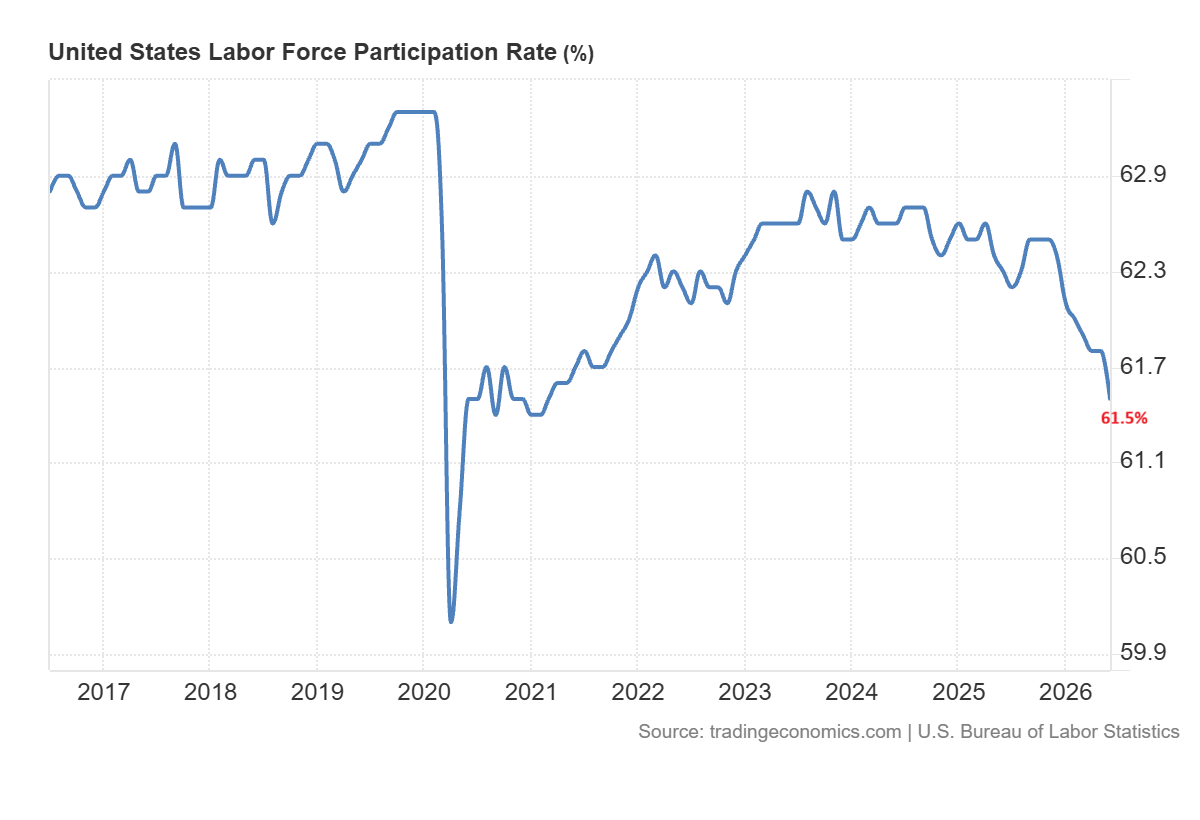
The labor force participation rate has also declined to its lowest level in decades excluding the 2020 pandemic. This may lead to a mixed signal. A smaller workforce might reduce the unemployment pressure, but it could also point to weaker economic participation.
Overtime and Temporary Jobs Show Business Resilience
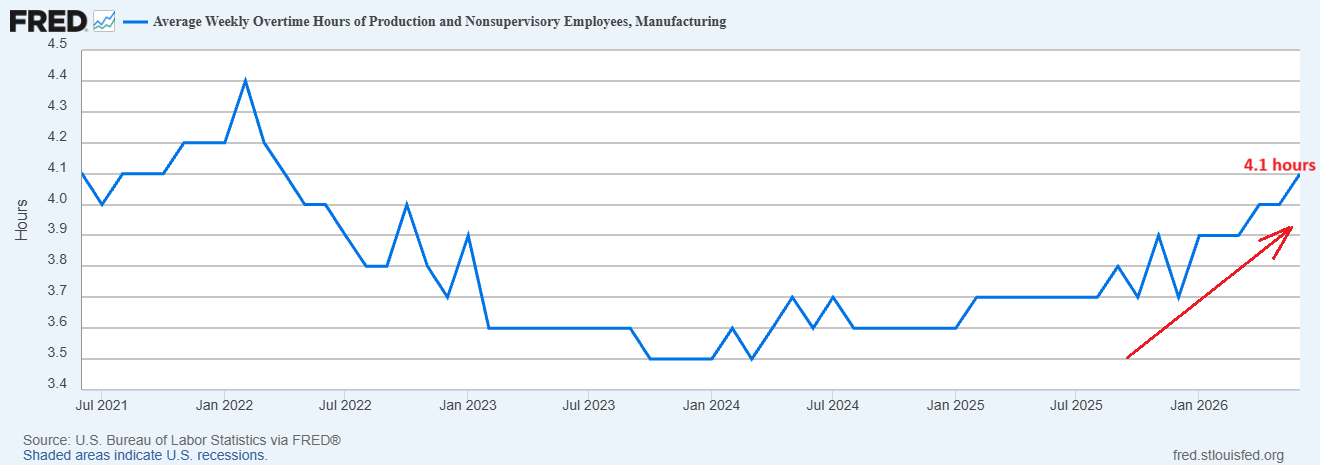
The overtime work hours are increasing. The companies usually increase overtime when demand is still strong but they are not ready to hire aggressively. This suggests that the business activity has not collapsed. The companies are using existing workers for more hours instead of adding new employees.
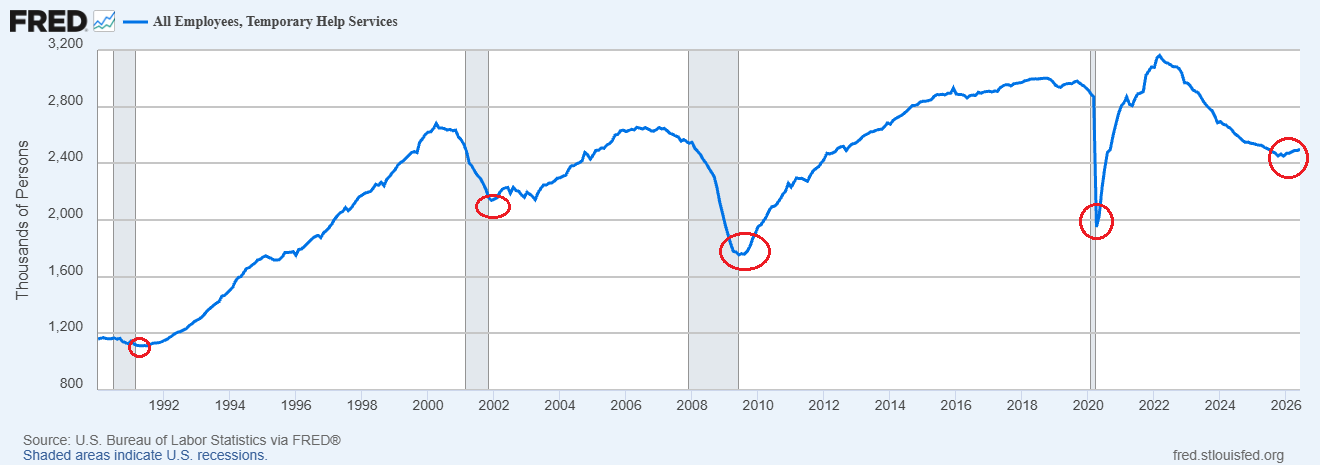
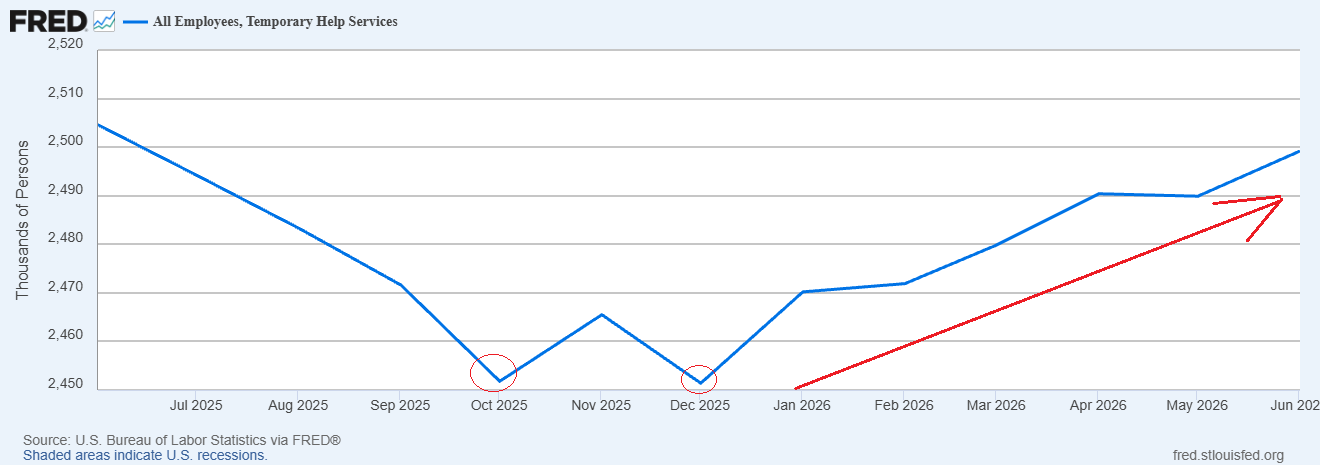
The temporary help jobs are also increasing from the October 2025 low after a long downtrend. This is another leading indicator as companies hire temporary workers before making permanent hiring decisions. The improvement in the temporary help services also suggests that businesses are preparing for the stronger demand.
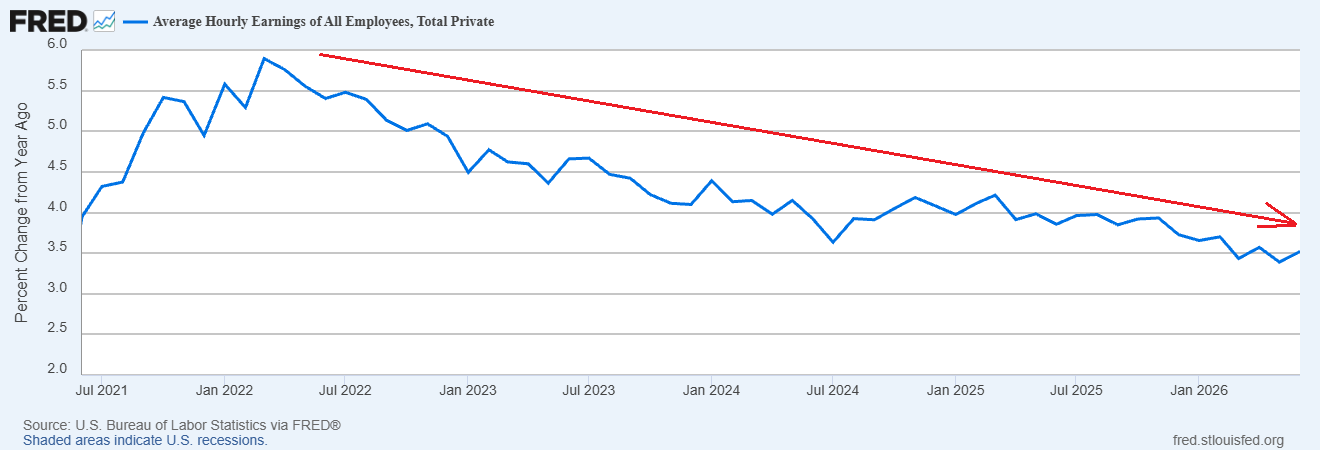
The wage growth indicator is also relevant for the movement in the Nasdaq index. The average hourly earnings growth has been slowing, which indicates that the labor market is not the main driver of inflation. But June saw a positive turn in wages. As long as wage pressure persists, the Fed could remain hawkish for longer. That adds a risk for Nasdaq as higher rates reduce the appeal of long duration growth stocks.
Magnificent 7 Weakness Tests Nasdaq Momentum
The financial markets also send mixed signals. The price of Bitcoin (BTC) has bounced above the significant support zone of $60K. This is crucial as Bitcoin reflects the risk appetites. The chances of sharp declines in speculative assets will decrease if the Bitcoin price remains above this level. This helps bolster sentiment in the Nasdaq in the areas of high growth and technology stocks.
The S&P 1500 Transportation Index remains in a strong uptrend. This indicates that the economy as a whole is getting better. The transportation stocks perform well when goods movement, demand and business activity are rising. This is a bull market indicator for the economy and equity markets.
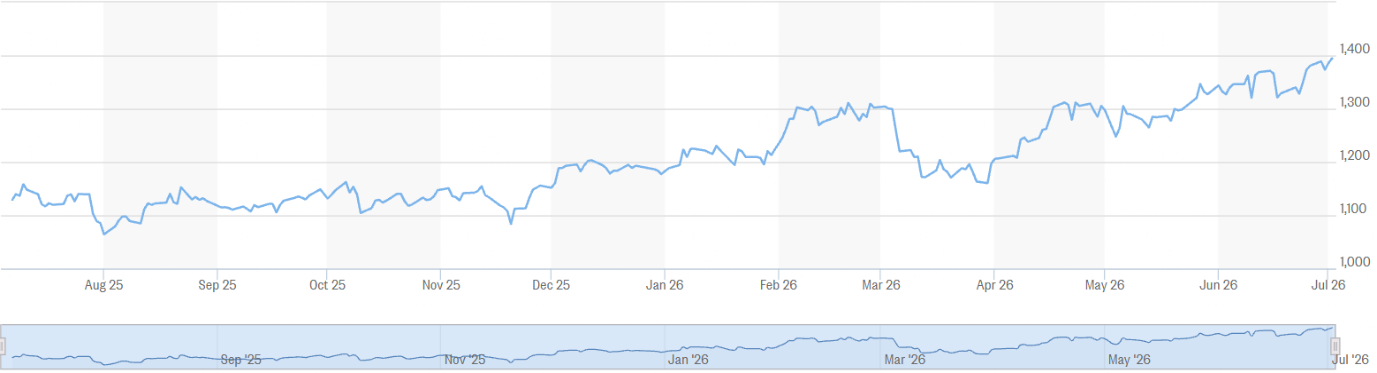
The Dow Jones Industrial Average also marked a new high last week. This is a sign that investors remain bullish on stocks despite recent hesitation.
But the Nasdaq faces a different challenge. The Roundhill Magnificent 7 ETF remains below the key level of 71. This is relevant as Nasdaq is dominated by technology stocks. The Nasdaq could lag the market if these stocks continue to underperform.
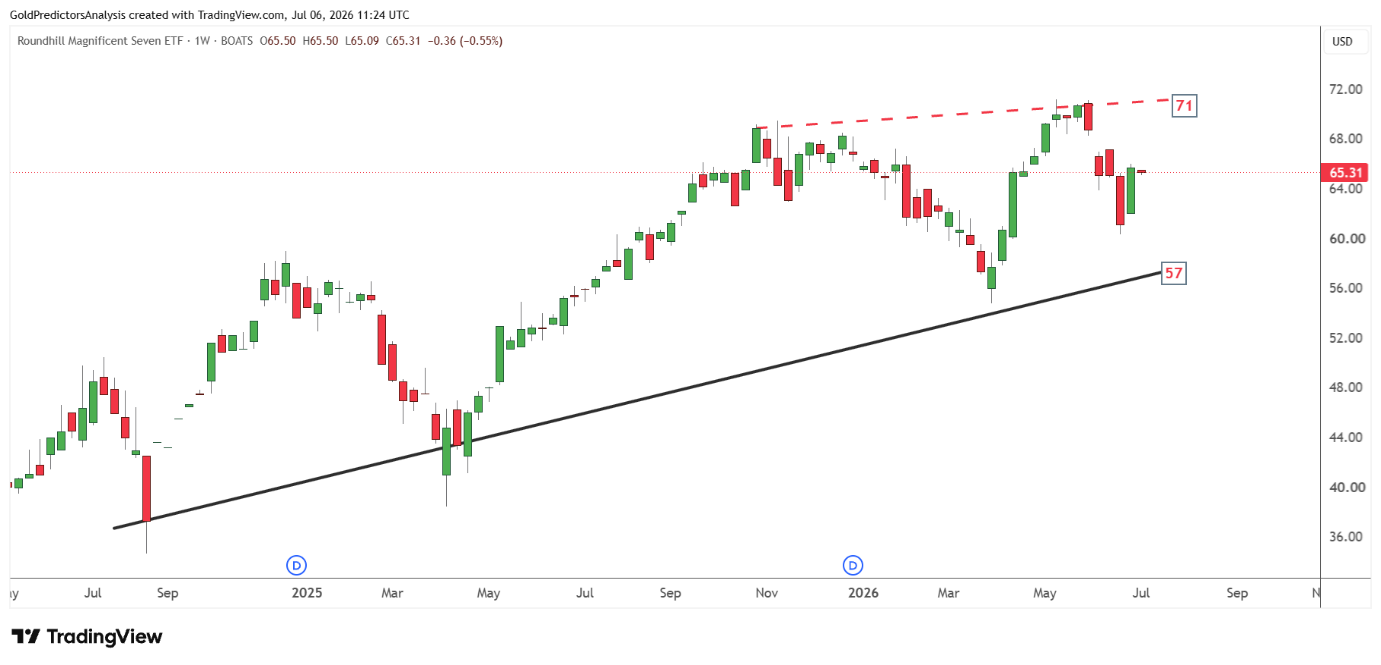
This gives a bidirectional view. Liquidity and a number of economic indicators still point to resilience. But the mega-cap tech stocks must push higher. The chart below shows that Alphabet Inc. (GOOG) and Nvidia Corp. (NVDA) dropped in May and June and remain at lower levels. But the Apple Inc. (AAPL) has already recovered from the June pullback. The next rally in these stocks will likely boost the Nasdaq index.
Nasdaq Eyes 33,000 as Price Compression Builds
From technical perspective, the Nasdaq index has formed a bullish structure since 2025. The index formed inverted head and shoulders pattern from January 2025 to June 2025.
The breakout from this inverted pattern resulted in a strong bullish trend that pushed prices toward 30,000.
The V-shaped recovery in April 2026 also supports the bullish outlook. The index is now forming bullish pennant pattern by consolidating in June 2026. A break of this pattern will likely trigger another move higher toward 33,000.
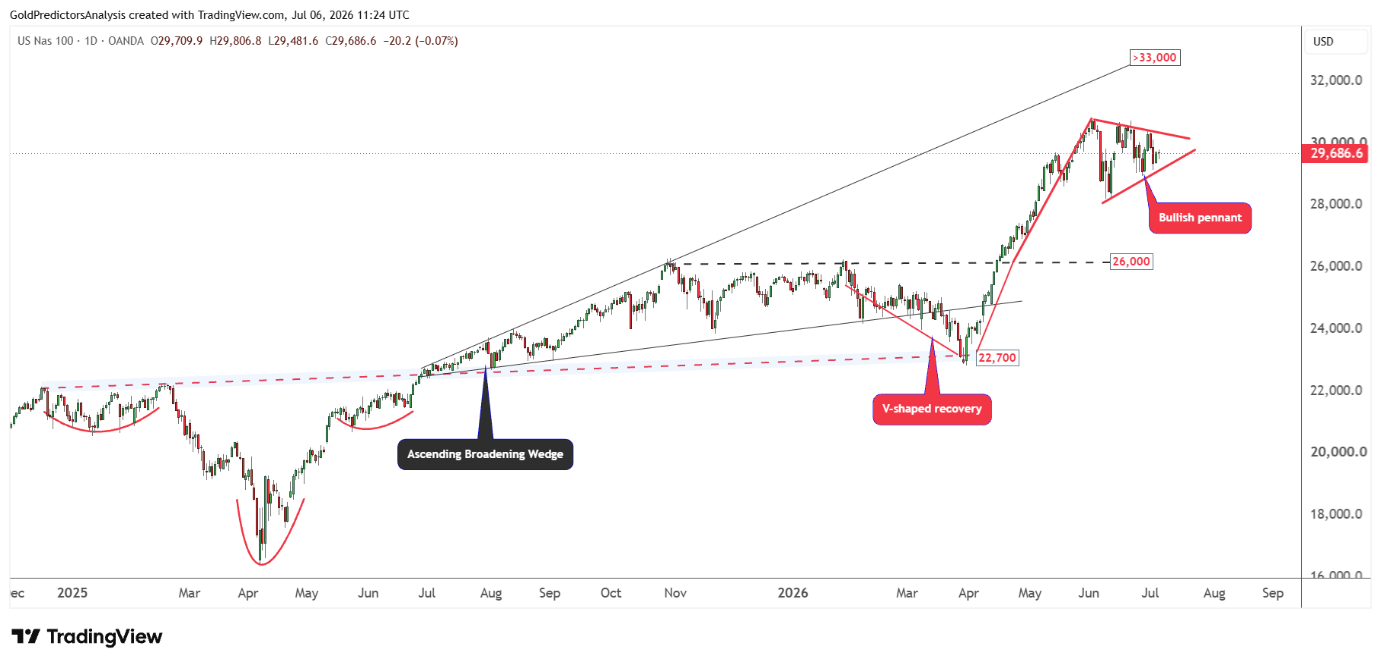
This target is defined by the ascending broadening wedge pattern that is stretched from the July 2025.
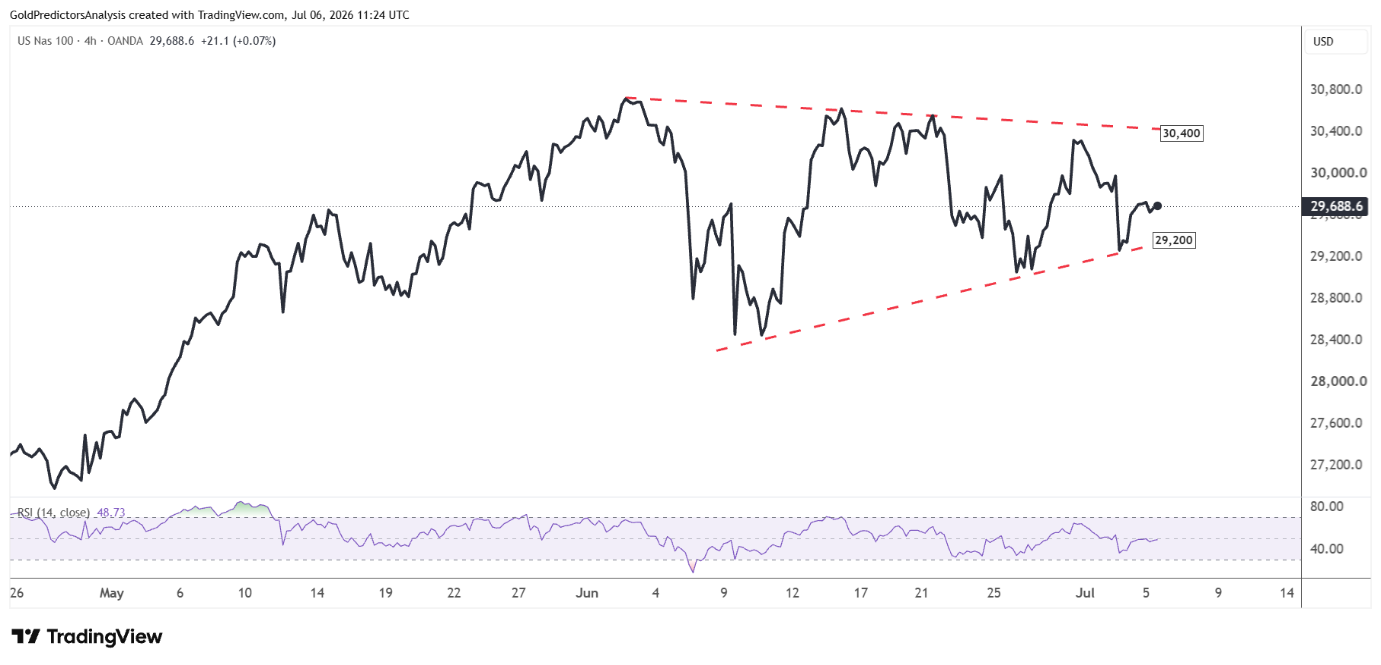
The strong consolidation in June has created the price compression pattern between the 29,200 and 30,400 area. A break of any of these levels will likely trigger the next strong move in the Nasdaq index. A break below 29,200 will push the index to 28,200. But a break above 30,400 will push the index to 33,000.
What to Watch Next
Nasdaq outlook now depends on these three key elements: liquidity, Fed expectations and mega cap technology leadership. The liquidity remains supportive, but the dollar must maintain its pressure, and credit must remain easy. The weaker jobs data reduced urgency for the Fed to raise interest rates. But the wage growth can keep the Fed cautious. This means that Nasdaq may continue to react strongly to the changes in the labor data, inflation expectations and Treasury yields.
From technical perspective, the index is compressing between 29,200 and 30,400. A break above 30,400 could signal a resumption of the bull trend towards 33,000. But a break below 29,200 could continue to correct towards 28,200. Nasdaq presents a bullish outlook, but the next move will likely depend on the breakout of these levels.


