
Market Overview
As of July 13, oil markets are weighing OPEC+ adherence to quotas while non-OPEC production expands, mainly from U.S. shale areas. Refinery utilization is higher than usual with the summer driving season increasing oil product demand, and inventories at major storage locations shifted slightly, in line with supply and offtake levels.
In the U.S., the latest data showed only a marginal net change in oil stocks with operational crude inventories at major hubs positioned near working minimum levels while demand for refined products is steady with economic activity.
Natural gas markets in the U.S. are supported by high production, with dry gas output reaching record highs fueled by associated gas from oil production and dedicated gas plays. LNG export demand is robust with significant volumes shipped to global markets, while natural gas inventories increased during the injection season with working gas levels positioned above historical averages. Power sector demand fluctuated with weather patterns while industrial use remained steady, suggesting strong domestic supply and demand fundamentals as of July 13.

Natural Gas Futures Hold $3.008 – Upward Trendline Breakout on 4h
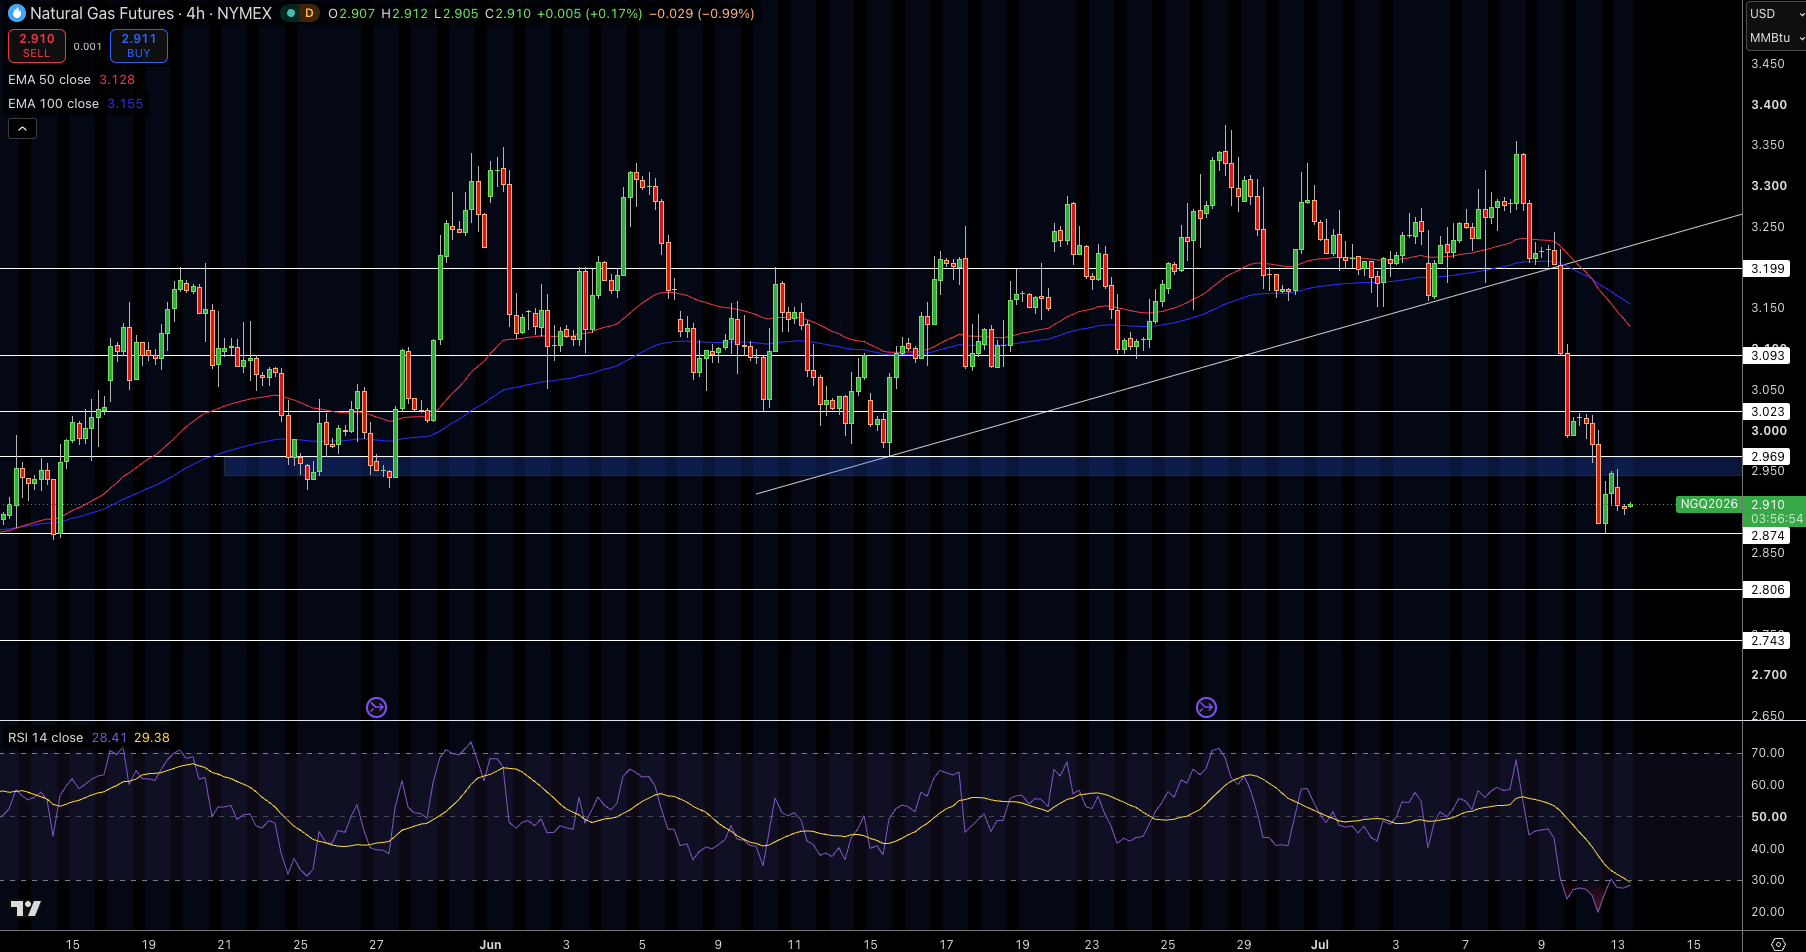
On the 4-hour NYMEX time frame, natural gas futures are priced at $3.008. Alternating bars tried to punch above the trendline rising at $3.099 after plunging off the $3.377 top, with bullish wicks and higher lows suggesting that the buyers are accumulating stock. With an RSI value of 28, we have an oversold situation.
According to the volume profile, $3.00 to $3.12 is a strong accumulation zone, and the 50 EMA around $3.187 continues to act as a cap on the upward move. Currently, the market is neutral to bullish above $3.00, within the context of the wider trading range, where a series of higher lows continues to attract buyers on dips.
Based on the current technical outlook, I would consider a long position around $3.008, targeting $3.20, with a stop below $2.97.
WTI Crude Oil Holds $74.65 – Fibonacci 0.236 Retest on 4h
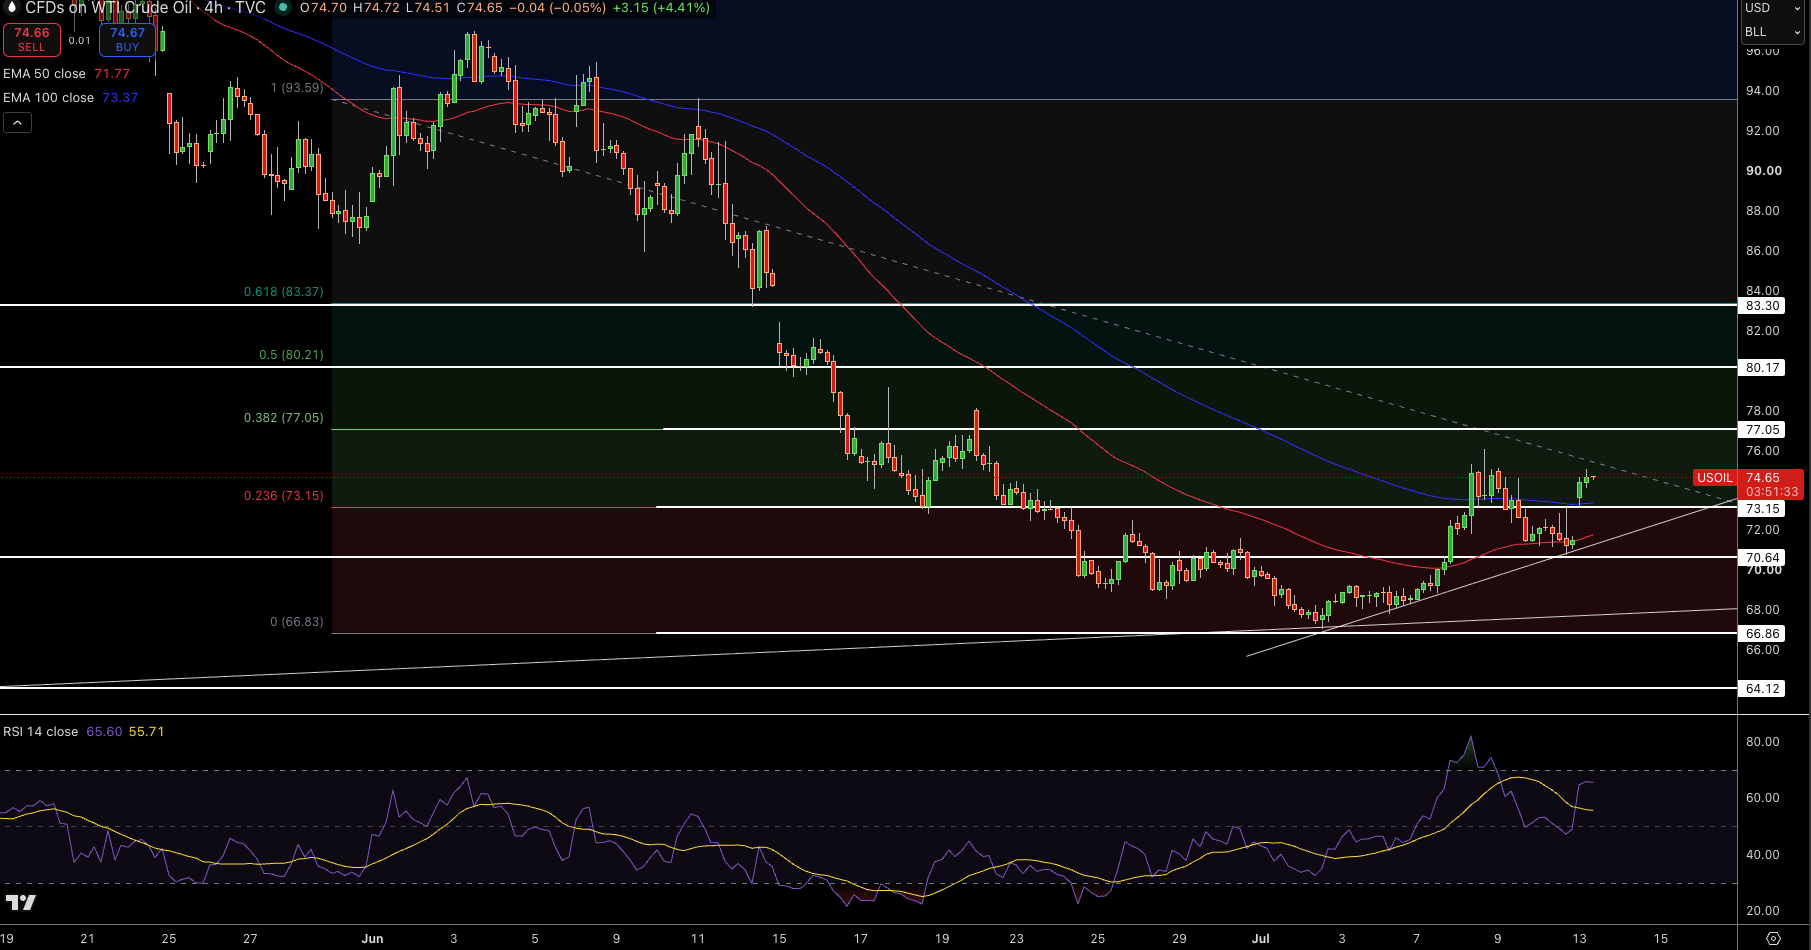
Trading at $74.65 on the 4-hour timeframe, WTI recently retested the 0.236 Fibonacci level at $73.15 following a steep drop from the $93.59 peak, characterized by alternating green and red bars. While the price action below this level is being distributed and the price holds the 50-period EMA at $71.42 (confirmed by a series of bearish candles forming lower highs), the RSI sits at 53, marking it as neutral.
Natural Gas Price Forecast
Every new Natural Gas analysis as it publishes, today's technical signal and key levels, live price — on one page.
See all Natural Gas forecastsThe volume profile highlights a significant support zone between $73.15 and $77.05, with the next resistance area located in the $80.21 to $83.37 band. Currently, the market is neutral to bearish under $77.16, which is in the context of the overall downward movement from the $110 top, as a series of lower highs continues to draw in sellers during the rallies. Sell at $74.65 for a $66.83 target with a stop at $77.05.
Based on the current technical outlook, I would consider a short position around $74.65, targeting $66.83, with a stop above $77.05.
Brent Crude Oil Holds $78.33 – EMA 50 Defense on 4h
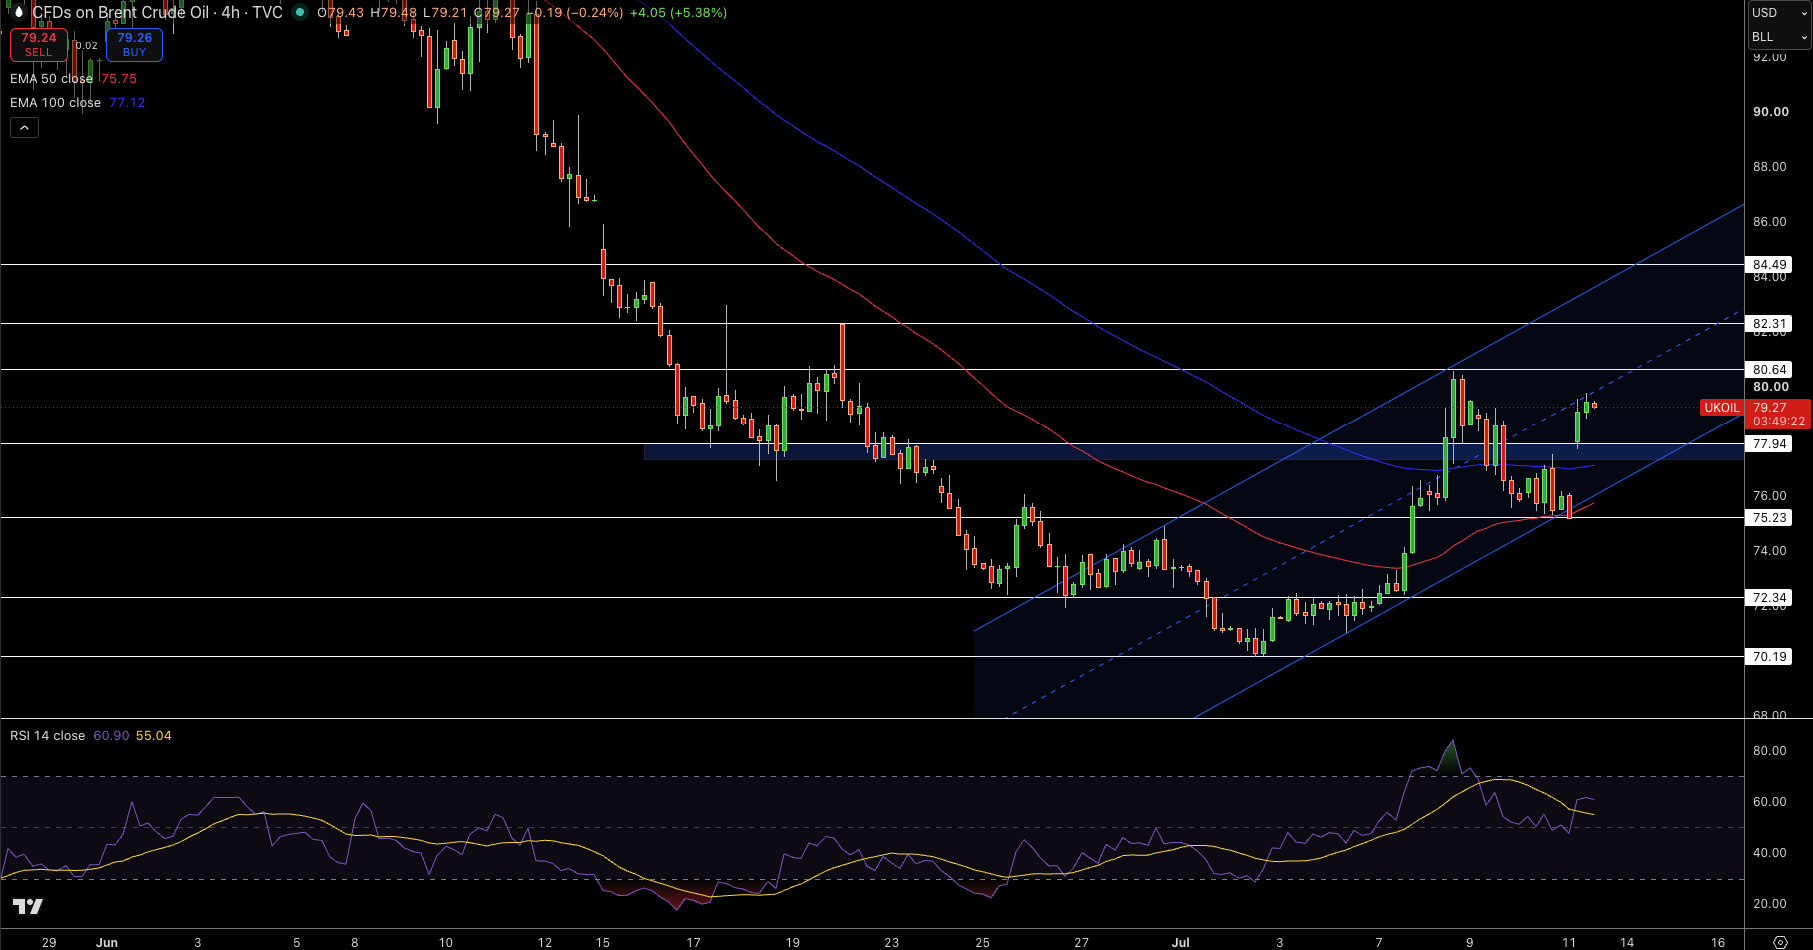
Brent is trading at $78.33 on the 4-hour chart. Alternating bars are defending the 50-period EMA at $75.21 following a rejection at the 100 EMA around $77.08, and while bullish wicks indicate buyer support at this level, the series of higher lows remain undisturbed. At an RSI reading of 52, the market is currently neutral.
The volume profile indicates a fair value zone in the making between $76 and $77, while resistance sits on the $77.94 to $80.30 range. Despite the larger downtrend, the market is neutral to bullish as long as it trades above the 50-period EMA, as a series of higher lows continue to attract buyers on dips.
Based on the current technical outlook, I would consider a long position around $78.33, targeting $77.94, with a stop below $75.21.