
Precious Metals Fundamentals Supported by Central Bank Demand and Supply Limits
As of July 13, the gold and silver markets are being propped up by continued central-bank buying and only tepid expansion of primary mine supply. The World Gold Council’s latest survey found 45% of central banks plan to buy for their own account in the next 12 months, and 89% forecast official-sector reserves to rise. This sustained official-sector demand has provided a steady market underpinning as global levels of sovereign debt remain elevated and central banks increasingly diversify away from traditional investment assets.
New supply growth has been limited. Gold mine production has increased only modestly in recent years, partly due to maturing deposits and increasing costs to develop new resources, and although silver byproduct production plays an important role, supply is still being hampered by these same pressures, despite some offsetting effects from increased recycling. Silver has a unique demand profile given its growing use in industrial fabrication, where demand from solar, electronics, and electric-vehicle demand is growing in line with the global energy transition.
Demand also reflects the role of both metals for portfolio investment, including via exchange-traded products and physical holdings. As noted above, macro events such as the inflationary pressures and changing outlook for interest rates following last week’s U.S. labor data will continue to have a bearing on demand positioning in the foreseeable future, while global sovereign debt issuance and the global energy transition will also support structural demand drivers across the metals’ sectors.

Gold Spot Holds $4,059 – Symmetrical Triangle Breakout on 4h
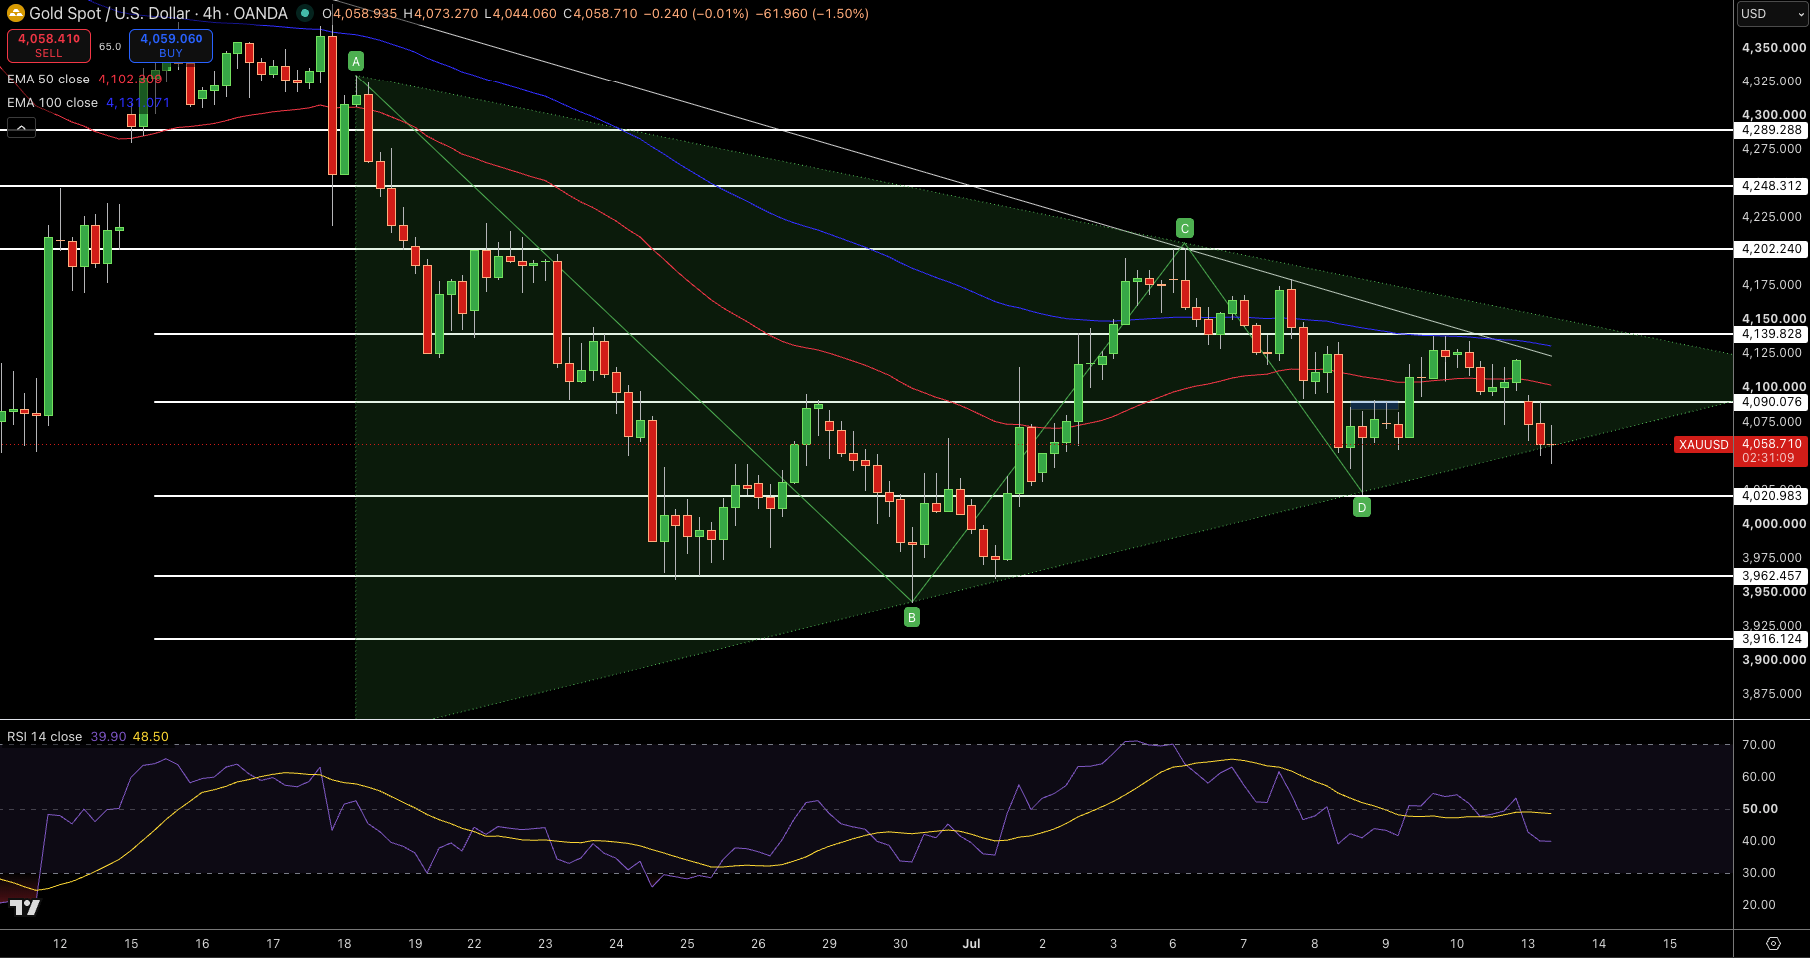
The precious metal is currently trading around $4,059 on the 4-H chart. Alternating green and red bars tried to push through the symmetrical triangle’s resistance at roughly $4,091 while standing above the triple-bottom support near $3,959. On this chart, the bullish rejection wicks and rising lows reflect the absorption by buyers.
The 50-period EMA in blue, near $4,107, remains a major resistance to the upside. At a $4,059 price level, momentum is slightly on the neutral side, as signaled by the 40 reading on the RSI. The volume profile is also a great measure, with $4,000 to $4,091 being a very dense accumulation range.
The price range from the previous $4,597 highs is forming a downtrend channel, and the price is testing the $4,091 resistance point of the breakout. However, the price is also forming a higher lows pattern, and the Fibonacci’s confluence level also supports the short-term price.
Based on this technical outlook, I would consider a long position around $4,059, targeting $4,140, while placing a stop below $4,091.
Gold Price Forecast
Every new Gold analysis as it publishes, today's technical signal and key levels, live price — on one page.
See all Gold forecastsSilver Spot Holds $58.00 – Fibonacci 0.236 Defense on 4h
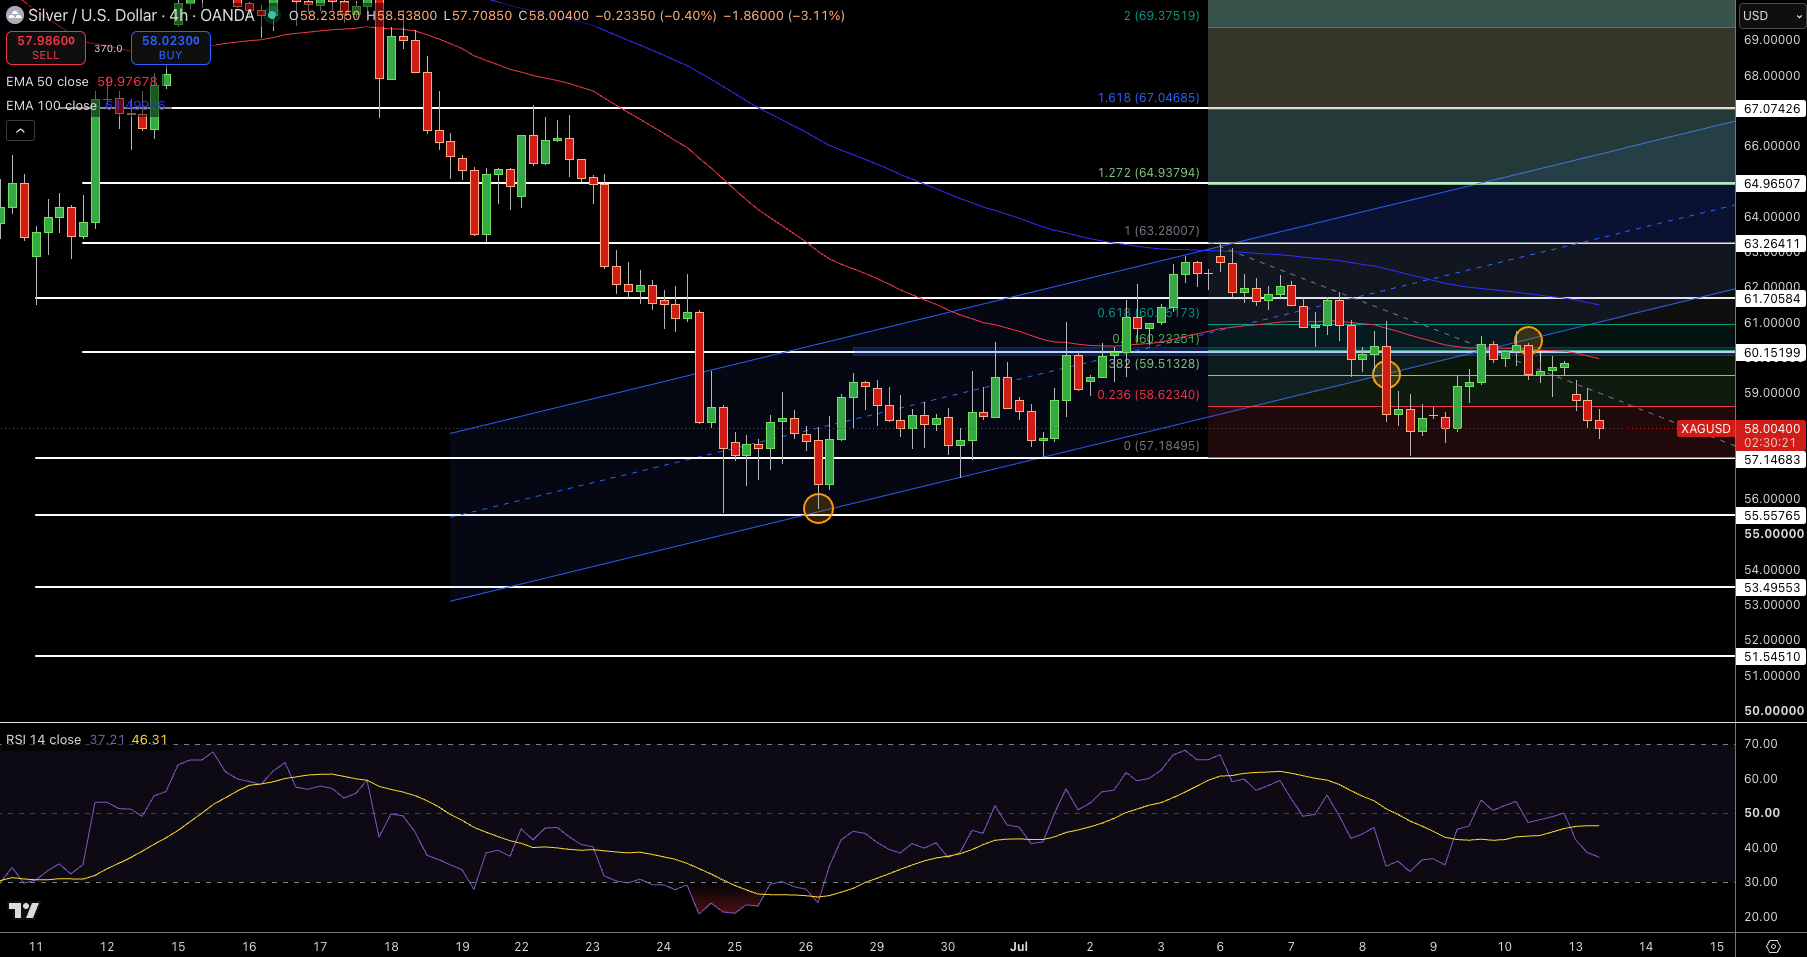
Meanwhile, the silver is trading $58.00 on the 4-H chart. The alternating bars are testing the Fibonacci 0.236 at roughly $58.62 after a significant drop in price from the $69.85 high. Bearish red bars with lower highs indicate distribution with the level in support. The MA in red, at roughly $62.81, remains a major resistance to the upside. At $58.00 momentum is neutral to the downside.
This is seen from the 37 reading on the RSI. The volume profile has the $57 to $59 price range as a good zone in support. It also has been the price range that has been the resistance in the downtrend after the $69.85 highs and has remained neutral to the downside within the $61.71 level in resistance with the price forming higher lows in the range. The rejection wicks in this price zone indicates selling pressure and accumulation at the $58 price level.
Based on the current technical outlook, I would consider a short position around $58.00, targeting $55.60, with a stop above $59.36.