Oil Rally Kills Silver’s Rate Cut Bid
Spot Silver (XAGUSD) fell $1.72, or 2.87%, trading at $58.14 early Monday as the U.S.-Iran escalation sent crude oil higher and took the rate cut case down with it. The dollar firmed, Treasury yields climbed, and silver caught selling from both sides at once. Buyers failed to hold gains again and the selling picked up speed into the start of the week.

Daily 10-Year U.S. Treasury Bond Yield Technical Analysis
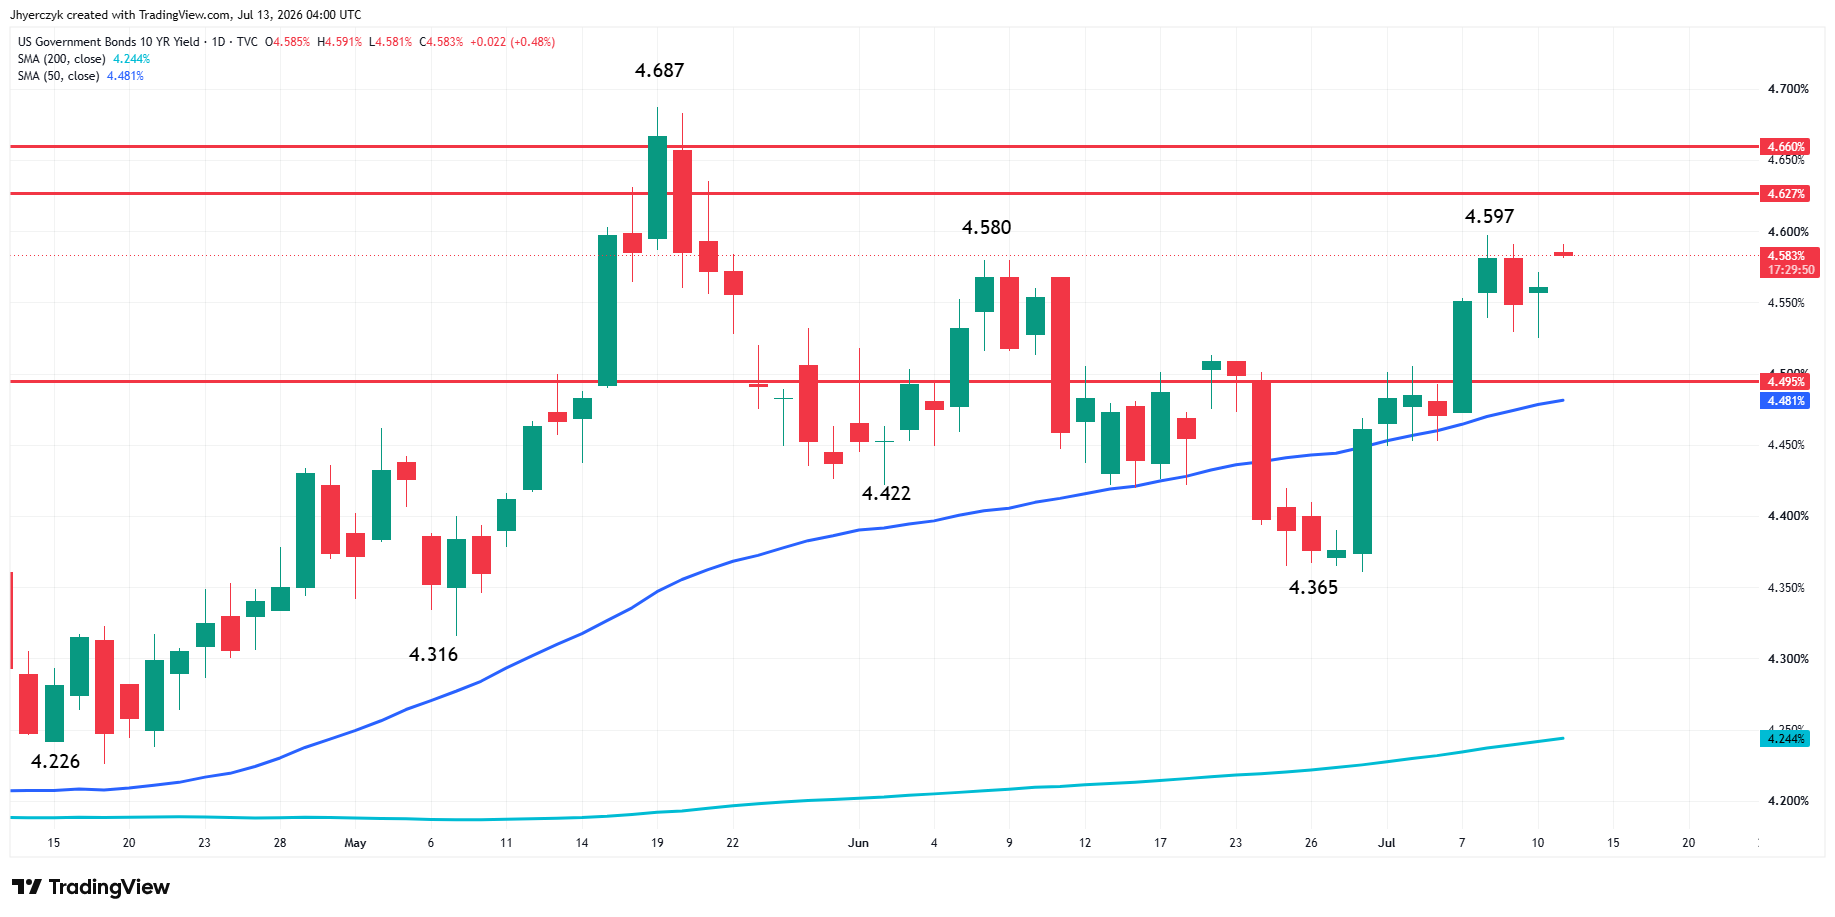
U.S. 10-Year Treasury Bond yields are edging higher early Monday. At 03:53 GMT, the 10-year yield is at 4.583%, up 0.022 or +0.48%. This puts it just under last week’s high at 4.597%. Taking out this level will signal a resumption of the uptrend with traders setting their sights on the May 19 main top at 4.687%. However, traders should note that previous highs were reached at 4.627% to 4.660%. The bunching of these previous tops makes 4.627% to 4.687% a critical area to overcome.
A trade under 4.525% could weaken the uptrend enough to challenge the 50-day moving average at 4.481%, which is currently offering short-term trend guidance and providing support.
Daily U.S. Dollar Index Technical Analysis
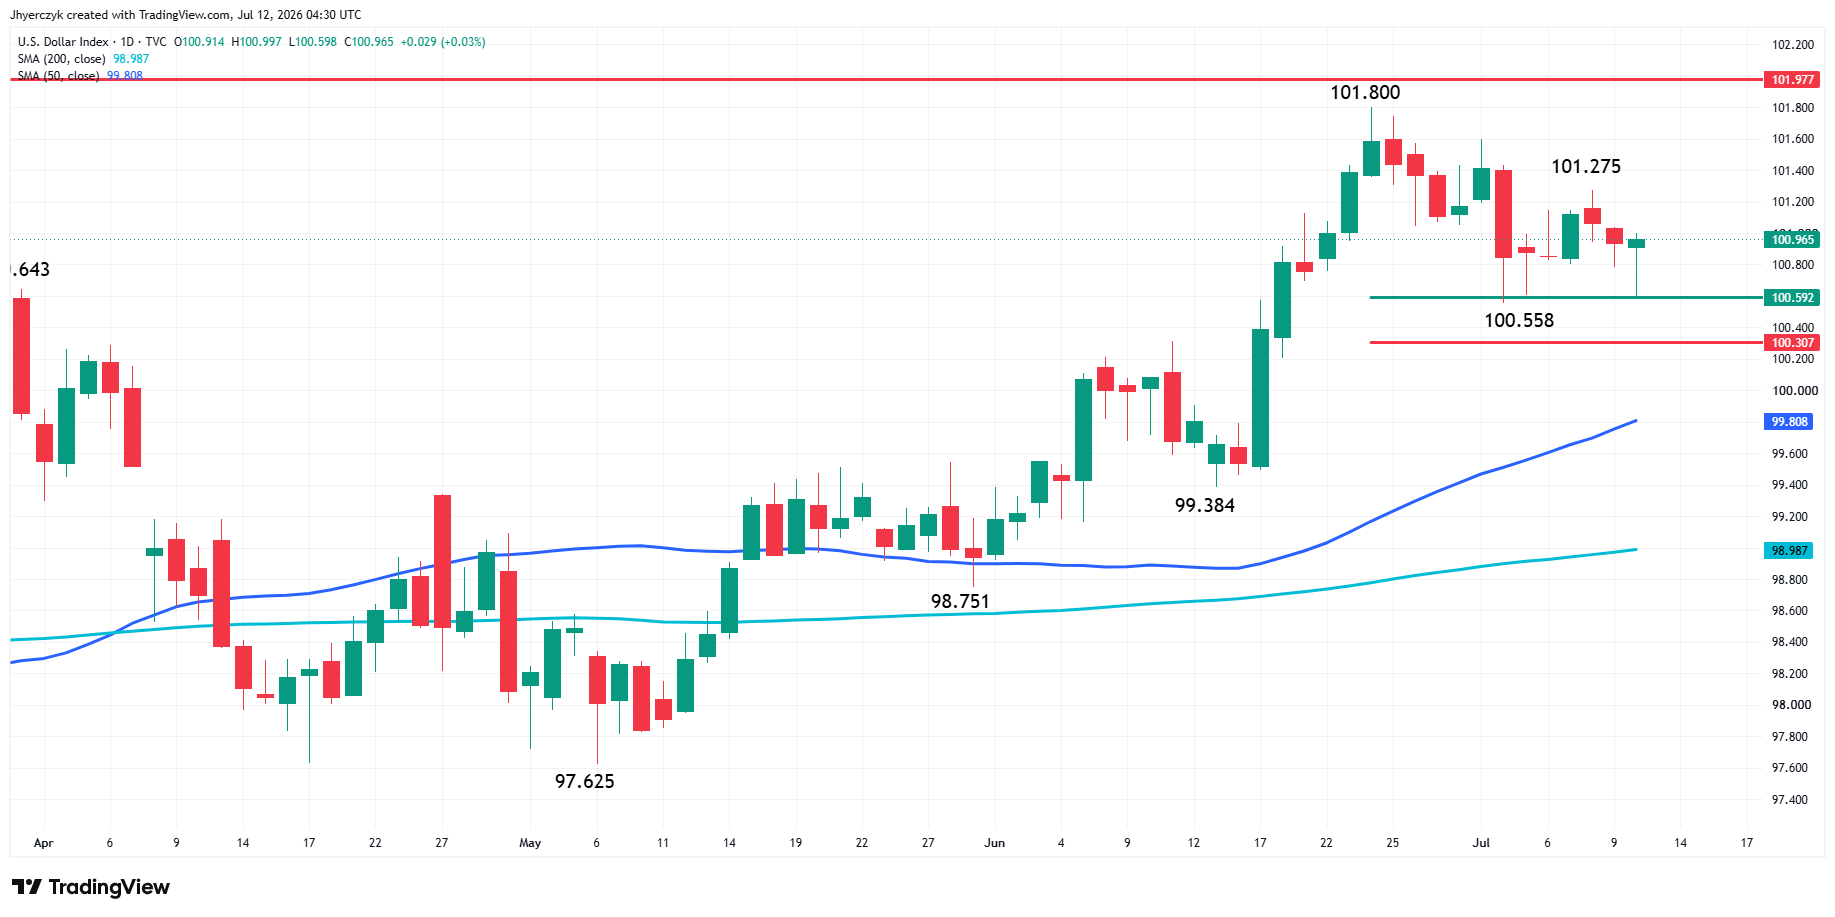
The U.S. Dollar Index (DXY) is trading higher early Monday as traders try to build on the rebound from a key intermediate retracement zone. The current two-day rally, however, is facing headwinds at the short-term retracement zone resistance. This type of price action tends to indicate impending volatility.
The intermediate range is 99.384 to 101.800. Its retracement zone at 100.592 to 100.307 stopped the selling at 100.558 on July 2 and at 100.598 on July 10.
Silver Price Forecast
Every new Silver analysis as it publishes, today's technical signal and key levels, live price — on one page.
See all Silver forecastsThe short-term range is 101.800 to 100.558. Its retracement zone at 101.179 to 101.326 is currently being tested. Taking out the top of the retracement zone at 101.326 could trigger an acceleration to the upside with the next major target the June 24 main top at 101.800. Another long-term top at 101.977 could prevent an even bigger breakout.
In addition to the retracement zone at 100.592 to 100.307, the index is also well-supported by the 50-day moving average at 99.860 and the 200-day moving average at 99.004.
The War Is Bearish for Silver Right Now
Iran struck a vessel traveling on what it called an unauthorized route and then announced the closure of the Strait of Hormuz. U.S. Central Command responded with strikes on targets in Tehran. Iran hit back by targeting U.S.-linked installations in the United Arab Emirates, Kuwait, and Bahrain, raising the risk that the conflict spreads further across the region.
Every round of escalation pushes crude higher and silver traders already know what an oil spike does to the inflation picture and the Fed’s timeline. The 10-year yield climbed to 4.583% early Monday and the dollar rallied off key support. Both moved against silver at the same time.
The safe-haven money from the Middle East escalation is flowing into dollars and Treasuries, not metals. This is not a war trade that helps precious metals. It is a war trade that raises energy costs, keeps rates elevated, and strengthens the dollar. Silver is on the wrong side of all three.
Buyers have failed to hold gains on every recent rally attempt. The dip-buying crowd keeps showing up and keeps getting sold into. The oil rally would have to fade or the Fed would have to signal rate flexibility, and neither looks likely while the Strait of Hormuz is closed and U.S. military operations continue.
Inflation Data Lands Into a Hostile Setup
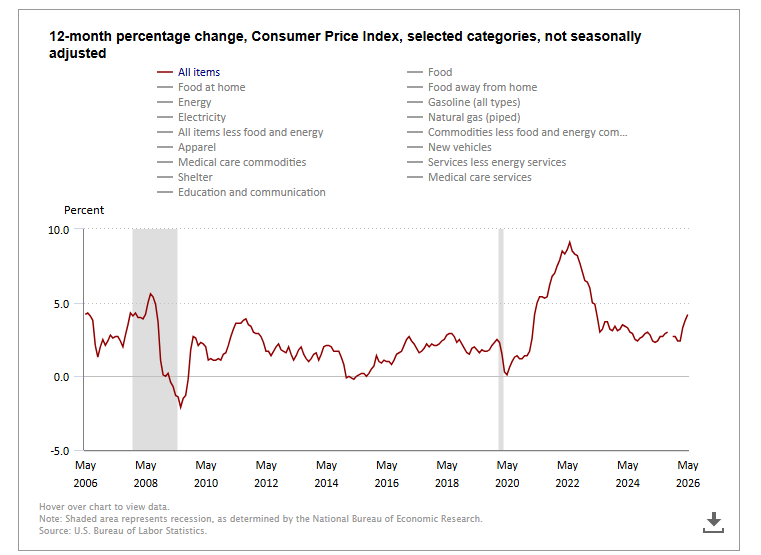
The economic calendar this week drops into the worst possible backdrop for silver bulls. CPI and PPI both report this week. A hot reading on either one reinforces the rate pressure already driving the sell-off. Even soft prints may not rescue the trade because rising oil prices are resetting inflation expectations in real time regardless of what last month’s data showed.
Retail sales, housing data, and weekly jobless claims round out the U.S. schedule. Chinese economic numbers also report this week and a weak reading compounds the selling pressure from the demand side at exactly the wrong time.
Daily Spot Silver (XAGUSD) Technical Analysis
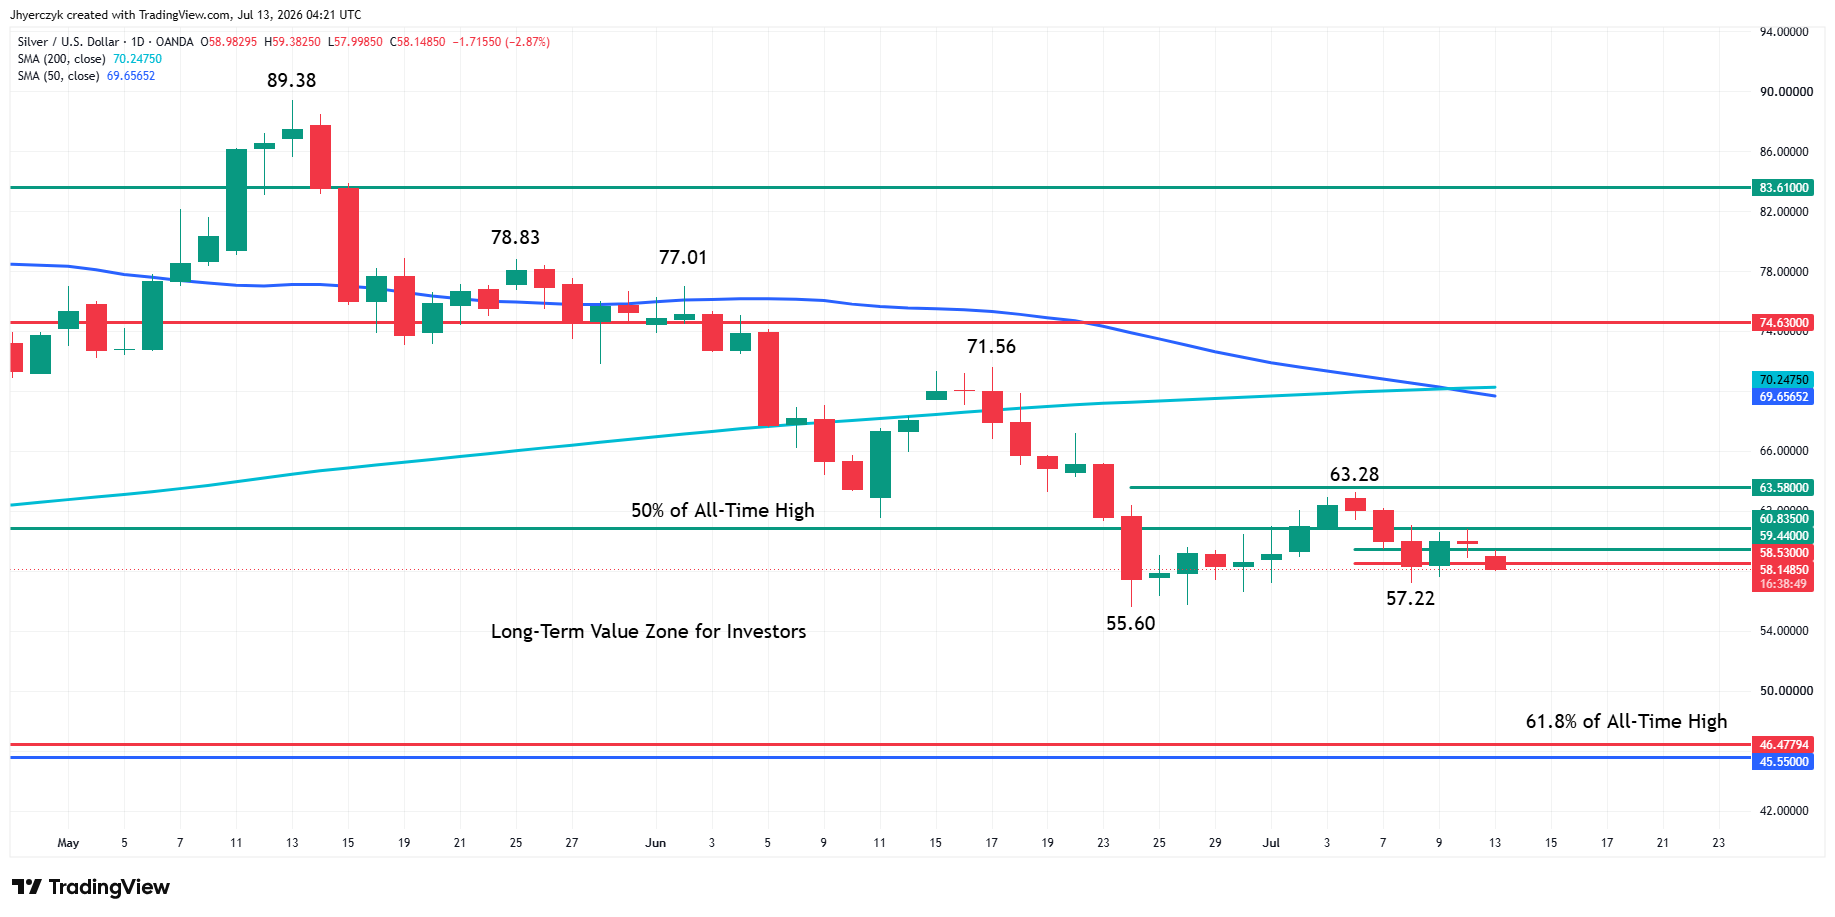
Spot silver is edging lower early Monday. The price action suggests sellers are eyeing the July 8 main bottom at $57.22 and the June 24 main bottom at $55.60. A trade through these levels will signal a resumption of the downtrend. The main trend will change to up on a trade through the last swing top at $63.28.
Looking at the bigger picture, XAG/USD is currently trading at the upper end of a long-term value zone at $60.835 to $46.48. The short-term retracement zone at $59.44 to $58.53 is currently being tested.
With the main trend down, aggressive counter-trend traders have been trying for two weeks to form a potentially bullish secondary higher bottom. The last attempt is $57.22. If it fails then $55.60 could be retested.
The set-up is pretty simple according to the daily chart formation. Aggressive counter-trend traders have to come in strong enough to form a secondary higher bottom and strong enough to create the upside momentum needed to take out the swing top at $63.28. If they fail to do so then the market becomes vulnerable under $57.22 and $55.60.
Long-term investors may recognize this area as value so we may see stair-step selling instead of sharp plunges.
What to Watch
The Middle East escalation is doing the damage indirectly. The oil rally is doing the damage and nothing on the calendar this week fixes it. CPI and PPI both report into a market where crude is already repricing inflation expectations forward, so even a cool number gets discounted before the ink dries. The dollar and yields are both running higher off the Middle East escalation and silver needs at least one of those to reverse. I don’t see where that reversal comes from while the Strait of Hormuz is closed and U.S. strikes continue.
The secondary higher bottom at $57.22 is the counter-trend play that matters. Holding it keeps $63.28 as the trigger for a trend change. Losing it opens $55.60 and the long-term value zone below, where the selling probably slows but the buying has to come from portfolios willing to sit through the rate pressure.
More Information in our Economic Calendar.