Dexe (DEXE) has reached the $46 upside target I discussed in my July 7 analysis. I am tilting bearish for this AI crypto coin to secure a quick profit in the coming days. Let me explain why.

DEXE Double Top Warns of a Deeper Pullback
The one-hour DEXE/USDT chart shows the token forming a double-top pattern after failing twice near the $48.50–$49 resistance area.
The setup typically forms when buyers attempt two breakouts at roughly the same level but fail to sustain momentum, signaling that demand may be weakening.
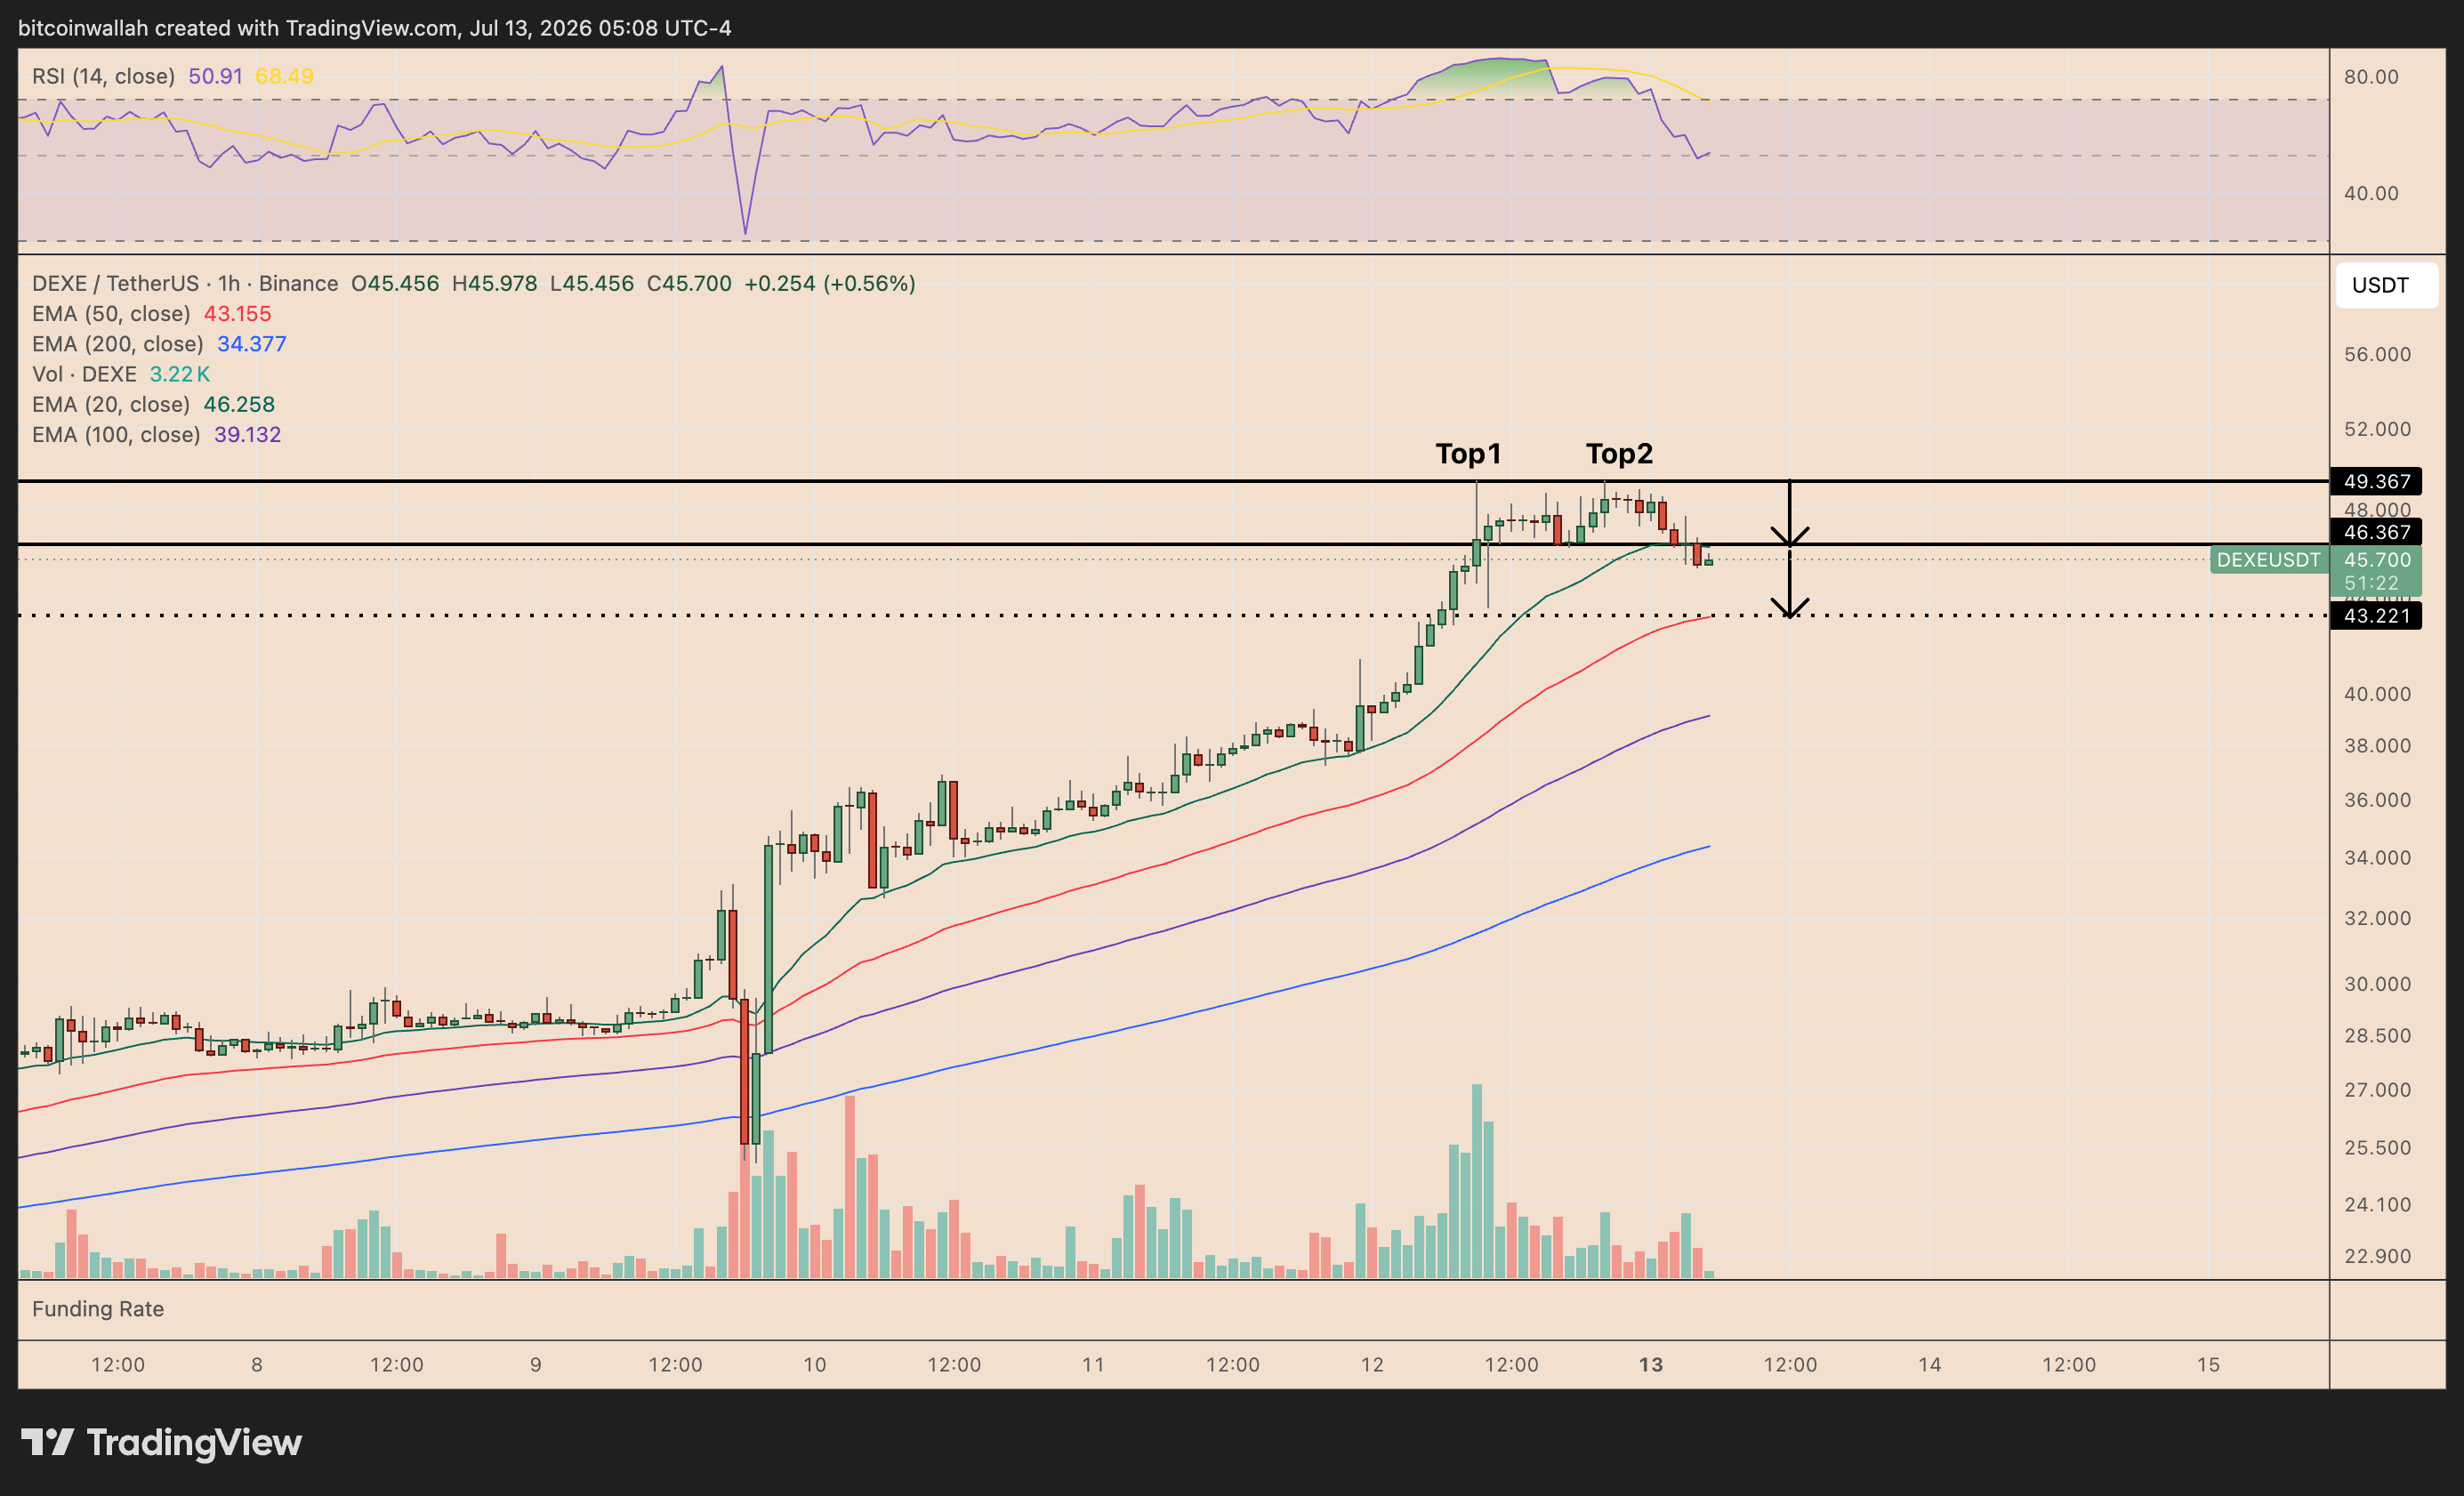
DEXE has since slipped below the pattern’s neckline near $46.35. A confirmed hourly close below this level would strengthen the bearish setup and put the measured downside target near $43.20 in focus.
The target is calculated by subtracting the distance between the double top and the neckline from the breakdown point.
Momentum indicators also support the pullback scenario. DEXE’s one-hour RSI has fallen toward 50 after previously entering overbought territory, showing that bullish momentum is cooling rapidly.
Meanwhile, the four-hour chart suggests that the correction could extend beyond the double-top target.
DEXE remains significantly stretched above its key exponential moving averages, while its four-hour RSI is still above 70, indicating overbought conditions. A broader mean-reversion move could therefore send the price toward the 20-period four-hour EMA, currently near $41.10.
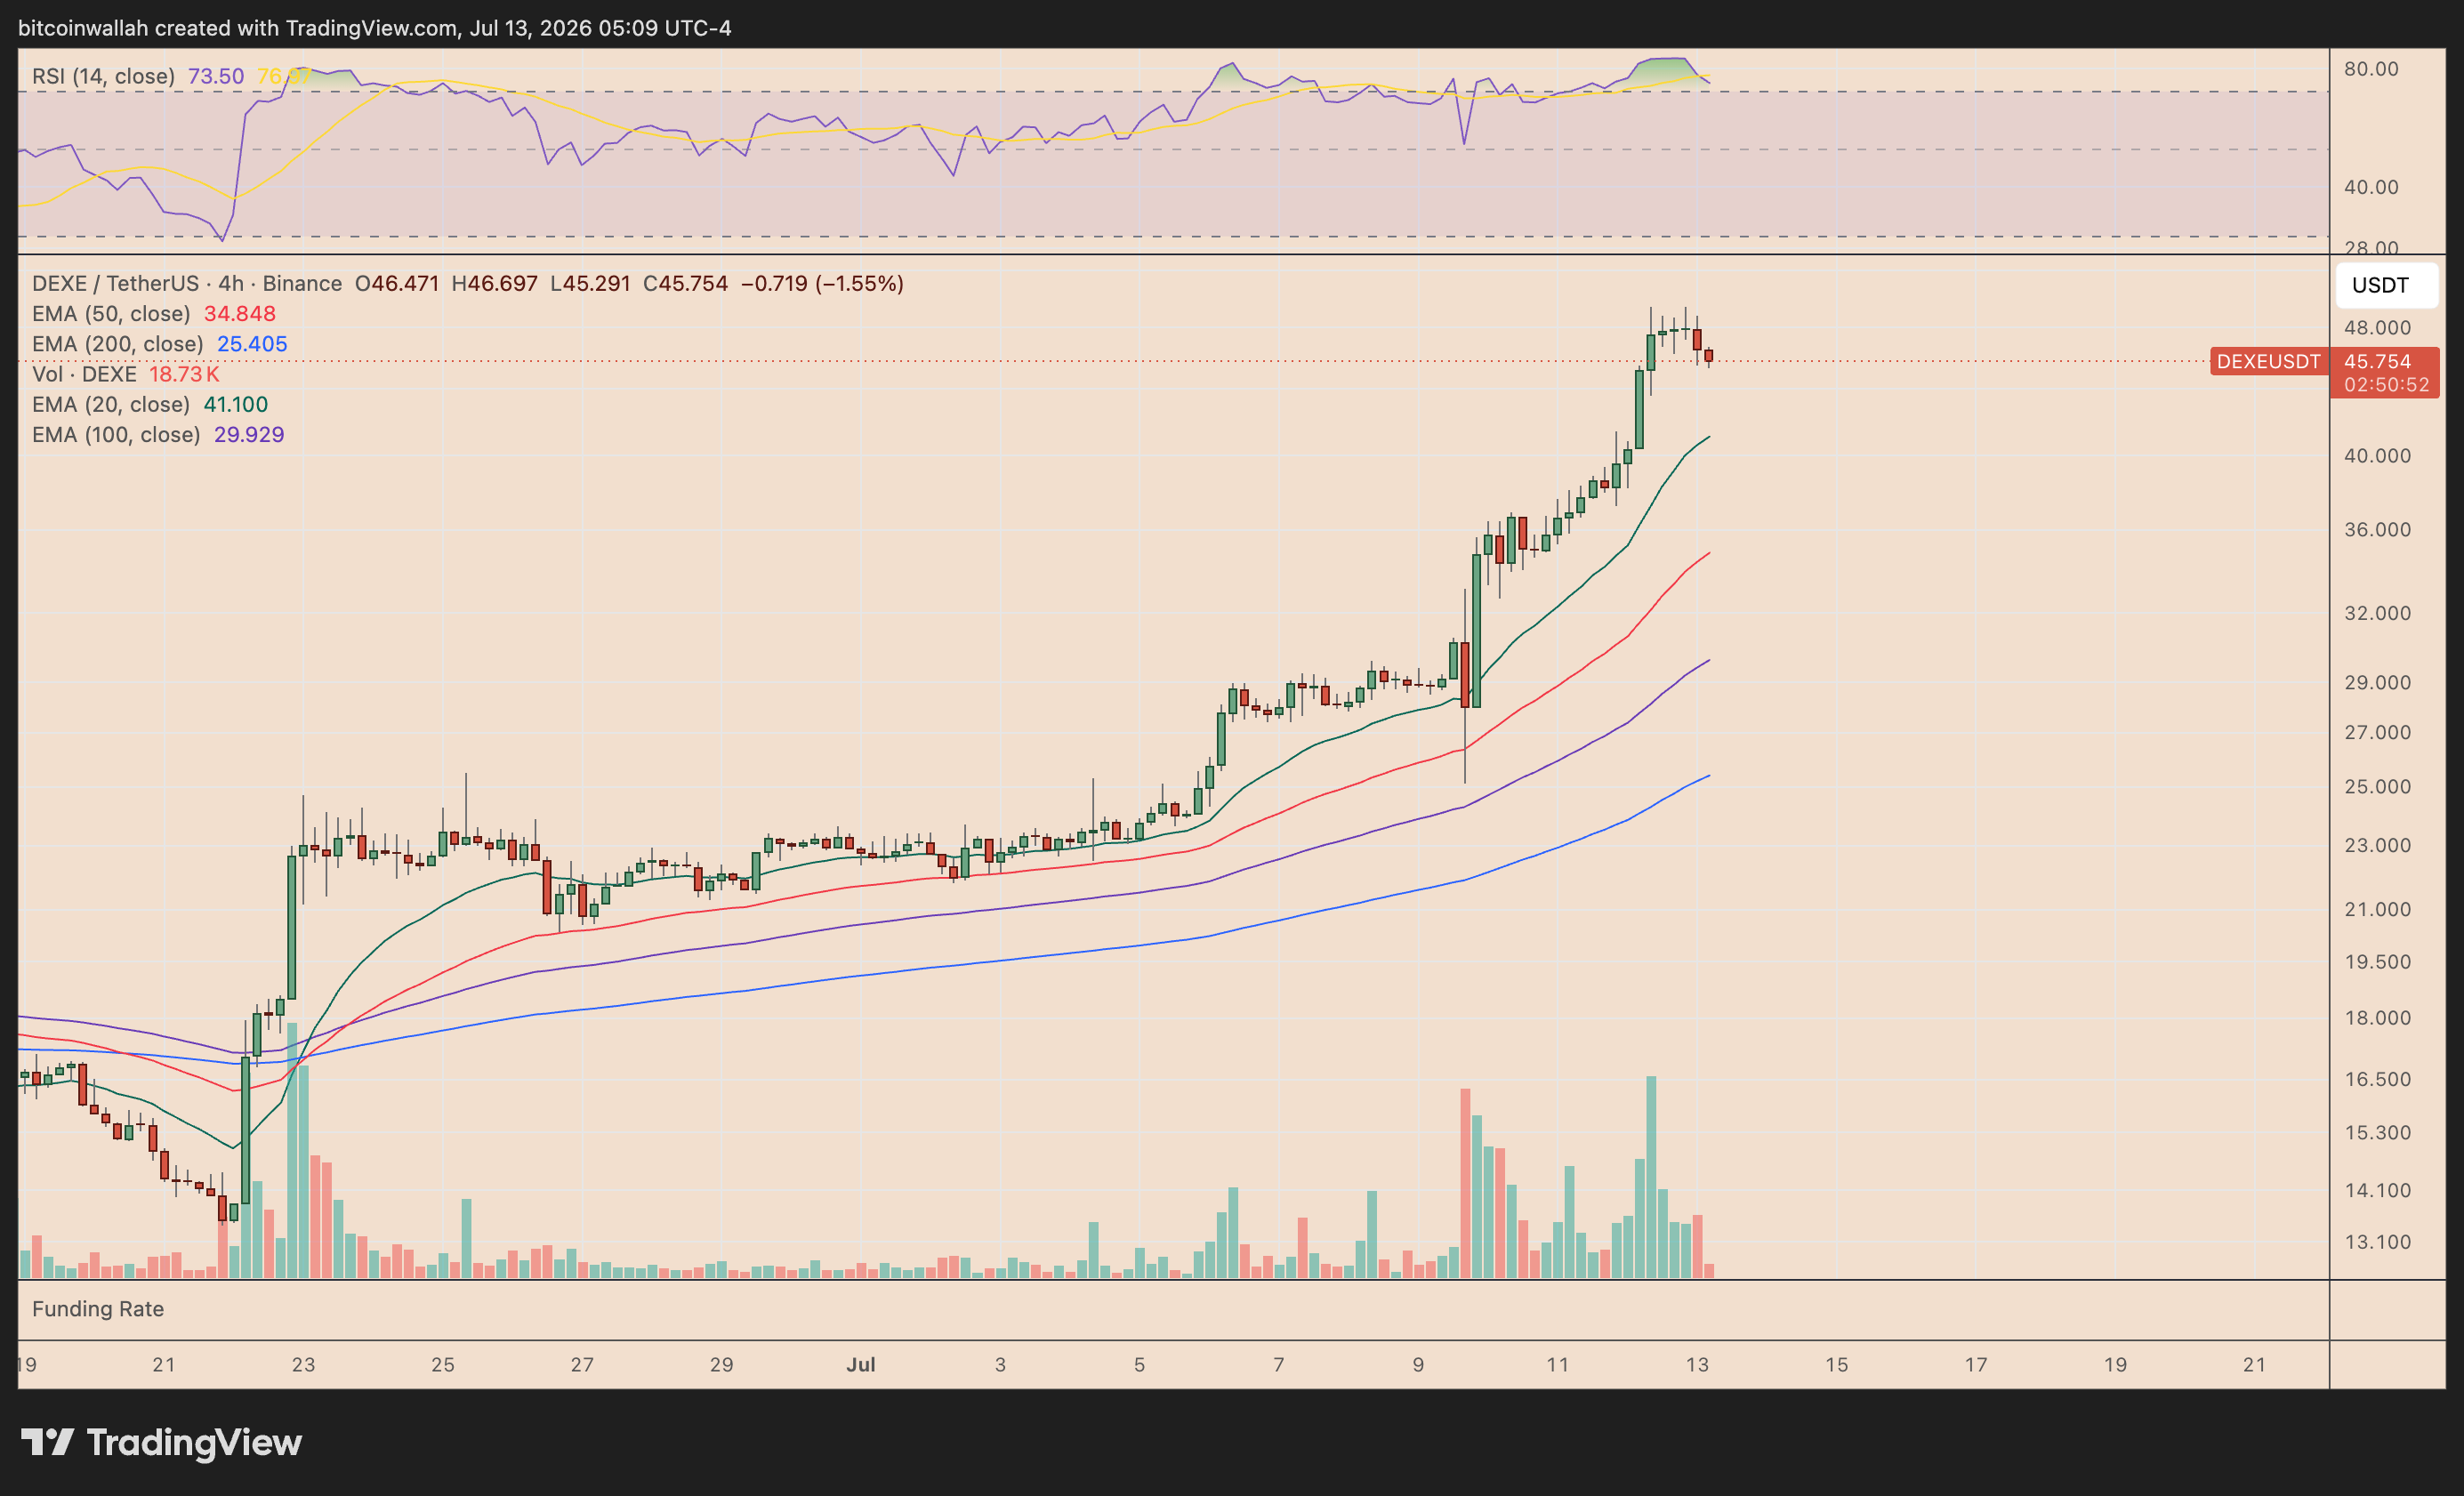
That would represent a decline of roughly 10% from current levels near $45.75.
The bearish outlook would weaken if DEXE reclaims the $46.35 neckline and closes decisively above the $49 resistance area. In that case, the double-top structure would be invalidated, opening the door to another leg higher.
DEXE Liquidation Map Points to Volatility on Both Sides
DEXE faces large liquidation clusters both above and below its current price, suggesting that the token may remain highly volatile in the near term.
Liquidation clusters are often treated as “price magnets” because they mark areas where a large number of leveraged positions could be forced closed. Traders may push prices toward these zones to access liquidity, although there is no guarantee that every cluster will be reached.
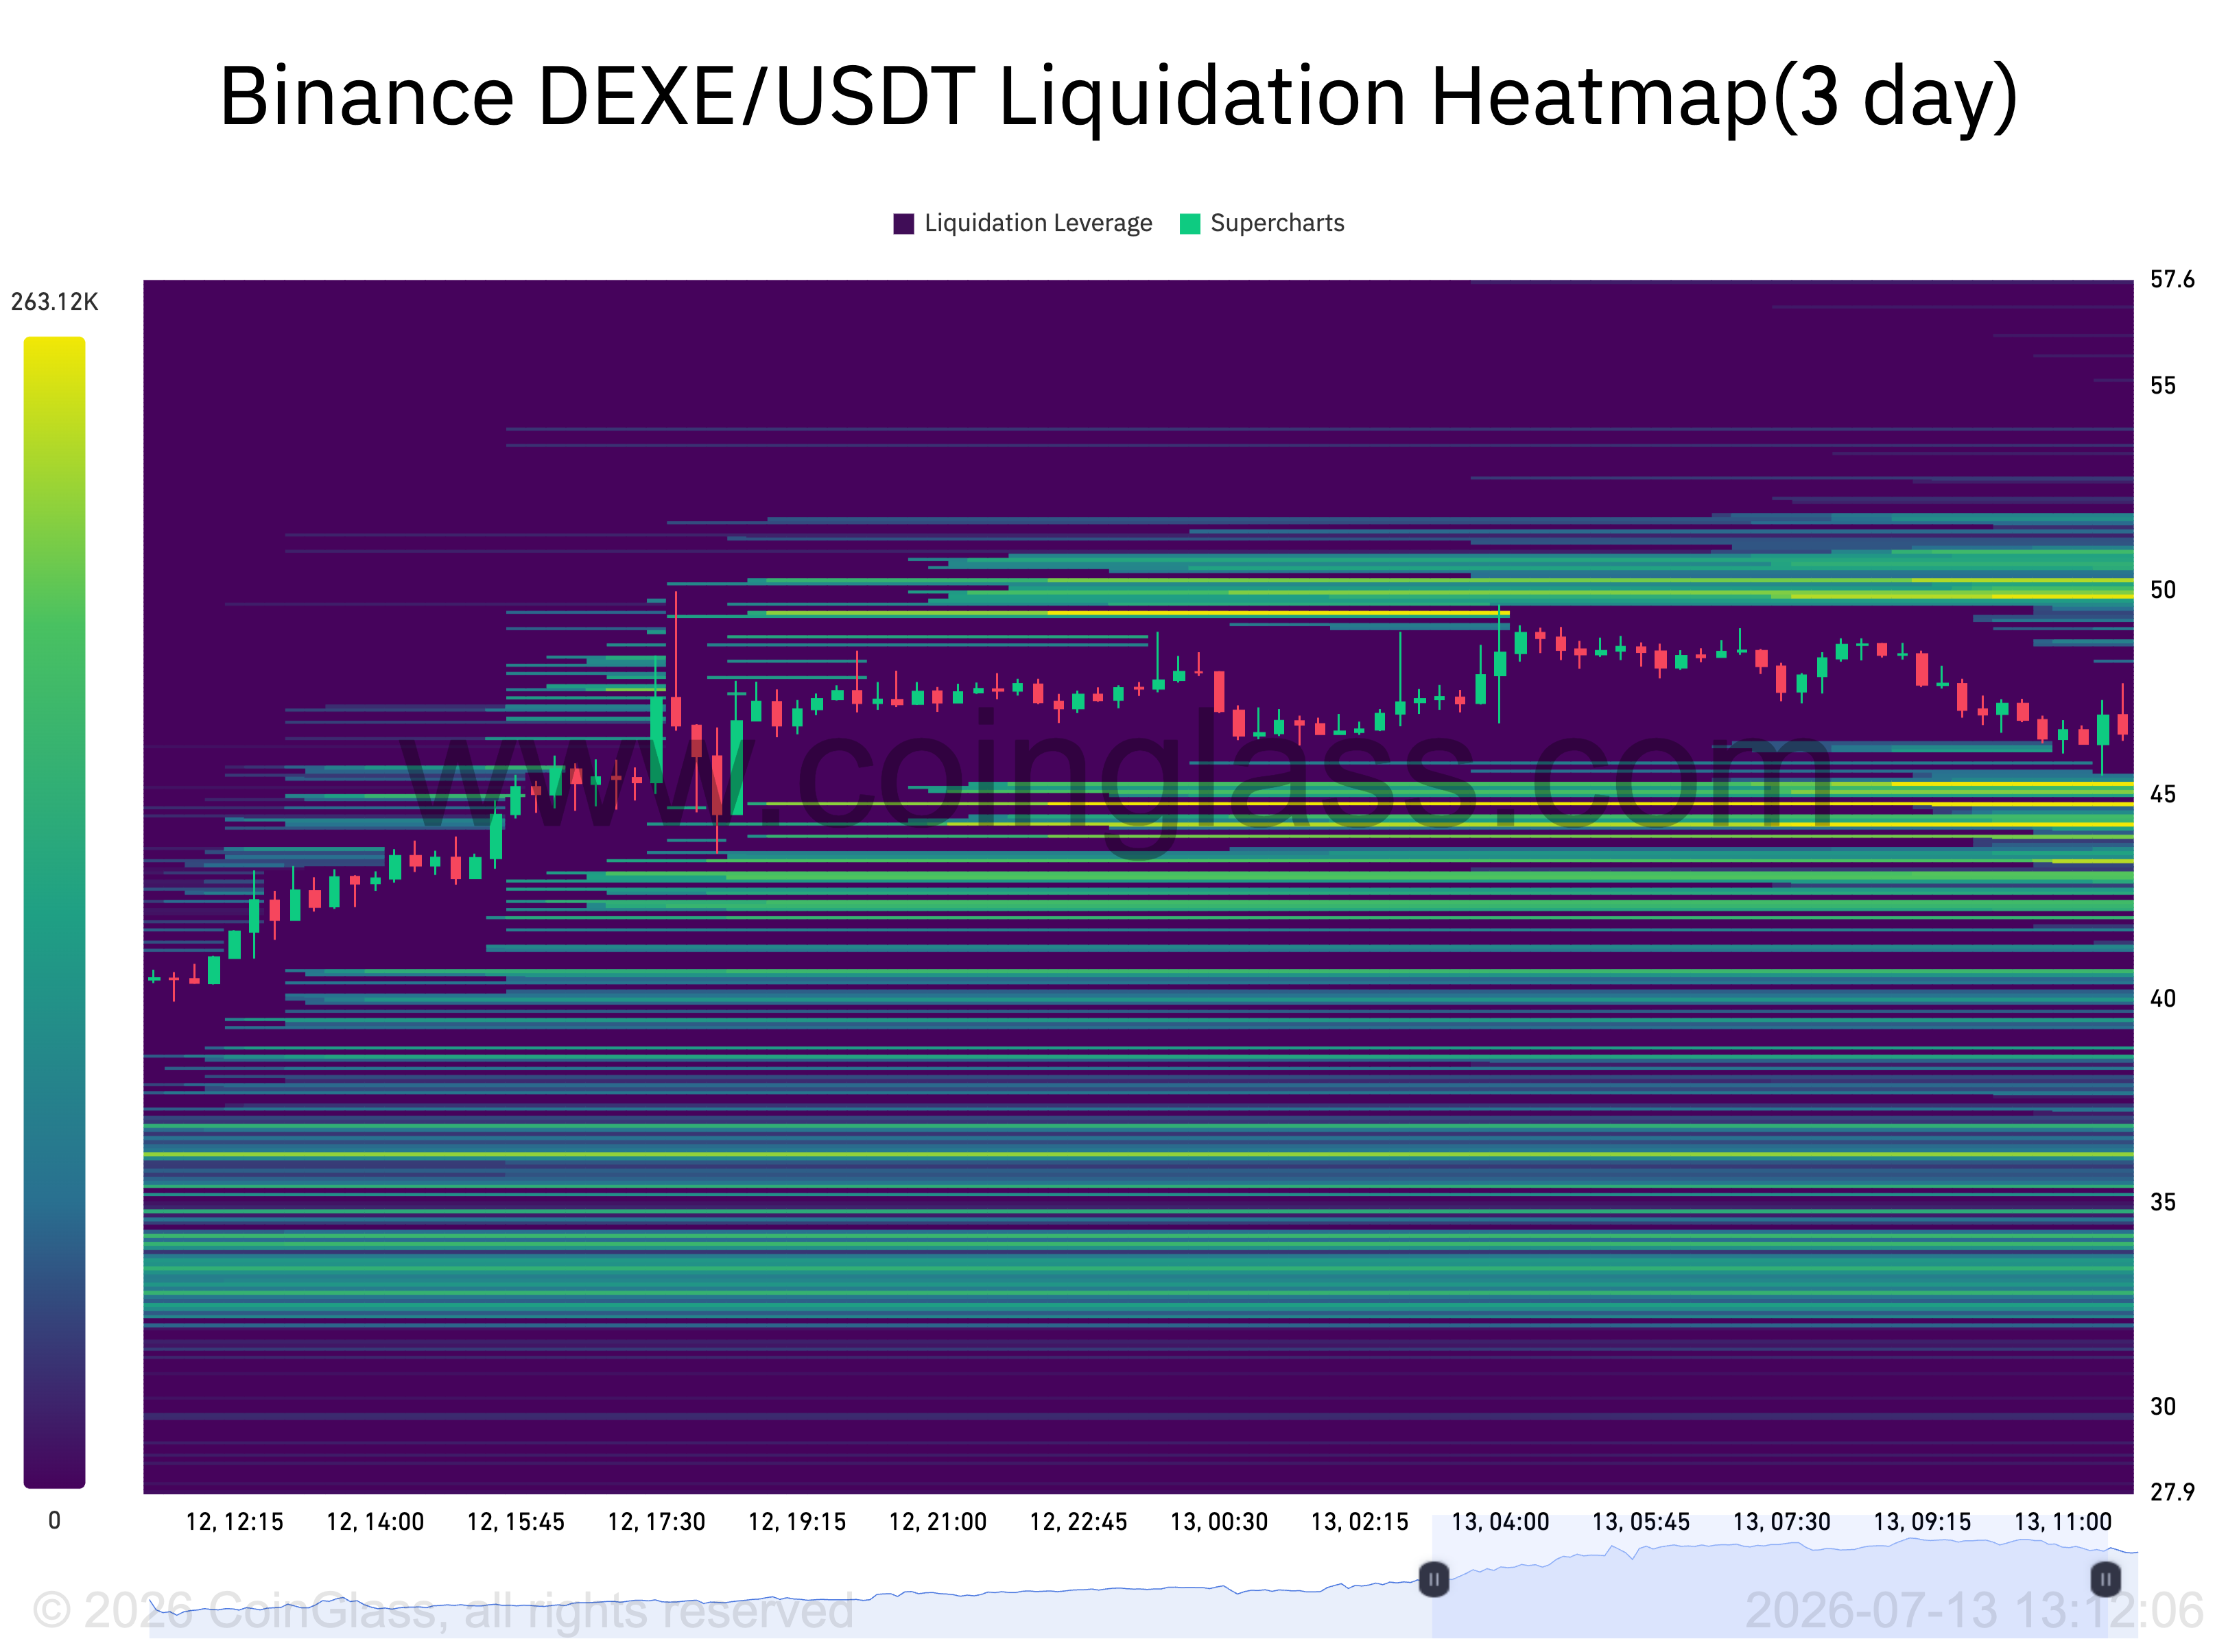
The broader imbalance, however, leans bearish. Cumulative long liquidations could reach about $9.59 million if DEXE falls toward $27.50, compared with roughly $3.13 million in short liquidations if the price rallies toward $57.50.
That means there is significantly more leveraged liquidity below the market than above it. A drop below $44.80 could therefore attract price toward the double-top target near $43.20 and the 20-period four-hour EMA around $41.10.
Conversely, a rebound toward $50 could trigger a short squeeze before sellers attempt to regain control.